MOLECULAR ADAPTATION TO ANTI-CANCER CHEMOTHERAPY IN LEUKEMIA
Eric Iredell Zimmerman
A dissertation submitted to the faculty of the University of North Carolina at Chapel Hill in partial fulfillment of the requirements for the degree of Doctorate of Philosophy in the Department of Pharmacology, School of Medicine.
ABSTRACT Eric I. Zimmerman
Molecular Adaptation to Anti-cancer Chemotherapy in Leukemia (Under the direction of Dr. Lee M. Graves)
Drug resistance to anti-cancer chemotherapy is a significant barrier to the
treatment of leukemia patients. Many times, resistance results from molecular
adaptation to drug exposure, such as genetic mutation of key enzymes,
up-regulation of pro-survival compensatory signaling pathways, and altered drug
transport. In this dissertation, we describe two examples of molecular drug
resistance in cell models of 1) Ara-C-resistant acute lymphoblastic leukemia (ALL)
and 2) imatinib-resistant chronic myelogenous leukemia (CML). First, we determined
that nucleoside transport is deficient in the Ara-C-resistant T-cell ALL CCRF-CEM
cell line (Ara-C/8C) in comparison to drug-sensitive parental CCRF-CEM cells.
Further study found a single point mutation in glycine residue 24 (G24) within
equilibrative nucleoside transporter 1 (ENT1), a protein responsible for nucleoside
uptake in these cells. Therefore, we tested the ability of G24A, G24R, and G24E
ENT1 mutants to transport uridine and Ara-C and localize to the plasma membrane.
Our data suggest that mutation of G24 disrupts ENT1 transport activity without
altering localization; thus, expression of mutant ENT1 may confer Ara-C resistance
in CCRF-CEM AraC/8C cells. In the second portion of the dissertation, we studied
iii
comparison to drug-sensitive parental MYL cells, Lyn was hyper-active, and loss of
Lyn activity sensitized cells to imatinib treatment. We determined that Lyn inhibited
miR181 microRNA (miRNA) expression in MYL-R cells at the transcriptional level. In
addition, we determined that miR181b targeted the 3’ UTR of Mcl-1, a pro-survival
protein associated with drug-resistance, resulting in Mcl-1 degradation. Thus, we
defined a molecular signaling axis by which Lyn may confer drug resistance in
imatinib-resistant CML. We attempted to elucidate the mechanism of Lyn-dependent
miR181 expression and found that 1) the transcription factors CREB and STAT5 do
not regulate miR181a/b and 2) Lyn may regulate miR181c/d expression through
modification of histone acetylation. These studies contribute to our knowledge of
drug resistance mechanisms in leukemia and provide novel biomarkers for the
ACKNOWLEDGEMENTS
This work would have not been possible if it were not for the support I
received from numerous people. First and foremost, I would like to thank my mentor,
Dr. Lee Graves, for providing me the opportunity to work in his laboratory. His
enthusiasm for science is contagious and his endless positive focus taught me that
there are no barriers in scientific research. I would also like to thank my dissertation
committee members, Dr. Rob Nicholas, Dr. Gary Johnson, Dr. Scott Hammond, and
Dr. David Lawrence, for their creative insight and constructive criticism of my
research projects.
Over the years, I have benefited from working with numerous colleagues at
UNC through collaboration and insightful discussion that have helped me progress
as a Ph.D. student. In particular, I would like to thank present and former members
of the Graves lab – Dr. Andrea Leisewitz, Dr. Brian Dewar, Dr. Eric Wauson, Dr.
Matt Higgins, Chris Showers, Shannon Jones, Jing Yang, Jen Nichols, Amanda
Blackwelder, Dr. Karen Kassel, Matt Cooper, Nathan Cox, and Sreerupa Roy.
I would also like to acknowledge people who have had a direct impact on the
research discussed in this manuscript. For help with the ENT1 project and for being
a fantastic resource, scientific role model, and friend, I would like to thank Dr.
Andrea Leisewitz. For pivotal help with the miRNA projects, I would like to thank Dr.
v
histone modification and Dr. Brian Dewar, Dr. James Duncan, and Marty Whittle for
contributions to the mass spectrometry experiments.
I have benefited from collaborations not mentioned in this manuscript. For this
I would like to thank Dr. Ekhson Holmuhamedov, Bryce Johnson, Dr. Qunzhao
Wang, Dr. David Lawrence, Dr. Pilar Blancafort, Dr. Sujey Beltran, Dr. Richard
Christopherson, Zoe Che, Dr. Tim Haystead, and Dr. Kristy Richards. In addition, I’d
like to acknowledge my financial support from the UNC Department of
Pharmacology, UNC CMB Program, and the American Heart Association.
Finally, I would like to thank my family and friends for their enduring love and
support. In particular, I would like to thank my wife, Katie Zimmerman, for providing
encouragement through the ups and downs of graduate school. Completion of this
TABLE OF CONTENTS
TABLE OF CONTENTS ... vi
LIST OF FIGURES ... xi
LIST OF ABBREVIATIONS ... xiii
CHAPTER I ... 1
1.1. Introduction to leukemia ... 2
1.1.1. Overview of leukemia... 2
1.1.2. Lymphoblastic leukemia ... 4
1.1.2.1. CLL overview and standard of care ... 4
1.1.2.2. ALL overview and standard of care ... 5
1.1.3 Myelogenous leukemia ... 6
1.1.3.1. CML overview and standard of care ... 6
1.1.3.2. AML overview and standard of care ... 8
1.2. ENTs and drug resistance ... 9
1.2.1. ENT overview and functional aspects ... 9
1.2.2. Regulation of ENT1 ...12
1.2.3. Resistance to nucleoside analog treatment ...13
1.2.3.1. Introduction to nucleoside analogs ...13
1.2.3.2. Nucleoside analog transport and resistance ...14
1.3. Kinase signaling in leukemia ...15
1.3.1. Overview of kinase function ...15
1.3.2. BCR-Abl kinase ...16
1.3.2.1. Overview and significance to CML ...16
vii
1.3.2.3. Imatinib and mechanisms of imatinib resistance ...18
1.3.2.4. Second generation BCR-Abl kinase inhibitors ...19
1.3.3. Lyn kinase in CML/AML ...20
1.3.3.1. Overview of Lyn kinase function ...20
1.3.3.2. Lyn and drug resistance ...21
1.4. MicroRNAs and leukemia ...22
1.4.1. MicroRNA biogenesis ...22
1.4.2. MicroRNA regulation ...25
1.4.3. MicroRNAs and leukemia ...26
1.5. Bcl-2 family proteins ...27
1.5.1. Overview of the Bcl-2 family...27
1.5.2. Unique aspects of Mcl-1 ...30
1.5.3. Bcl-2 family proteins and drug resistance ...31
CHAPTER II ...33
2.1. Chapter 3 materials and methods ...34
2.1.1. Cell culture and reagents ...34
2.1.2. Total RNA extraction and cDNA synthesis ...34
2.1.3. Non-quantitative RT-PCR and DNA sequencing ...35
2.1.4. Construction of expression vectors and cell transfection ...35
2.1.5. [3H]-Uridine and [3H]-Ara-C uptake assays ...36
2.1.6. Confocal microscopy ...36
2.1.7. Isolation of membranes and [3H]-NBMPR binding assay...36
2.1.8. Statistics ...37
2.2. Chapter 3 addendum materials and methods ...37
2.2.1. Cell culture and reagents ...37
2.2.3. Caspase 3 activity assay ...38
2.2.4. [3H]-Uridine and [3H]-Ara-C uptake assays ...39
2.2.5. Isolation of membranes and [3H]-NBMPR binding assay...39
2.2.6. Quantitative RT-PCR ...39
2.2.7. Statistics ...40
2.3. Chapter 4 materials and methods ...40
2.3.1. Cell culture and reagents ...40
2.3.2. Nucleofection ...41
2.3.3. Plasmid constructs and site-directed mutagenesis ...41
2.3.4. Caspase 3 activity assay ...42
2.3.5. Quantitative RT-PCR-based miRNA expression profiling ...42
2.3.6. Quantitative RT-PCR analysis of miR181 expression ...43
2.3.7. Western blot analysis ...44
2.3.8. Transfection and luciferase activity assay ...45
2.3.9. Statistics ...45
2.4 Chapter 4 supplemental methods ...46
2.4.1. Quantitative RT-PCR analysis of miR181b expression ...46
2.4.2. Plasmid constructs and cell transfection ...47
2.4.3. Lyn kinase peptide construction and peptide-based Lyn activity assay ...47
2.5. Chapter 5 materials and methods ...47
2.5.1. Cell culture and reagents ...47
2.5.2. Phospho-kinase antibody array ...48
2.5.3. Western blot analysis ...48
2.5.4. Total RNA extraction and cDNA synthesis ...49
2.5.5. Non-quantitative RT-PCR and DNA sequencing ...49
ix
2.5.7. Nucleofection ...50
2.5.8. Statistics ...50
CHAPTER III ...51
3.1. Abstract ...52
3.2. Introduction ...52
3.3. Results ...54
3.3.1. Functional loss of ENT1 activity in Ara-C/8C cells is independent of mRNA expression ...54
3.3.2. Identification of a point mutation in ENT1 from Ara-C/8C cells that disrupts transport activity ...55
3.3.3. The G24R ENT1 mutant maintains plasma membrane localization but is deficient in NBMPR binding ...56
3.4. Discussion ...57
3.5. Figures ...59
3.6. Addendum ...62
3.7. Addendum figures ...65
CHAPTER IV...68
4.1. Abstract ...69
4.2. Introduction ...70
4.3. Results ...72
4.3.1. Lyn kinase over-expression in MYL-R cells confers drug resistance ...72
4.3.2. MiR181 expression is reduced in MYL-R cells ...73
4.3.3. Lyn kinase inhibition increases miR181 expression in MYL-R cells ...74
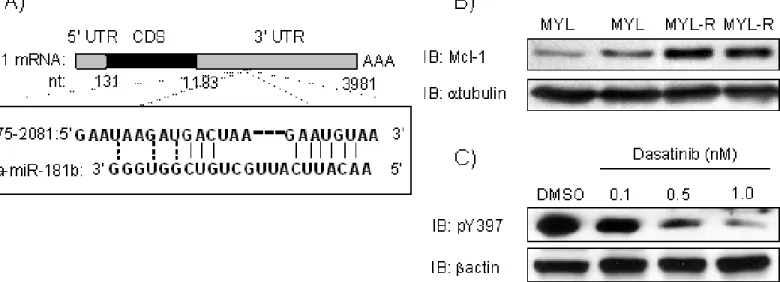
4.3.4. Mcl-1 is a target of miR181b ...75
4.3.5. Lyn kinase regulates miR181b and Mcl-1 expression in AML ...76
4.5. Figures ...80
4.6. Supplemental figures ...89
CHAPTER V ...95
5.1. Abstract ...96
5.2. Introduction ...97
5.3. Results ...99
5.3.1. Lyn kinase inhibition decreases the phosphorylation of CREB and STAT5 ...99
5.3.2. Pri-miR181b expression is regulated by Lyn kinase ... 100
5.3.3. CREB and STAT5 do not regulate miR181b expression in MYL-R cells ... 101
5.3.4. MiR181c/d expression is increased after treatment with inhibitors against DNMT and HDAC ... 102
5.3.5. Lyn kinase regulates histone acetylation and methylation ... 104
5.3.6. HDAC inhibition decreases Lyn kinase expression and activity ... 104
5.4. Discussion ... 105
5.5. Figures ... 111
5.6. Supplemental figures ... 119
CHAPTER VI... 121
6.1. Summary ... 122
6.2. Future Direction #1: Determine the kinome response to Lyn inhibition ... 125
6.3. Future Direction #2: Define miR181 regulation in AML ... 129
6.4. Conclusions ... 130
6.5. Figures ... 132
xi
LIST OF FIGURES
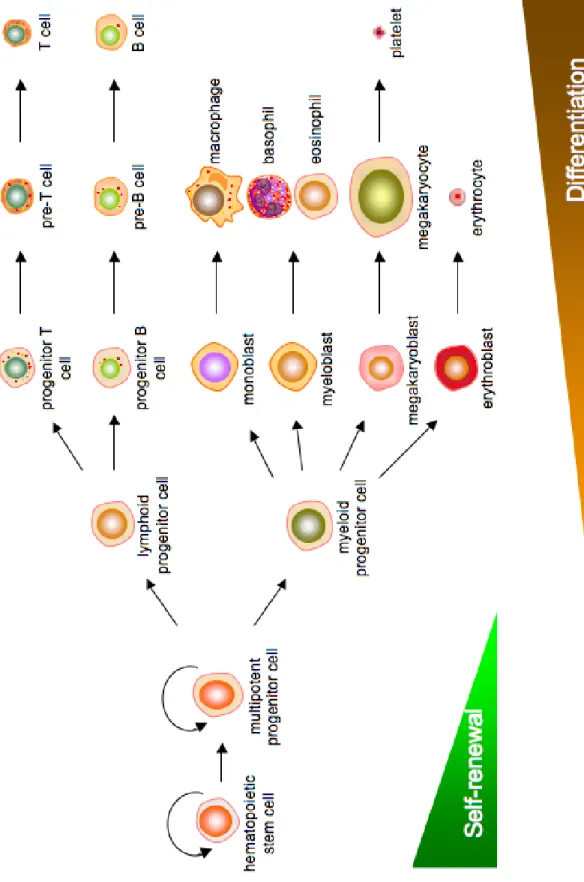
Figure 1.1. Hematopoiesis of blood-derived cells. ... 3
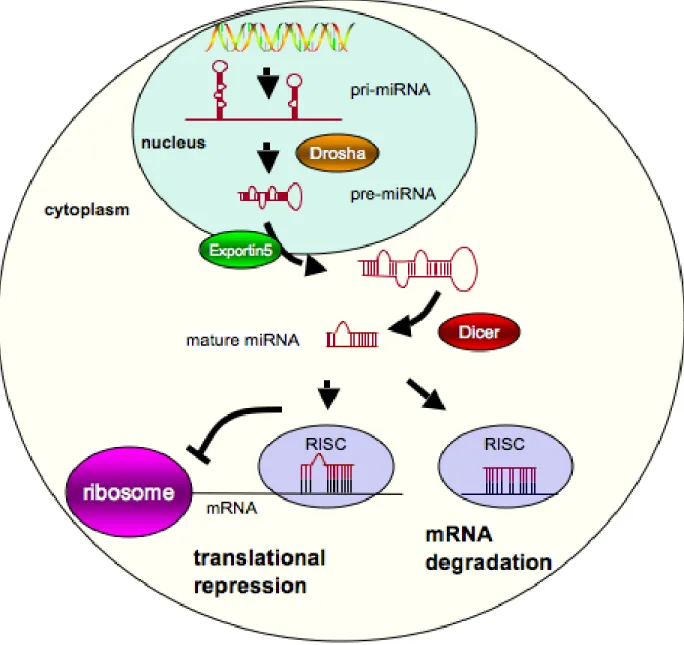
Figure 1.2. MicroRNA biogenesis. ...24
Figure 1.3. Regulation of mitochondria-mediated apoptosis by the Bcl-2 family of proteins. 29 Figure 3.5.1. Comparison of [3H]-uridine uptake, [3H]-NBMPR binding, and ENT1 mRNA expression between CCRF-CEM cells and Ara-C/8C cells. ...59
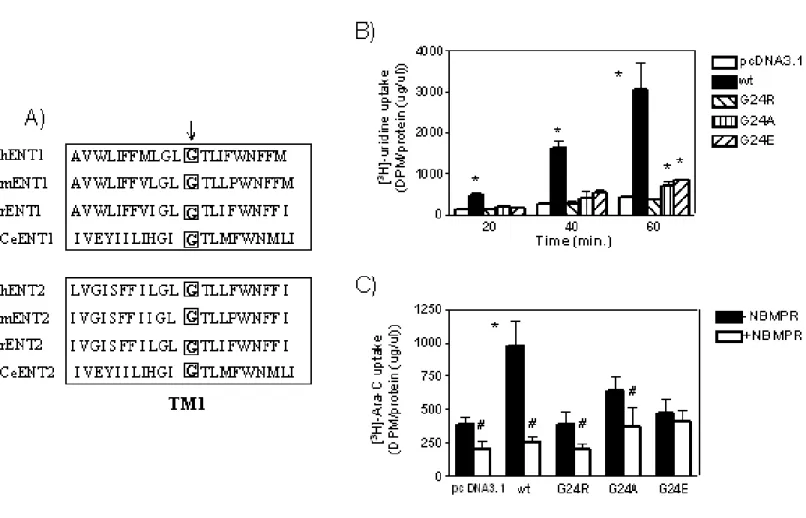
Figure 3.5.2. Substitution of G24 in ENT1 disrupts nucleoside and Ara-C transport activity. ...60
Figure 3.5.3. The G24R ENT1 mutant lacks [3H]-NBMPR binding even though plasma membrane expression is maintained. ...61
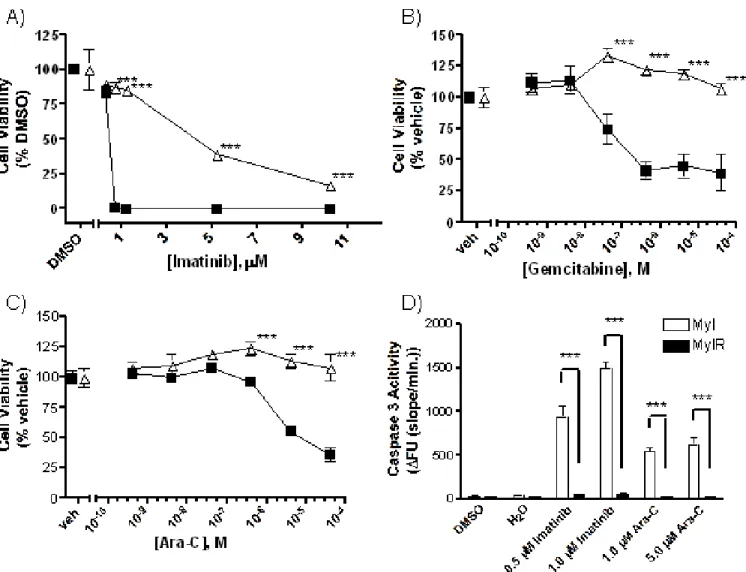
Figure 3.7.1. MYL-R cells are resistant to imatinib and nucleoside analogs. ...65
Figure 3.7.2. ENT expression is similar between MYL and MYL-R cells. ...66
Figure 3.7.3. MYL and MYL-R cells have similar transport activity. ...67
Figure 4.5.1. Lyn kinase confers imatinib resistance in MYL-R cells. ...81
Figure 4.5.2. Loss of miR181 expression in MYL-R cells. ...83
Figure 4.5.3. Lyn kinase inhibition increases miR181 expression. ...85
Figure 4.5.4. Mcl-1, a predicted target of miR181, is over-expressed in MYL-R cells. ...86
Figure 4.5.5. MiR181b inhibits Mcl-1 expression. ...87
Figure 4.5.6. Up-regulation of Lyn kinase expression in HL-60 cells decreases miR181b expression and increases Mcl-1 expression. ...88
Supplemental Figure 4.6.1. Lyn kinase is hyper-activated in MYL-R cells. ...89
Supplemental Figure 4.6.2. Lyn kinase inhibition sensitizes MYL-R cells to imatinib treatment. ...90
Supplemental Figure 4.6.3. Quantitative RT-PCR of miR181b and miR181d expression. ...91
Supplemental Figure 4.6.5. Treatment with Lyn kinase-directed siRNA increases miR181b
expression. ...93
Supplemental Figure 4.6.6. Lyn kinase over-expression decreases miR181b expression. ..94
Figure 5.5.1. Lyn kinase inhibition decreases CREB and STAT5 activity. ... 112
Figure 5.5.2. Regulation of pri-miR181b by Lyn kinase. ... 113
Figure 5.5.3. CREB and STAT5 do not regulate miR181b expression. ... 114
Figure 5.5.4. miR181c/d expression is increased by DNMT and HDAC inhibition. ... 116
Figure 5.5.5. Lyn kinase regulates histone post-translational modification. ... 117
Figure 5.5.6. HDAC inhibition decreases HSP90 activity and Lyn kinase expression. ... 118
Supplemental Figure 5.6.1. SNX5422-conjugated beads precipitate active HSP90. ... 119
Supplemental Figure 5.6.2. Sequence alignment of human HDAC1-3. ... 120
6.5.1. Analysis of kinase expression in MYL and MYL-R cells. ... 133
6.5.2. Confirmation of kinase expression in MYL and MYL-R cells. ... 134
xiii
LIST OF ABBREVIATIONS 5-aza-C 5-aza cytidine
Abl Abelson tyrosine kinase
ALL Acute lymphoblastic leukemia
AML Acute myelogenous leukemia
Ara-C Cytarabine
Bcl-2 B-cell CLL/lymphoma-2
BCR Breakpoint cluster region
CLL Chronic lymphoblastic leukemia
CML Chronic myelogenous leukemia
CNT Concentrative nucleoside transporter
CR Complete remission
CREB cAMP response element-binding protein
DNMT DNA methyltransferase
ENT Equilibrative nucleoside transporter
FLT3 Fms-like tyrosine kinase
HCT Hematopoietic cell transplant
HDAC Histone deacetylase
HSP Heat shock protein
ITD Internal tandem duplication
JAK Janus kinase
KIB Kinase inhibitor bead
MAPK Mitogen-activated protein kinase
Mcl-1 Myeloid cell leukemia-1
miRNA microRNA
NBMPR Nitirobenzylmercaptopurine riboside
Ph Philadelphia chromosome
PKA cAMP-dependent protein kinase
PKC Protein kinase C
RISC RNA-induced silencing complex
SFK Src family kinase
STAT Signal transducer and activator of transcription
TCL-1 T-cell leukemia/lymphoma-1
TF Transcription factor
TM Transmembrane
TSA Trichostatin A
TSS Transcriptional start site
UTR Untranslated region
VPA Valproic acid
WBC White blood cell
2 CHAPTER I
Introduction
1.1. Introduction to leukemia
1.1.1. Overview of leukemia
Leukemia is characterized by the unregulated growth of hematopoietic cells.
In 2010, there were estimated to be approximately 43,000 new cases of leukemia
with nearly 22,000 deaths expected to result from this disease [1]. The four major
types of leukemia include, from the myeloid cell lineage, acute myelogenous
leukemia (AML) and chronic myelogenous leukemia (CML) and, derived from the
lymphoid cell lineage, acute lymphocytic leukemia (ALL) and chronic lymphocytic
leukemia (CLL) (Fig. 1.1). Classification of leukemia as acute or chronic depends on
the overall proliferation rate of the disease as well as the level of cellular
differentiation. Acute leukemia is fast growing and requires immediate treatment;
cells are typically immature and undifferentiated. In contrast, cells in chronic
leukemia are more differentiated and slower growing and have enhanced survival in
comparison to normal cells. Leukemia patients are less able to combat infection due
3
1.1.2. Lymphoblastic leukemia
1.1.2.1. CLL overview and standard of care
Hematopoietic cells of the lymphoid cell lineage mature into B cells or T cells,
depending on the site of maturation (bone marrow and thymus, respectively), and
serve as integral components of the innate immune system. CLL is characterized by
lymphocytosis, including the following criteria: 1) expression of B cell-associated
antigens (CD19, CD20, and CD23); expression of the T cell-associated CD5
antigen; and 3) low levels of surface membrane immunoglobin (Ig) [2]. This disease
predominates in older individuals with a median age of diagnosis of 70 years [3]. In
addition, CLL is the most common leukemia in Western society where it accounts for
approximately 30% of all diagnosed leukemias [4]. Cytogenetic abnormalities have
not been consistently associated with either the cause or pathogenesis of CLL,
though some have been associated with prognosis. In particular, 11q and 17p
deletions are associated with progressive disease and shorter survival [5, 6]. In
addition, up-regulation of the Bcl-2 pro-survival protein often occurs in CLL [7].
Due to the heterogeneity of the disease, the prognosis of CLL patients is
extremely variable. Correlation studies of variable region immunoglobin heavy
chains (vHC) have determined that 30-40% of CLL patients express mutations or
rearrangements of these genes [8]. Though patients with vHC mutations tend to
have less malignant cancers, the appearance of mutation is independent of CLL
clinical stage. Recently, research has focused on CD38 and Zap-70 as prognostic
5
Whether the expression of these proteins is predictive of response to therapy is
unknown.
Traditionally, CLL has been treated with chlorambucil (Leukeran), a nitrogen
mustard-alkylating agent; however low complete remission (CR) responses in
patients have given way to treatment with antimetabolite agents or monoclonal
antibodies. Treatment with purine analogs, such as fludarabine (Fludara), results in
higher CR rates (20-40% vs. 10%) and longer disease-free survival [10].
Furthermore, the efficacy of fludarabine is improved upon combination with other
agents. For example, the combination of fludarabine, cyclophosphamide
(Cytoxan), and the monoclonal CD20 antibody rituximab (Rituxan) results in a
superior response rate than fludarabine alone and longer patient survival [11].
1.1.2.2. ALL overview and standard of care
The majority of ALL is diagnosed in children, comprising approximately 30%
of all childhood malignancies [12]. This disease is sub-divided into B-cell ALL
(B-ALL) and T-cell ALL (T-(B-ALL) depending on the cell lineage affected, which is
determined by the expression of lineage-specific CD antigens. Genetic
underpinnings for these diseases are often stratified; however, common to both
B-ALL and T-B-ALL is rearrangement of the Ig and T-cell receptor (TCR) genes [13]. The
presence of these and other genetic mutations, as well as the age of the patient,
leukocyte count, and presence or absence of central nervous system or testicular
leukemia involvement has a large impact on the treatment regimen. Of note, the
presence of the Philadelphia chromosome (Ph+) (discussed in detail in Section
all ALL cases; the incidence increases with age with approximately 3% of children
and 25% of adult ALL cases Ph+ [14, 15]. This mutation gives rise to the BCR-Abl
oncogene; thus, treatment with BCR-Abl-targeted inhibitors, such as imatinib
(Gleevec), is appropriate.
The overall survival is high (75-80%) for childhood ALL, whereas an overall
survival rate of only 40-50% is typically obtained in adults with ALL [16, 17]. Ph+
patients have a poor prognosis and experience a low CR rate; however, the
introduction of imatinib as a front-line treatment has dramatically improved the
5-year CR rate (80-90%) [14]. Ph- ALL is first treated with short-term intensive
chemotherapy consisting of antimetabolites (cytarabine (Ara-C; Cytosar-U),
methotrexate (Trexall)), alkylating agents (cyclophosphamide),
immunosuppressants (dexamethasone (Decadron), prednisone (Deltasone)),
and/or cytotoxic agents (vincristine (Oncovin), anthracyclines) [18]. Specifically,
treatment of adult ALL patients with the hyperfractionated cyclophosphamide,
vincristine, doxorubicin (Adriamycin), and dexamethasone (Hyper-CVAD) regimen
can obtain a CR rate >80% [19].
1.1.3 Myelogenous leukemia
1.1.3.1. CML overview and standard of care
In contrast to ALL, CML is relatively rare in children (<5% of cases) and has a
median age of onset between 55 and 60 years of age with nearly half of CML
patients over the age of 60 [20]. The hallmark of CML is the presence of a
7
is known as the Philadelphia (Ph) chromosome. This mutation was first described by
Peter Nowell in the mid-1960s and is found in approximately 95% of CML patients
[21, 22]. This specific translocation gives rise to the BCR-Abl kinase, a fusion of part
of the breakpoint cluster region (BCR) with the Abelson (Abl) tyrosine kinase.
BCR-Abl is the causative oncogene in Ph+ CML (reviewed in Section 1.3.2 BCR-BCR-Abl
kinase).
If untreated, CML progresses through three phases; in order of severity these
are chronic, accelerated, and blast crisis. Individuals in chronic phase may be
asymptomatic but have an elevated white blood cell (WBC) count (<15%
myeloblasts); most patients first present in this stage. However, eventually the
accelerated production of WBCs, including the increased presence of
undifferentiated myeloblasts (>30%), occurs as patients transition through the
accelerated phase into blast crisis. At this point, the production of normal blood cells
and blood-clotting platelets is compromised, typically resulting in mortality due to
anemia, infection, uncontrolled bleeding, or other complications. Treatment regimens
depend on the phase of disease. A younger patient of reasonable health in the
relatively indolent chronic phase typically undergoes allogeneic hematopoietic cell
transplant (HCT) within the first year of diagnosis [23]. HCT may be an option for
patients with advanced CML; however, the success of HCT treatment decreases
with increasing disease severity.
Traditionally, CML has been treated with antimetabolites (cytarabine),
interferon, or hydroxyurea (Hydrea). These regimens result in a complete
patients; nearly 80% of these patients experienced disease-free survival 10 years
after treatment [24, 25]. However, in 2001, the approval of imatinib, a BCR-Abl
inhibitor, revolutionized the treatment of CML. Treatment with imatinib produces a
major cytogenetic response in approximately 60% of patients and a complete
hematologic response (blood platelet cell counts return to normal) in 95% of patients
[26]. A study of 553 patients with chronic phase CML treated with continuous
imatinib therapy found that the 5-year survival rate was approximately 89% [27].
These superior results have made imatinib the front-line treatment used to treat
CML. More recently, second generation BCR-Abl inhibitors, such as nilotinib
(Tasinga) and dasatinib (Sprycel), have been approved for treatment of newly
diagnosed CML and CML patients resistant to imatinib [28-30].
1.1.3.2. AML overview and standard of care
AML is the most common type of leukemia in adults with a median age of
diagnosis between 65 and 75 years [12]. This disease has the lowest survival rate of
any leukemia and many patients are non-responsive to treatment or relapse after
initial therapy [31]. In contrast to CML, AML is a heterogeneous disease with a
variety of cytogenetic and molecular alterations. Cytogenetic abnormalities occur in
approximately 50-60% of newly diagnosed patients and some genetic
rearrangements are indicative of poor prognosis [32]. A common molecular marker
is the expression of mutant forms of FMS-like kinase 3 (FLT3). Constitutive
activation of the FLT3 tyrosine kinase occurs after point mutation (D835) or gene
translocation (FLT3-ITD); these mutations occur in approximately 20-30% of AML
9
FLT3 plays a critical role in governing hematopoiesis and cellular growth.
Expression of constitutively active FLT3 has transformative capacity in Ba/F3 B-cells
[35]. In addition, FLT3-ITD expression in lymphoid and myeloid progenitor cells in a
bone marrow transplant mouse model produced myeloproliferative disease [36].
Ligand-independent cell hyper-proliferation induced by FLT3-ITD is primarily
mediated through RAS/MAPK and STAT5 activation [37].
The standard of care for treatment of AML includes a combination of
anthracycline and cytarabine, sometimes with the addition of etoposide (Eposin),
cladribine (Leustatin), and fludarabine. Inhibitors of FLT3, such as PKC412
(midostaurin), are currently in clinical trials and have produced a favorable response
when given alone or in combination with the standard of care [38, 39]. Though with
only 20-40% of patients responding to initial therapy and nearly 50-70% of those
patients experiencing relapse within 3 years, novel therapies for the treatment of
AML are needed [40].
1.2. ENTs and drug resistance
1.2.1. ENT overview and functional aspects
Nucleosides are transported across cellular membranes by the equilibrative
and concentrative nucleoside transporters (ENT and CNT, respectively). ENTs
transport nucleoside substrates bidirectionally across membrane barriers down their
concentration gradient, whereas CNTs concentrate substrates in a
ENT-dependent transport; therefore, the remainder of this introduction highlights our
knowledge of ENT function.
In humans, the ENT family is composed of 4 members (ENT1-4), of which the
function of ENT1 and ENT2 is best understood [42]. ENT1 has nearly ubiquitous
tissue distribution and transports various purine and pyrimidine nucleosides, with the
exception of uracil, in a Km range of 50 µM (adenosine) to 680 µM (cytidine) [43].
ENT2 is 49% identical (69% similar) to ENT1 and is found in a variety of tissues,
though it is primarily expressed in skeletal muscle [44]. Immunohistochemical
studies have shown ENT2 expression on the plasma membrane [42]. In addition,
other studies suggest that ENT2 and/or ENT2 splice variants function as nuclear
transporters [45, 46]. ENT2 transports a broad range of purine and pyrimidine
nucleosides with the exception of cytidine and displays a lower affinity to these
substrates in comparison to ENT1. In contrast to ENT1, ENT2 can also transport
nucleobases, such as hypoxanthine [43, 47]. Of note, uridine is a permeant of both
ENT1 and ENT2 with a Km of 260 µM and 250 µM, respectively [43].
Selective inhibitors can be used to delineate ENT1- and ENT2-mediated
transport, as demonstrated by Ward et al. [43]. Nitrobenzylmercaptopurine riboside
(NBMPR) is a purine analog and a potent inhibitor of ENT1 activity; its IC50 to
inhibition of ENT1-mediated uridine transport is 0.4 +/- 0.1 nM, whereas inhibition of
ENT2-mediated transport occurs at an IC50 of 2.8 +/- 0.3 µM, a nearly 10,000-fold
difference in potency. Dipyridamole (Persantine) is a less selective inhibitor with a
difference in IC50 for ENT1 and ENT2 of approximately 100-fold (5.0 +/- 0.9 nM vs.
11
ENT1 contains 11 transmembrane (TM) α-helices with a cytosolic N-terminus
and an extracellular C-terminus [48]. Based on glycosylation scanning mutagenesis,
ENT1 is glycosylated on N48, which is located between TM1 and TM2; however,
glycosylation is not essential for activity [49]. Using chimeric recombinant proteins of
NBMPR-sensitive rat ENT1 and NBMPR-insensitive rat ENT2, it was determined
that the binding domains for NBMPR reside within amino acids 100-231
encompassing TM3-6 [50]. In addition, site-directed mutational analysis of ENT1 has
uncovered additional residues outside this region that are important for NBMPR
binding, including F334, N338, and L92 [51, 52].
Because NBMPR is a direct competitor of nucleoside transport, many regions
that are important for NBMPR binding are also contact points for nucleoside binding.
For example, site-directed mutagenesis of human ENT1 expressed in S. cerevisiae
demonstrated that G179 in TM5 was required for uridine transport and sensitivity to
NBMPR [53]. In addition, this study suggested that G184 may partially determine
targeting of the transporter to the plasma membrane [53]. G154 was also reported to
be important for nucleoside transport and sensitivity to the inhibitors NBMPR,
dipyridamole, and dilazep [54].
Similar to NBMPR binding, studies suggest that amino acids in TM domains
other than 3-6 may also be critical for the transport of nucleoside substrates.
Specifically, M33 in TM1 and I429 in the TM11 of human ENT1 and ENT2 and C.
elegans ENT1 were reported to be required for nucleoside transport and may
demonstrated that W29 within TM1 was important for inhibitor binding, and ENT1s
containing mutations of W29 have altered nucleoside transport kinetics [56].
1.2.2. Regulation of ENT1
ENT expression and activity are regulated at both the transcriptional and
post-translational levels. In addition, ENT1 transcription in cancer cells is
coordinated with the cell cycle, with an approximate doubling of ENT1 content
between the G1 and G2/M phases [57]. In response to lack of oxygen, ENT1 and
ENT2 mRNA expression is decreased in a hypoxia inducible factor 1
(HIF1)-dependent manner; this may provide a molecular mechanism to elevate extracellular
adenosine, subsequently dilating blood vessels [58]. In addition, functional analysis
of the mouse ENT1 promoter revealed regulation of gene expression by the MAZ
and Sp-1 transcription factors [59]. Furthermore, research in our lab has uncovered
a mechanism by which N-terminal c-Jun kinase (JNK) can regulate ENT expression
through the activation of signaling transducer and activator of transcription 3/5
(STAT3/5) proteins [60].
Of particular note, a recent study by Jin et al. demonstrated that ENT1 is
regulated at the transcriptional level by FLT3 [61]. Cell lines that express
constitutively activated FLT3-ITD down-regulated ENT1 expression and promoter
activity and were resistant to cytarabine treatment. This regulation was dependent
on HIF-1 and reversal of this phenotype was observed after treatment with the FLT3
inhibitor PKC412 [61].
Additionally, ENT activity may be regulated at the post-translational level.
13
of ENT1, but not ENT2, activity in various cell lines [62-64]. Though PKC-dependent
ENT1 phosphorylation has not been clearly demonstrated, PKC membrane
localization is required for ENT1 modulation and bioinformatics analysis reveals
potential consensus PKC phosphorylation sites within ENT1 [62, 65] (PROSITE
Database, http://www.expasy.ch/prosite/). Furthermore, Coe et al. demonstrated that
administration of PMA, an activator of PKC, increased the binding affinity between
ENT1 and NBMPR without altering the number of NBMPR binding sites, suggesting
a PKC-dependent protein modification that may induce a conformation change [63].
In addition to PKC, ENT1 may be positively regulated by casein kinase 2 (CK2) [66].
Treatment with the CK2 inhibitor 4,5,6,7-tetrabromobenzotriazole (TBB) or deletion
of the CK2 consensus phosphorylation site in mouse ENT1 (S254) reduced
nucleoside transport activity [66].
1.2.3. Resistance to nucleoside analog treatment
1.2.3.1. Introduction to nucleoside analogs
In addition to natural nucleosides, ENTs transport nucleoside and nucleobase
analogs, which are commonly used for the treatment of cancer, particularly
leukemia. Once inside the cell, these compounds exert their cytotoxic effects
primarily by incorporating into DNA during replication or DNA repair. For example,
cytarabine, and gemcitabine (Gemzar) accumulate in cells in their triphosphate
forms, Ara-CTP and dFdCTP, respectively, and compete with CTP for DNA
incorporation [67, 68]. In addition, analogs can disrupt specific metabolic pathways
antimetabolite, competes with dUMP for thymidylate synthase, resulting in depletion
of dTTP and inhibition of DNA replication [69]. Furthermore, the purine nucleoside
analog fludarabine directly inhibits ribonucleotide reductase, depleting dNTP pools
[70].
Numerous nucleoside analogs are FDA-approved for the treatment of
hematological malignancies. Cytarabine is given for induction and maintenance
therapy of AML, from which a CR rate of 60-80% can be achieved [40]. Gemcitabine
is an analog of cytarabine that is more commonly used against solid tumors, such as
pancreatic cancer and metastatic bladder cancer [71, 72]. However, in combination
with other agents, gemcitabine effectively treats lymphoid malignancies [73].
Fludarabine and the closely related purine nucleoside prodrug cladribine are used to
treat low-grade lymphomas and CLL [74, 75]. The standard of care for leukemia and
application of nucleoside analogs is reviewed in Section 1.1 Introduction to
Leukemia.
1.2.3.2. Nucleoside analog transport and resistance
Studies suggest that the transport of nucleoside analogs is necessary for, or
at least greatly increases, the cytotoxic effects of these agents. Mackey et al.
demonstrated that the IC50 value of gemcitabine-dependent inhibition of cell
proliferation was 100-3000-fold higher in cells that lack nucleoside transport in
comparison to cells that actively transport gemcitabine [76]. In a study of childhood
AML, Hubeek et al. found an inverse correlation between ENT1 mRNA expression
and sensitivity to cytarabine, such that low ENT1 levels were associated with
15
predictor of 5-FU resistance in pancreatic cancer and pre-treatment with NBMPR
increases drug sensitivity [78]. Numerous other clinical and pre-clinical studies have
determined a relationship between ENT1 abundance and chemosensitivity [79-87].
In addition, ENT dysfunction has been associated with resistance to
nucleoside analogs [88]. Genetic mutation may result in non-functional ENTs or
ENTs that have reduced activity. In a cytarabine-resistant cell line, Cai et al.
described two independent mutations in ENT1 that resulted in a non-functional
protein due to a shortened transcript and a transcript lacking exon 13, both of which
were associated with increased drug resistance [89]. In addition, profiling of an
ethnically diverse population uncovered ENT1 proteins with variations in the coding
region; however, kinetic analysis of these proteins in yeast found no difference in
transporter function [90]. Furthermore, single nucleotide polymorphisms (SNPs) in
ENT genes may determine individual responsiveness to nucleoside analog
treatment [91].
1.3. Kinase signaling in leukemia
1.3.1. Overview of kinase function
Reversible phosphorylation was first uncovered by Ed Krebs and Ed Fischer
during the mid-1950s [92]. Their discovery of cAMP-dependent protein kinase (PKA)
created a new field of research for the discovery and characterization of kinases.
These proteins catalyze the transfer of a negatively charged phosphate (PO4) group
from ATP to specific serine, threonine, and tyrosine residues on protein, oftentimes
resulting in an alteration in protein conformation and catalytic activity. Currently,
that phosphorylate tyrosine residues, whereas the large majority of kinases (385)
phosphorylate serine and threonine residues [93]. These events are integral to
molecular signaling and kinases are involved in every aspect of cellular regulation,
including cell growth, proliferation, and apoptosis.
Importantly, kinase dysregulation is a hallmark of many cancers. The
non-receptor tyrosine kinase Src was the first cancer oncogene to be characterized,
discovered by Bishop and Varmus and colleagues [94]. Since this discovery, many
other kinases have been demonstrated, primarily when mutated, to be oncogenes
[95]. Furthermore, 244 kinases have been mapped to disease loci or cancer
amplicons, providing further evidence for the importance of these enzymes in
disease [93].
1.3.2. BCR-Abl kinase
1.3.2.1. Overview and significance to CML
CML is a hematopoietic cancer characterized by the expression of the
constitutively active tyrosine kinase, BCR-Abl [96, 97]. BCR-Abl is the protein
product of the translocation of the c-Abl gene on chromosome 9 to a specific 5.8-kD
region on chromosome 22 termed the breakpoint cluster region (BCR). This
abnormality is a hallmark of CML and is present in approximately 95% of CML
patients [98]. Expression of BCR-Abl enhances molecular signaling that controls cell
division and proliferation, such as Ras [99] and PI3K/Akt [100, 101]. Compelling
evidence from mouse models has demonstrated the importance of BCR-Abl in CML.
Transduction of mouse bone marrow cells with BCR-Abl is sufficient to induce
17
inducible mouse system, Huettner et al. demonstrated that expression of BCR-Abl
developed lethal leukemia, whereas repression of BCR-Abl resulted in complete
remission [103]. Thus, BCR-Abl is required for both the induction and maintenance
of leukemia.
1.3.2.2. BCR-Abl kinase signaling
BCR-Abl kinase has enhanced activity in comparison to c-Abl [104]. Whereas
c-Abl is primarily located in the nucleus, BCR-Abl is distributed throughout the
cytoplasm, suggesting that it signals to different substrates [105]. Expression of
BCR-Abl has a transformative capacity in fibroblasts and hematopoietic cells in vitro
[106] and can induce CML in mice [107]. In addition, BCR-Abl expression activates
multiple molecular signaling cascades to enhance cell survival and proliferation,
including PI3K/Akt, Ras/MAPK, and JAK/STAT.
A major substrate for BCR-Abl is the adaptor protein CRKL. The
phosphorylation of CRKL correlates with BCR-Abl activity in CML patients and is
used to measure the status of leukemia development [108]. CRKL forms complexes
with BCR-Abl and important cell signaling molecules, including c-Cbl and STAT5
[109, 110]. Disruption of BCR-Abl-CRKL complex formation strongly reduces the
proliferation of primary CML cells and BCR-Abl-positive cell lines [111]. Furthermore,
over-expression of CRKL in BCR-Abl transgenic mice leads to more rapid leukemia
development [112].
An additional consistent regulator of BCR-Abl-dependent signaling is the
transcription factor STAT5. RNAi-mediated silencing of STAT5 inhibited cell
Expression of dominant-negative STAT5 reduced the induction and maintenance of
CML in mice [114]. STAT proteins are a substrate of BCR-Abl kinase; however,
studies disagree as to the importance of Janus kinases (JAKs) in the promotion of
STAT activity and BCR-Abl-dependent leukogenesis [115, 116].
1.3.2.3. Imatinib and mechanisms of imatinib resistance
Developed initially as a platelet-derived growth factor receptor (PDGFR)
inhibitor, imatinib (STI-571) is a selective and potent inhibitor of BCR-Abl and Abl
kinase as well as the c-Kit receptor kinase [98]. The therapeutic relevance of
imatinib was uncovered when it was observed that imatinib dramatically inhibited the
proliferation and tumor formation of BCR-Abl-positive cells [117]. Subsequent in vitro
and in vivo testing of this compound [117, 118] resulted in clinical trials to determine
imatinib efficacy against CML [119] and the eventual approval of imatinib for the
treatment of CML in 2001. Currently, imatinib is the front-line treatment for
BCR-Abl-positive CML and ALL.
Imatinib competes for ATP binding to Abl kinase [120]. Specific mutations in
the contact residues between imatinib and Abl and residues in the P loop and the
kinase activation loop confer resistance to imatinib by preventing drug-induced
inhibition [121]. Of note, the T315I mutant form of BCR-Abl is commonly found in
imatinib-resistant patients and can confer resistance by both the prevention of
inhibitor binding and by increasing kinase activity [122]. Other mechanisms of
imatinib resistance include the increased expression of BCR-Abl [123] and drug
19
An alternative BCR-Abl-independent mechanism of resistance is the
up-regulation of compensatory kinase signaling pathways. Burchert et al. demonstrated
that activation of the PI3K/Akt/mTor pathway could mediate resistance in cell lines
and primary CML cells. In addition, treatment with the mTor inhibitor rapamycin
reversed the resistant phenotype [125]. BCR-Abl promotes cell survival through the
activation of JAK and subsequent phosphorylation and activation of the STATs
[126]. Therefore, it is not surprising that up-regulation of JAK2 expression can confer
resistance to imatinib treatment [127].
Of specific importance to this dissertation is the mediation of imatinib
resistance by the up-regulation of the Src family kinase (SFK) Lyn. Previous studies
demonstrated that up-regulation and hyper-activation of Lyn kinase (Lyn) confers
imatinib resistance in imatinib-resistant CML cell lines [128-130] and primary cells
from patients that were non-responsive to imatinib [131]. The mechanism by which
Lyn confers drug resistance has not been fully elucidated; however, this may involve
the activation of GRB2-associated binder 2 (Gab2) and de-stabilization of c-Cbl
[132]. The Lyn-dependent increase in the expression of the Bcl-2 family of proteins
has also been attributed to a drug-resistant phenotype [128].
1.3.2.4. Second generation BCR-Abl kinase inhibitors
A minority of chronic phase CML patients is refractory to imatinib treatment or
display secondary resistance to imatinib after therapy. However, as much as 75% of
patients with advanced disease (accelerated phase, blast crisis) are refractory to
treatment or relapse after initial imatinib therapy [133]. Therefore, second-line
approved for treatment of imatinib non-responsive CML patients [134]. These
inhibitors have affinity to the BCR-Abl kinase in addition to SFKs. The hematopoietic
SFKs Hck and Lyn are important mediators of cell survival and are often
up-regulated after imatinib treatment [135]. Moreover, SFK molecular signaling overlaps
with that of BCR-Abl (i.e. STAT, CRKL). Thus, the efficacy of second line inhibitors is
believed to be due to inhibition of BCR-Abl compensatory signaling.
1.3.3. Lyn kinase in CML/AML
1.3.3.1. Overview of Lyn kinase function
Lyn is a SFK member and a non-receptor tyrosine kinase. Two splice
isoforms of this kinase exist, which differ by the excision of 21 amino acids in the
N-terminal SH4 domain (Lyn A – p56, Lyn B – p53; Yi et al., 1991). Currently, no
functional significance has been attributed to Lyn splice variation; however, the
N-terminal region is important for kinase localization [136] and this splice site is in
proximity to sites of lipid post-translational modification, implying splice
variant-specific localization [137]. In addition, regions within the Lyn kinase domain and
N-terminal SH4 domain are necessary for localization to Golgi membranes [138], and
inhibition of kinase activity increases Lyn nuclear localization [139].
Similar to Src kinase, Lyn activity is regulated in a phosphorylation-dependent
manner. Lyn activity is inhibited by phosphorylation of a conserved tyrosine in the
extreme C-terminal tail (Y508 – Lyn; Y527 – Src). Phosphorylation of this residue by
C-terminal Src kinase (CSK) induces an inactive conformation, during which the SH2
domain interacts with the phosphorylated tyrosine residue [140, 141]. Upon
21
– Src) within the kinase domain, inducing an activating conformational change.
Kinase activity is attributed to phosphorylation of this tyrosine residue. However, in
contrast to similar deletions in Src, loss of the SH2 and SH3 domains decreased Lyn
activity, implying individual differences in the autoregulation of Lyn in comparison to
Src [142].
Lyn is exclusively expressed in hematopoietic cells, particularly in cells of the
myeloid lineage and B-cell lymphocytes [143, 144]. Lyn functions as a catalytic
transducer of the B-cell receptor complex (BCR) and erythropoietin receptor (EpoR)
to promote B-cell development [145] and erythrocyte differentiation [146, 147],
respectively. In addition, stimulation of c-Kit, a cell surface receptor similar to
PDGFR, leads to activation of Lyn, a result necessary for granulocyte colony
stimulating factor (G-CSF)-induced cell proliferation in hematopoietic cells [148,
149]. Thus, Lyn plays an active role in the promotion of hematopoietic cell survival.
1.3.3.2. Lyn and drug resistance
In myeloid cells, Lyn can both positively and negatively affect cell signaling.
Studies using Lyn-/- mice suggest that Lyn is an inhibitor of normal myeloid cell
development; these mice have enhanced myeloproliferation and a large number of
cells with a blast-like phenotype [150]. However, the contribution of secondary
inflammatory responses to the hyper-proliferation of these cells cannot be
discounted.
In contrast, numerous studies have suggested that myeloid leukemias
depend on Lyn activity. AML cell lines and primary progenitor cells display a high
mutated in AML, to mediate constitutive activation of STAT5 [152]. Treatment with
PP2, a SFK inhibitor, prevented tumor formation and tumor growth in mice
transplanted with AML cells expressing constitutively active FLT3 [152]. Moreover,
Lyn is involved in many aspects of CML cell survival [131, 153].
Lyn over-expression and hyper-activation has been implicated in drug
resistance in CML. Over-expression of Lyn in hematopoietic cells contributes to cell
proliferation and drug resistance through increased STAT5 phosphorylation, Bcl-2
expression, and other pro-survival responses [128, 129, 154]. Inhibition or
knockdown of Lyn reduced pro-survival signaling and increased imatinib sensitivity
in CML cells [130, 154]. Of note, therapeutic targeting of Lyn using dual SFK and
BCR-Abl inhibitors, such as dasatinib, leads to remission in patients that are
non-responsive to imatinib [155]. Currently, dasatinib and other dual BCR-Abl/SFK
inhibitors are FDA-approved for the treatment of imatinib-resistant CML.
1.4. MicroRNAs and leukemia
1.4.1. MicroRNA biogenesis
MicroRNAs (miRNAs) are small (19-24 nt) non-coding RNA molecules that
are key regulators of protein expression through their targeted binding to specific
mRNAs. Since the first description of this RNA class in C. elegans [156],
identification of numerous miRNAs has been made in both plant and animal phyla.
There are estimated to be as many as 1000 miRNAs encoded by the human
genome and approximately half of these have been cloned and confirmed.
The majority of miRNAs are transcribed by RNA polymerase II as a
23
primarily located within introns of either protein-coding or non-protein-coding
transcripts; however, some are found within the exons of non-protein-coding
transcripts, the 3’ UTR of mRNA, or isolated regions of the genome. In the nucleus,
the RNAase III-like enzyme Drosha processes the pri-miRNA into one or more
pre-miRNAs (~70 bp). These pre-miRNA molecules take on a stem-loop-stem structure
and are exported out of the nucleus by a mechanism involving exportin-5. The
pre-miRNAs are subsequently processed by Dicer RNAse III. The resulting mature
miRNA product (~22 nt) forms a RNA duplex with target mRNAs in the RNA-induced
silencing complex (RISC), triggering the degradation of the mRNA transcript, which
requires complete complementarity between the miRNA and mRNA sequence, or
the direct inhibition of protein translation [157]. It has been suggested that a single
miRNA targets multiple mRNA transcripts and that a given mRNA has binding sites
for multiple miRNAs. Thus, miRNAs may regulate protein expression in a complex
25 1.4.2. MicroRNA regulation
MiRNAs may be transcribed singly or in clusters from both intragenic (within
the exon or intron of a transcribed RNA) and intergenic (between transcribed RNAs)
regions of the genome. Transcriptional regulation can be imposed by epigenetic
(methylation, acetylation, etc.) factors. For example, Agirre et al. recently
demonstrated that hyper-methylation of the promoter region of miR124a increased
the expression of CDK6 and contributed to enhanced cell proliferation in ALL [158].
Transcription factors, such as CEBPα, are also important regulators of
miRNA expression. CEBPα is a basic region leucine zipper transcription factor that
is essential for myeloid cell differentiation and growth control and is commonly
inactivated in AML by mutation or post-transcriptional modification [159-161].
CEBPα directly regulates the expression of several miRNAs, such as miR661 [162]
and miR223 [163]. Furthermore, distinct miRNA signatures in AML have been
attributed to the status of CEBPα activity; in particular, the up-regulation of miR181
family is associated with CEBPα mutation [164]. These studies of transcription factor
and miRNA expression have become increasingly important for the diagnosis of
leukemias.
On the post-transcriptional level, miRNAs are regulated by proteins that affect
miRNA processing. Seminal work by the laboratories of Richard Gregory and Scott
Hammond has elucidated the role of the RNA-binding protein Lin28 in the regulation
of the let-7 miRNA family. Lin28 specifically interacts with the precursor let-7
molecule to inhibit further processing by Dicer into the mature miRNA species [165,
Lin28 expression and loss of let-7 is a marker of cellular differentiation. Furthermore,
Lin28 is a Src kinase-regulated protein [167, 168] and aberrant expression of Lin28
has been attributed to cancer progression and Hmga2 and Ras oncogene
expression.
1.4.3. MicroRNAs and leukemia
The consequences of dysregulated miRNA expression can be severe,
resulting in developmental defects or cancer. MiRNAs may act as oncogenes to
promote cancer progression. For instance, the miR17-92 locus encodes a cluster of
7 microRNAs that can enhance c-Myc activity and accelerate tumor development
[158]. Elevated expression of this cluster is associated with an aggressive cancer
phenotype in heptacellular carcinoma [169] and lung cancer [170].
In addition, the loss of tumor suppressor miRNAs can enhance cell
proliferation and cancer progression. For example, miR29a suppresses the
expression of pro-survival genes including Myeloid Cell Leukemia-1 (Mcl-1) and
inhibition of this miRNA using antisense antagomirs sensitizes cells to drug-induced
cell death [171]. In addition, expression of miR29b in AML cell lines and primary
AML cells reduces cell growth and promotes apoptosis [172]. The regulation of Mcl-1
expression by miRNAs is an important determinant of drug sensitivity and cell
survival. Other tumor suppressor miRNAs that target Mcl-1 include miR320 and
miR133b [173, 174].
Another putative tumor suppressor miRNA that has been implicated in AML is
miR181. This miRNA family (miR181a-d) is preferentially expressed in
27
Studies of AML patients have determined that the loss of miR181 is an indicator of
poor disease prognosis and is associated with a reduced survival rate compared to
patients with high miR181 expression [164, 176, 177]. This microRNA family is
suggested to target Bcl-2 [178, 179], and over-expression of miR181a sensitizes
glioma cells to ionizing radiation [178].
1.5. Bcl-2 family proteins
1.5.1. Overview of the Bcl-2 family
The B cell CLL/lymphoma-2 (Bcl-2) family of proteins is composed of both
pro-survival and pro-death members that dictate the integrity of the outer
mitochondrial membrane (OMM) (Fig. 1.3). The anti-apoptotic Bcl-2 proteins contain
four Bcl-2 homology (BH1-4) domains and the major members are Bcl-2, Mcl-1, A1,
Bcl-x, and Bcl-w. These proteins directly bind to Bcl-2 antagonist killer 1 (Bak) and
2 associated x protein (Bax). Bax/Bak comprise one branch of pro-apoptotic
Bcl-2 proteins and, upon homo-oligomerization, form pores within the OMM to promote
permeabilization. After permeabilization, soluble proteins, such as cytochrome c,
diffuse into the cytosol and activate apoptotic protease activating factor-1 (APAF-1)
and subsequent caspase activation. Thus, blockade of Bax/Bak oligomerization
prevents cellular apoptosis.
The second branch of pro-apoptotic Bcl-2 proteins are termed “BH3-only”
proteins and consist of Bcl-2 antagonist of cell death (Bad), Noxa, Bcl-2-interacting
domain death agonist (Bid), and Bcl-2-interacting mediator of cell death (Bim). As
the name suggests, these proteins do not contain any of the domains found in other
and inhibit anti-apoptotic Bcl-2 family members, thereby promoting apoptosis. In
addition, Bid and Bim can directly affect Bax and Bak oligomerization to induce cell
death [180].
Dysregulation of Bcl-2 protein expression can influence cell survival and is
often a barrier to cancer therapy. Bcl-2-/- mice are embryotically viable yet undergo
massive apoptosis in the thymus and spleen subsequent to birth [181]. Upon
over-expression, Bcl-2 suppresses apoptosis induced by a variety of agents both in vitro
and in vivo [182, 183]. Furthermore, over-expression of pro-survival Bcl-2 proteins in
29
1.5.2. Unique aspects of Mcl-1
Mcl-1 is a pro-survival Bcl-2 protein that is necessary for embryonic
development as well as the survival of hematopoietic stem cells [186, 187]. In
contrast to other pro-survival Bcl-2 family members, Mcl-1 does not contain a BH4
domain in its N-terminus [188]. Rather, Mcl-1 contains two PEST sequences that
have been shown to be important for mitochondrial localization [189]. In addition, this
region contains JNK phosphorylation sites (S121, T163) that, upon oxidative
stress-induced phosphorylation, inhibit the anti-apoptotic function of Mcl-1 [190].
Phosphorylation of T163 is dynamic in that ERK-dependent phosphorylation in
response to differentiation factor stimulation slows Mcl-1 protein turnover [191].
Mcl-1 is also regulated at the post-transcriptional level by microRNAs (see
Section 1.4.3. MicroRNAs and leukemia) and alternative splicing. Splicing of exon 2
produces Mcl-1s, which lacks the BH1, BH2, and BH4 domains. This variant is
unable to sequester Bax and Bak, and binds to and inhibits full-length Mcl-1. Thus,
splicing of Mcl-1 generates a pro-apoptotic protein [192]. This natural variation may
be exploited by the use of splice-switching oligonucleotides, similar to that
demonstrated with Bcl-x [193].
Mcl-1 is a high-turnover protein with a constitutive half-life of approximately 40
minutes [194]. Mcl-1 is ubiquitinated and directed for degradation by the
MULE/LASU1 E3 ligase [195]. Interestingly, this ligase contains a BH3 domain that
is similar to the Bak BH3 domain, which allows for specific targeting of Mcl-1 [196].
As stated above, phosphorylation can affect the E3 ligase-dependent degradation of
31
1.5.3. Bcl-2 family proteins and drug resistance
Pro-survival Bcl-2 family members are important regulators of mitochondrial
membrane integrity and cytochrome c release and are often modulated by
oncogenic proteins, such as BCR-Abl and FLT3-ITD [197, 198]. These proteins have
been implicated in the promotion of drug resistance to a variety of chemotherapeutic
drugs, including alkylating agents [199], topoisomerase inhibitors [200],
antimetabolite drugs [201, 202], anticancer monoclonal antibody therapy [203], and
signal transduction inhibitors [204], as well as ionizing radiation [205]. Of note,
up-regulation of Bcl-2 and Mcl-1 expression has been observed in cell models of
imatinib-resistant CML [128, 206], and compounds that effectively inhibit
imatinb-resistant CML cell survival down-regulate Mcl-1 expression [207-209]. Furthermore,
co-treatment of cells with siRNA against Bcl-2 members sensitizes cells to drug
treatment [210-212].
These observations provide rationale for the development of Bcl-2 inhibitors
for the treatment of cancer, such as ABT-737, which has received significant
attention due to its dramatic effects on cancer cell apoptosis. This small molecule is
a BH-3 mimetic and targets the hydrophobic groove in pro-survival Bcl-2 proteins
produced by BH domains 1-4 [213]. ABT-737 treatment induces cell death and
sensitizes cells to drug treatment [213, 214]. However, due to the lack of BH4
domain, Mcl-1 is not targeted by ABT-737; expression of Mcl-1 confers resistance to
drug treatment [215], and down-regulation of Mcl-1 increases drug-induced cytotoxic
effects [216]. Thus, novel Mcl-1 targeted therapies would be beneficial as an
1.6. Dissertation Summary
As stated above, drug resistance to anti-cancer chemotherapy is a significant
barrier to the treatment of leukemia patients. Prolonged exposure to drug may
induce alterations in drug transport proteins or adaptations in molecular signaling
through alteration of kinase activity or miRNA expression. The overall goal of my
dissertation was to identify the molecular mechanisms of drug resistance in order to
provide substrates for the second-line chemotherapy as well as biomarkers for the
identification of drug-resistant cancer.
The remainder of this dissertation is divided into 5 chapters. In chapter III,
“Identification of a Novel Point Mutation in ENT1 that Confers Resistance to Ara-C in
Human T-cell Leukemia CCRF-CEM Cells”, I describe that loss of ENT1 function
due to a point mutation at G24 may explain Ara-C resistance in a cell model of ALL.
Chapter IV, “Lyn Kinase-dependent Regulation of miR181 and Mcl-1 Expression:
Implications for Drug Resistance in Myelogenous Leukemia”, focuses on a cell
model of imatinib-resistant CML. In this chapter, I elucidate a novel signaling axis by
which Lyn hyper-activation increases Mcl-1 expression through the repression of
miR181 miRNAs. In the next chapter, “Elucidating the Mechanism(s) of miR181
Transcriptional Regulation”, I extend these findings in an attempt to determine the
mechanism by which Lyn regulates miR181 expression. Finally, in Chapter VI,
“Conclusions and Future Directions”, I discuss the broad impact of these findings
and propose future experiments for the study of Lyn and miR181 in myelogenous
CHAPTER II
2.1. Chapter 3 materials and methods
2.1.1. Cell culture and reagents
The nucleoside transport-deficient swine epithelial cell line PK15-NTD (PK15)
was generously provided by Dr. Chung-Ming Tse (School of Medicine, Johns
Hopkins University) and was maintained as described previously [43]. The
CCRF-CEM cell line was obtained from the ATCC (Rockville, MD.) and the CCRF-CCRF-CEM
Ara-C/8C cell line, an Ara-C resistant cell line derived from the CCRF-CEM cell line,
was kindly provided by Dr. Buddy Ullman (Dept. of Biochemistry and Molecular
Biology, Oregon Health Sciences University). CCRF-CEM and Ara-C/8C cells were
maintained as described previously [217]. NBMPR (6-[(4-nitrobenzyl)
thio]-9-(β-d-ribofuranosyl) purine) was purchased from Sigma-Aldrich (St. Louis, MO). [3
H]-NBMPR (specific activity: 22.0 Ci/mmol), [5, 6-3H]-Uridine (specific activity:
35-50 Ci/mmol), and [5-3H]-Ara-C (cytosine-β-d-arabinofuranoside, specific activity:
15-30 Ci/mmol) were obtained from Moravek Biochemicals (Brea, CA).
2.1.2. Total RNA extraction and cDNA synthesis
Total RNA was extracted from CCRF-CEM and Ara-C/8C cells using Trizol
reagent (Invitrogen; Carlsbad, CA) following the manufacturer’s instruction. Two
micrograms of total RNA were used for first-strand cDNA synthesis using oligo (dT)
as primers (Invitrogen) and SuperScript II RNase H– Reverse Transcriptase
(SuperScriptTM First-Strand Synthesis System for RT-PCR; Invitrogen); the
35
2.1.3. Non-quantitative RT-PCR and DNA sequencing
One-tenth of the resulting first-strand cDNA was then used for PCR
amplification with High Fidelity pfu DNA polymerase (Invitrogen) following the
manufacturer’s instructions. The primers for amplifying the entire coding sequence of
hENT1 were 5′-CCGCTCGAGATGACAACCAGTCACCTCAG-3′ (sense primer) and
5′-AGACTCGAGTCACACAATTGCCCGGAACAGG-3′ (antisense primer). Products
were visualized on an ethidium bromide-stained agarose gel. PCR products were
cloned into the TOPO blunt cloning vector (Invitrogen) and expressed in DH5α E.
Coli (Invitrogen). Plasmids were submitted for automatic sequencing (UNC-CH Genome Analysis Facility, http://152.19.68.152/gafsite/Main.asp).
2.1.4. Construction of expression vectors and cell transfection
Human ENT1 cDNA was subcloned into the pcDNA 3.1 HisC expression
vector (Invitrogen). Construction of the G24 ENT1 mutant expression vectors was
performed using the Quickchange Site-directed Mutagenesis kit (Stratagene; Cedar
Creek, TX) with primers specific to ENT1; the G24R sense primer
CTTCATGCTGGGTCTGAGAACGCTGCTCCCGTGG-3′) and antisense primer
CCACGGGAGCAGCGTTCTCAGACCCAGCATGAAG-3′), G24A sense primer
CTTCATGCTGGGTCTGGCAACGCTGCTCCCGTGG-3′) and antisense primer
(5′-CCACGGGAGCAGCGTTGCCAGACCCAGCATGAAG-3′), and G24E sense primer
(5′-CTTCATGCTGGGTCTGGAAACGCTGCTCCCGTGG-3′) and antisense primer
(5′-CCACGGGAGCAGCGTTTCCAGACCCAGCATGAAG-3′) each confer a
missense mutation at base pair 72. Wild-type (wt) and G24R ENT1 constructs were
confocal microscopy. Expression vectors were introduced into PK15 or HeLa cells
by Lipofectamine transfection (Invitrogen) according to the manufacturer’s
instructions.
2.1.5. [3H]-Uridine and [3H]-Ara-C uptake assays
The uptake of [3H]-uridine was measured in CEM cell lines or transfected
PK15 cells exactly as described previously [218]. The same method was used to
measure [3H]-Ara-C uptake with the substitution of cold cytidine for uridine used to
stop the reaction. The protein concentration of each sample was quantified using
Bradford reagent (Pierce; Rockford, IL).
2.1.6. Confocal microscopy
pEGFP-C3 constructs were transfected into HeLa cells using Lipofectamine
reagent (Invitrogen) according to the manufacturer’s instructions. This cell type was
used to obtain high transfection efficiency and ease for microscopy. Twenty-four hr
after transfection, images were captured using a 63X oil immersion objective on a
Zeiss LSM 510 Meta confocal microscope (Thornwood, NY). Image capture was
resolved using a 488 nm argon laser.
2.1.7. Isolation of membranes and [3H]-NBMPR binding assay
Crude cell membranes from CCRF-CEM cells were prepared as described
previously with minor modification [219]. Briefly, approximately 5x10⁷ cells were
washed 3 times with room temperature (r.t.) phosphate-buffered saline (PBS),
suspended in 500 µl of ice-cold 5 mM Na2HPO4 buffer (pH 8.0), and sonicated to

![Figure 3.5.1. Comparison of [ 3 H]-uridine uptake, [ 3 H]-NBMPR binding, and ENT1 mRNA expression between CCRF-CEM cells and Ara-C/8C cells](https://thumb-us.123doks.com/thumbv2/123dok_us/8329313.2209113/73.918.140.851.216.762/figure-comparison-uridine-uptake-nbmpr-binding-expression-cells.webp)
![Figure 3.5.3. The G24R ENT1 mutant lacks [ 3 H]-NBMPR binding even though plasma membrane expression is maintained](https://thumb-us.123doks.com/thumbv2/123dok_us/8329313.2209113/75.918.175.813.141.474/figure-mutant-nbmpr-binding-plasma-membrane-expression-maintained.webp)

![Figure 3.7.3. MYL and MYL-R cells have similar transport activity. A) 3.0x10 5 cells were treated with DMSO, 1.25 µM NBMPR, or 2.0 µM dipyridamole for 15 min and then were incubated with [ 3 H]-uridine for 10 min in the presence of inhibitor](https://thumb-us.123doks.com/thumbv2/123dok_us/8329313.2209113/81.918.64.862.182.463/transport-activity-treated-dipyridamole-incubated-uridine-presence-inhibitor.webp)