This study is the first analysis of the association between school suspension and criminal
conviction in the adult justice system that uses fully matched administrative datasets. Using a
longitudinal dataset that matches student records within the North Carolina Department of Public
Instruction and the North Carolina Department of Public Safety, this study looks at suspension
trends in North Carolina and the association between receiving a suspension in ninth grade with
being convicted of a felony or misdemeanor up to five years after ninth grade. Results of logistic
regression models show that Black, Native American, and multiracial male students are
disproportionately disciplined in North Carolina. Consistent with prior research, this study also
found that economic status, English proficiency, academic performance, and school affluence
also strongly affect a student’s likelihood of being suspended, although disability status does not.
Analyses that looked at predictors of conviction concluded that experiencing in-school
suspension increases the likelihood that the average student will be convicted of a misdemeanor
or a felony by a factor of 1.8, and experiencing out-of-school suspension increases the likelihood
that the average student will be convicted of a misdemeanor or a felony by a factor of 3.1 and
3.6, respectively. Moderation analyses failed to find that student factors further increase or
decrease this association. The results of this study call into question the effectiveness and value
of school suspension, particularly out-of-school suspension. This study shows that the Early
College High School Model effectively reduces the use of suspension in school, although further
policy alternatives must be explored to reduce the association between being disciplined in
I would like to thank Dr. Douglas Lauen for introducing and immersing me into the field
of education policy. Since my first year of college, Dr. Lauen has given me opportunities to dive
deeper into the nuances of issues in public education, including by encouraging me to investigate
the tough questions asked in this study. Without his guidance, I would not have developed such a
deep interest and passion in this field.
I would also like to thank my parents for constantly supporting me in all of my
educational endeavors. Without their sacrifices, I would have never been able to study at such an
amazing university. This thesis feels like the culmination of all of the opportunities they have
given me that have crafted me into the student I am today. I could not ask for a better support
TABLE OF CONTENTS
TABLE OF CONTENTS ... 1
CHAPTER 1: INTRODUCTION ... 4
HISTORY OF SCHOOL DISCIPLINE ... 8
THEORETICAL FRAMEWORK ... 11
Why Do Gaps in School Discipline Exist? ... 11
Why Would School Discipline Lead to Later Incarceration? ... 14
DISPARITIES IN DISCIPLINE ... 16
Racial, Ethnic, and Gender Disparities ... 16
Socioeconomic and School-Level Disparities ... 18
Ability and Achievement Disparities ... 19
ADVERSE OUTCOMES OF DISCIPLINE ... 19
Academic Failure and Dropout ... 19
Juvenile Arrest ... 21
School-to-Prison Pipeline? ... 22
CHAPTER 3: METHODS ... 24
DATA ... 24
VARIABLES ... 25
Outcome Variables ... 25
Treatment Variables ... 26
Control Variables and Moderators ... 27
SAMPLE ... 28
ANALYSIS ... 30
CHAPTER 4: RESULTS ... 33
A. FACTORS AFFECTING LIKELIHOOD OF IN-SCHOOL AND OUT-OF-SCHOOL SUSPENSION ... 33
B. ASSOCIATION BETWEEN SUSPENSION AND LIKELIHOOD OF CRIMINAL CONVICTION ... 40
C. DIFFERENTIAL EFFECTS OF SUSPENSION ON CRIMINAL CONVICTION ... 44
CHAPTER 5: CONCLUSIONS ... 51
DISCUSSION ... 51
LIMITATIONS ... 54
IMPLICATIONS FOR POLICY AND FUTURE RESEARCH ... 56
APPENDIX ... 60
TABLE OF TABLES
Table 1: Descriptive Statistics for Sample.………... 29
Table A1: Adjusted Logit Coefficient Estimates from Models Predicting Suspension…..……. 60 Table A2: Predicted Mean Estimates from Models Predicting the Effect of Race and Sex on Criminal Conviction…..……… 62
Table A3: Adjusted Logit Coefficient Estimates from Models Predicting In-School
Suspension’s Effect on Criminal Conviction…..……….. 66
Table A4: Adjusted Logit Coefficient Estimates from Models Predicting Out-of-School
Suspension’s Effect on Criminal Conviction…..……….. 68
Table A5: Adjusted Logit Coefficient Estimates from Models Predicting Number of
Suspension’s Effect on Criminal Conviction…..………... 70
Table A6: Adjusted Logit Coefficient Estimates from Models Investigating Moderators to Suspension’s Effect on Criminal Conviction …..………...…... 71
Table A7: Predicted Mean Estimates from Models Predicting Out-of-School Suspension’s Effect on Criminal Conviction…..……….... 75
Table A8: Predicted Mean Estimates from Models Predicting In-Suspension’s Effect on
TABLE OF FIGURES
Figure 1: National Juvenile Arrest Rate Trends Since 1980………... 10
Figure 2: 2016 Distribution of Criminal Convictions in North Carolina, by Age………... 25
Figure 3: Predicted Means for In-School and Out-of-School Suspension, by Race …………... 34
Figure 4: “ “, by Sex……… 35
Figure 5: “ “, by Economic Status………... 36
Figure 6: “ “, by Disability Status……… 37
Figure 7: “ “, by Academic Performance………. 38
Figure 8: “ “, by School Type……….. 39
Figure 9: “ “, by School Affluence……….. 40
Figure 10: Predicted Means for Felony and Misdemeanor Conviction, by Suspension Record………... 41
Figure 11: Predicted Means for Felony and Misdemeanor Conviction, by Number of Suspensions………... 42
Figure 12: Factor Increase in the Likelihood of Conviction, by Type of Conviction, Type of Suspension, and Number of Suspensions………. 43
Figure 13: In-School Suspension: Factor Increase in the Likelihood for Criminal Conv. between Suspended and Not Suspended Students, by Academic Performance…………. 45
Figure 14: Out-of-School Suspensions: Factor Increase in the Likelihood for Criminal Conv. between Suspended and Not Suspended Students, by Academic Performance………..………. 45
Figure 15: Factor Increase in the Likelihood for Criminal Conviction between Suspended and Not Suspended Students, by Economic Status and Type of Suspension………….…….…. 46
Figure 16: Factor Increase in the Likelihood for Criminal Conviction between Suspended and Not Suspended Students, by Sex and Type of Suspension……….……….….…. 47
Figure 17: In-School Suspension: Factor Increase in the Likelihood for Criminal Conviction between Suspended and Not Suspended Students, by Race, Sex, and Conviction Type…....…. 48
Figure 18: Out-of-School Suspension: Factor Increase in the Likelihood for Criminal Conviction between Suspended and Not Suspended Students, by Race, Sex, and Conviction Type…...…. 49
Figure A1: Predicted Means of Suspension for Male Students, by Race and Economic Status……..……….. 64
Figure A2: Predicted Means of Suspension for Female Students, by Race and Economic Status……… 64
Figure A3: Predicted Means for In-School and Out-of-School Suspension, by Academic Performance and Race……….. 65
Figure A4: Predicted Means for In-School and Out-of-School Suspension, by Race and School Type. ..……… ………. 65
Figure A5: Predicted Means for Misdemeanor Conviction, by Race and Number of Susp…… 72
Figure A6: Predicted Means for Felony Conviction, by Race and Number of Susp…………... 72
Figure A7: Factor Increase in the Likelihood of Criminal Conviction between Suspended and Not Suspended Students, by Disability Status………... 73
Figure A8: “ “, by English Proficiency……… 73
Figure A9: “ “, by School Type………... 74
Chapter 1: Introduction
Although the national incarceration rate is the lowest it has been since 1996, the United
States still has the highest incarceration rate in the world with one out of every 38 adults in some
form of correctional supervision (Kaeble & Cowhig, 2018). Mass incarceration is a public
problem for two reasons. First, the high rate of inmates places a burden on taxpayers, who are
seeing diminishing returns to incarceration. In the 1970s, rises in incarceration helped reduce
crime rates, but in the late 1990s and early 2000s crime rates stagnated as the incarceration rate
continued to steadily climb (Gottschalk, 2016). The second reason is that there are racial
disparities and inequities in incarceration. Disproportionate amounts of inmates are low-income
and racial minorities. Black people represent 12% of the U.S. population yet 33% of the
sentenced prison population (U.S. Census, 2016).
In national conversation, a large hypothesized contributor to this public problem is the
“school-to-prison pipeline,” which is a metaphor to describe the observational trend of children
being funneled out of public schools and into the criminal justice system. The primary
mechanism that drives the school-to-prison pipeline is exclusionary school discipline, which
removes students from the classroom through suspension or expulsion and, at times, refers them
to the criminal justice system. Since the rise of the “zero tolerance” movement of the 1990s, the
use of school discipline has increased dramatically (U.S. Department of Education, 2014; Pesta,
2018). In the 2011-2012 school year, almost 7 million students, or about 14% of the school-aged
population, were given an in-school or out-of-school suspension in the U.S. (U.S. Department of
Education, 2016; Morgan et al., 2019). Parallel to incarceration trends, Black males face high
population, yet 25 percent of those who have been suspended out-of-school and 23 percent of
those who have been expelled (DOE Office for Civil Rights, 2018).
Research has shown that exclusionary school discipline has adverse short- and long-term
effects on students. Excluding students from the classroom heightens a student’s risk of poor
school performance, truancy, high school dropout, and juvenile arrest; all of which are associated
with later incarceration (Jaggers et al., 2016; Fabelo et al, 2011; Monahan et al., 2014; Cuellar &
Markowitz, 2015; Mittleman, 2018; Sweeten, 2016; Bernburg & Krohn, 2003). The likelihood of
these outcomes for students increases exponentially with each additional disciplinary infraction
(Fabelo et al., 2011). High rates of exclusionary school discipline also negatively affects
non-suspended students. A growing body of research shows that a school’s suspension rate is
strongly associated with its overall level of academic achievement, even after controlling for
poverty, race, and school characteristics (Black, 2016).
Less known in research is how exclusionary school discipline affects a child’s likelihood
to become incarcerated in the adult criminal justice system. Initial studies on the topic have
concluded there is a strong association. However, more research needs to be done, specifically
because most of these initial studies have looked at the effect using national datasets that rely on
self-reported data. No study has explored the relationship between exclusionary school discipline
and adult incarceration using fully matched state administrative datasets.
This study will look at the relationship between school discipline records and adult
criminal conviction in North Carolina. Using matched datasets from the North Carolina
Department of Instruction and Department of Public Safety, this study will analyze whether
experiencing school suspension is associated with a greater risk of adult criminal conviction.
1) How does a student’s individual and school characteristics (race, sex, economic status,
ability status, English proficiency, academic performance, and school affluence) affect
their likelihood to be subject to school suspension in North Carolina?
2) What is the association between school suspension and adult criminal conviction in North
Carolina?
3) How does a student’s race, sex, economic status, ability status, English proficiency,
academic performance, and school affluence strengthen or weaken the association
between school suspension and adult criminal conviction?
These questions will be particularly interesting to investigate in North Carolina.
According to a report from the ACLU and UCLA Civil Rights Project, North Carolina has the
highest average amount of school days lost due to suspensions in the country. For every 100
students in North Carolina, 42 school days are lost to suspension (ACLU, 2018). For students
with disabilities, 82 days are lost (ACLU, 2018). Additionally, relative to other states, North
Carolina has historically been especially punitive when it comes to youth criminal convictions.
In August 2017, North Carolina became the final state to pass legislation to “Raise the Age” for
juvenile jurisdiction (Boughton, 2019). Effective Dec. 1, 2019, youth under the age of 18 will not
be charged in the adult criminal system for nonviolent offenses (Juvenile Justice Reinvestment
Act of 2017). Since the establishment of a juvenile justice system in 1919, teenagers aged 16 and
17 were automatically tried as adults for all crimes, including misdemeanors and low-level
felonies (Birckhead, 2007). Although the law is now changing, the historically younger age may
make the association between school discipline and conviction in the adult criminal system
stronger in North Carolina because, theoretically, schools could refer misbehaving students to an
In addition to these three primary research questions, I will also be conducting a
sub-analysis using a sample of early college high school students in North Carolina. The Early
College High School (ECHS or early college) model is an education intervention that provides
students with the opportunity to take up to two years of college credit during high school. Early
colleges are usually located on a college campus, which can also give disadvantaged students
exposure to college life. Early colleges have gathered significant public attention due to research
that shows positive academic effects of attending an early college, including higher rates of high
school graduation, college enrollment, and postsecondary completion (Haxton et al., 2016;
Edmunds et al., 2017; Lauen, Barret, Fuller, & Janda, 2017). Less is known about the social
effects of the early college intervention, although researchers are beginning to investigate this.
By including early college high school attendance as a potential moderator, this study will be
able to evaluate if and how early colleges effectively mitigate the pathways to prison. Therefore,
my fourth research question is:
4) Is the early college intervention particularly effective in diverting youth from adult
criminal conviction?
This thesis will proceed with Chapter 2, which is a review of the literature on the
school-to-prison pipeline and exclusionary school discipline. Additionally, Chapter 2 will discuss
theoretical explanations for why exclusionary school discipline is employed disproportionately
and why it might lead a student on a pathway towards adult criminal conviction. In Chapter 3, I
will describe my data source and outline how this study was conducted. Chapter 4 will introduce
my results, and Chapter 5 will further interpret these findings and conclude with policy
Chapter 2: Literature Review
History of School Discipline
Many scholars have argued that the criminalization of students took root in the “war on
crime” era, which was initiated by both Democratic and Republican politicians in the 1960s and
1970s (Feely & Simon, 1992; Rocque & Snellings, 2018). During this time, criminal justice
policies shifted from a focus on rehabilitation to risk management, and a variety of new
techniques were adopted to identify, classify, and manage people based on their level of risk
(Feely & Simon, 1992; Rocque & Snellings, 2018). “The new penology,” as Feeley & Simon
(1992) named it, extended into children’s lives through widespread juvenile justice systems
reforms that attempted to “control” delinquent youth. Through a series of reforms, state
legislatures broadened definitions of youth-related crimes, increased access to juvenile records,
and expanded opportunities for youth to be tried as adults throughout this period (Heitzeg, 2009;
Fabelo et al, 2011). At this time, North Carolina had already been automatically charging 16- and
17-year-olds as adults as mandated by the Juvenile Court Statute of 1919. However, in 1994, the
state extended adult convictions of children by lowering the minimum age for transfer to adult
court from 14 to 13, which gave judges the discretion to determine whether a 13-year-old should
be tried in an adult or juvenile court (Birckhead, 2007).
A risk management strategy formally entered the U.S. public school system in 1994
through the passage of the Gun-Free Schools Act (Feeley & Simon, 1992). Prior to the passage
of this bill, anxiety about out-of-control youth began to rise as the country was experiencing a
sudden spike in school shootings (Burns & Crawford, 1999; Rocque & Snellings, 2018). The
1994 Gun-Free Schools Act required states receiving Title I funding to implement “zero
(Curtis, 2014). Throughout the implementation, several high-profile school shootings, namely
West Paducah (1997), Jonesboro (1998) and Columbine (1999), increased the attention and
support for “zero tolerance” (Rocque & Snellings, 2018). Over time, schools nationwide adopted
zero tolerance policies and broadened the list of infractions that could result in automatic
disciplinary action. By 1997, 94% of public schools had zero tolerance policies for firearms,
91% had zero tolerance policies for weapons other than firearms, and 79% had zero tolerance
policies towards drugs, alcohol, and violence (Curtis, 2014; Fabelo et al., 2011). During this
time, there was also a rise in the use of harsher consequences for “discretionary” categories of
discipline, such as disrespect or misbehavior (Fabelo et al., 2011). Through these changes, the
zero tolerance era caused a dramatic rise in in-school suspension, out-of-school suspension, and
expulsion (Losen & Martinez, 2013; Sykes et al., 2015; Fabelo et al., 2011). Since 1974, the
number of students suspended annually has doubled from 1.7 to 3.45 million (U.S. Department
of Education, 2014; Pesta, 2018). Meanwhile, after slight increases in the 1980s and 1990s,
juvenile crime has steadily been going down since 1996, as Figure 1 on the following page
Figure 1: Juvenile Arrest Rate Trends Since 1980
Note: This chart was developed the Office of Juvenile Justice and Delinquency Prevention using data from the Bureau of Justice Statistics and the National Center for Juvenile Justice.
As research started to show the inequities and adverse impacts of exclusionary school
discipline in the early 2000s, many groups started publicly condemning the zero tolerance
movement. In a statement in 2013, the American Academy of Pediatrics recommended against
the use of zero tolerance policies and advocated for preventative and rehabilitative approaches to
misbehavior (Lamont et al., 2013; Rocque & Snellings, 2018). Although zero tolerance policies
have now started to roll back in many parts of the country, the long-term adverse effects for
students remain. Specifically, ample research shows that exclusionary discipline leads to student
contact with the juvenile justice system and adverse educational outcomes. Less is known about
the effect of school discipline on contact with the adult criminal system, although early evidence
suggests there is a strong association between exclusionary school discipline and criminal
related to the school-to-prison pipeline, and the following two sections will summarize the
literature on the disparities in school discipline and the short- and long-term consequences of
being disciplined in school.
Theoretical Framework
Theory that is often cited in work related to the school-to-prison pipeline falls under two
umbrellas: first, theories that attempt to explain why certain groups of students are
disproportionately disciplined, and second, theories that hypothesize why experiencing school
discipline leads to adverse outcomes for students. Although many of the theories discussed
below will not be directly tested in this study, this section will help set up an understanding for
the following two sections of the literature review, which describe the empirical research in how
discipline is issued in schools and the adverse effects school discipline has on students.
Why Do Gaps in School Discipline Exist?
A key question in the literature is whether disparities in discipline are due to differential
behavior or differential treatment (Rocque, 2010). Are certain groups of students
disproportionately disciplined because of biased practices or because they act out more?
Some studies have found no significant difference in the frequency or severity of
misbehavior between Black and white students (McCarthy & Hoge, 1987; Skiba et al., 2002;
Carter et al., 2017). In 2011, Skiba et al. argued, “With no evidence that supports the notion that
there are concurrently higher levels of disruption among African American students, we see no
reason to presume that disparate rates of discipline between racial and ethnic groups can be
explained by differential behavioral histories” (Skiba et al., 2011, pg. 103-104).
However, other research has found notable behavioral differences among racial groups
of Black students, 18% of Hispanic students, 12% of White students, and 6% of Asian students
reported having been involved in a physical fight on school property in the past year (Dinkes,
Cataldi, Lin-Kelly, & Snyder, 2007). A 2007 National Center for Education Statistics study
found similar numbers (Aud, Fox, & KewalRamani, 2010).
Consistently, research fails to find evidence that any behavioral differences between
racial groups are significant enough to account for the disparities in discipline rates (Rocque
2010; Skiba et al., 2011; Rocque & Snellings, 2018). By including a variable that measures
“prior behavior,” researchers are able to control for the behavior of students and see if
disciplinary gaps still hold. This control variable has allowed multiple researchers to
independently show that disparities in disciplinary consequences are not accounted for by
disparities in behavior (Rocque, 2010; Petras et al., 2011; Bradshaw et al., 2010).
In conflict with this consensus, Wright, Morgan, Coyne, Beaver, and Barnes (2014)
concluded that their prior behavior controls fully accounted for the Black-white disparity in
suspension, which led them to call into question racial bias in discipline. Many researchers,
however, have called Wright et al. (2014)’s methods into question, specifically the decision to
base their prior behavior variable on teacher ratings. The problem with relying exclusively on
teacher ratings to assess student behavior is that this method assumes that teachers are
objectively reporting student behavior. Realistically, teachers hold implicit biases that may cause
them to over-report non-white students’ misbehavior. For this reason, authors have called for
future research to create robust prior behavior controls that include other measures aside from
teacher reports, such as student self-reports or peer assessments (Rocque, 2010; Rocque &
Snellings, 2018). Horner, Fireman, & Wang (2010) used peer ratings on behavior to reinvestigate
serious disciplinary action was race. In what Rocque (2010) calls “one of the most innovative
studies to date,” McCarthy and Hoge (1987) controlled for students’ self-reports on delinquency
validated with teacher ratings on students’ misbehavior, and they found that significant racial
disparities in suspension still held.
The one area in which differential behavior may drive disparity in discipline is for
students with disabilities. In a recent analysis, Morgan et al. (2019) re-investigated the
suspension gap for students with disabilities because they noticed that many studies on the topic
utilized limited statistical controls. They hypothesized that by using disability status identifiers
from middle or high school, as many authors do, researchers may be creating a reverse causality
problem in which students who were labeled as having a disability late in their K-12 careers were
identified as so because they had repeated behavioral issues in the classroom. To prevent this,
Morgan et al. (2019) chose to conservatively measure disability status as having been identified
by the spring of first grade, and they also included a robust prior behavior variable as a control.
Their analysis found little evidence to suggest that elementary and middle schools are
suspending students with disabilities more than similar students without them. However, their
results do come with limitations. Specifically, their prior behavior variable was based on teacher
ratings. As stated above, this can be problematic because if teachers carry implicit biases into
their ratings of students, then the behavioral variable may also be skewed towards these biases.
Morgan et al. (2019) called for further research to utilize a more objective behavior measurement
and see if their conclusions hold.
Scholars have developed several theories about why Black students are
disproportionately disciplined beyond differential behavior. The racial threat hypothesis, which
perceive relative increases in the minority group as threatening and therefore work to enforce
social control upon the minority group (Barnes & Motz, 2018; Morgan & Wright, 2018).
Research has backed this theory by showing that relative increases in Black student enrollment
are a robust predictor of the use of more punitive disciplinary policies (Welch & Payne, 2010;
Raffaele Mendez et al., 2003; Morgan & Wright, 2018). Some authors have argued that as the
United States became increasingly more diverse, racial threat was the true driving force behind
various social control policies of the late 20th century like zero tolerance and the war on crime
(Welch, 2018; McGrew, 2016). On a more micro level, social construction theory contends that
socialized associations of deviance and aggression with Black and male groups of students can
cause teachers to implicitly interpret their behavior as more threatening and therefore respond
with harsher discipline (Barnes & Motz, 2018; Horner, Fireman, & Wang, 2010). This theory is
supported by some studies that have reported that teachers perceive African American boys as
more deviant and aggressive (Newcomb et al., 2002; Wentzel, 2002; Petras et al., 2011). Lastly,
some scholars have pointed to cultural differences as a primary contributor to disparities (Petras
et al., 2011). Unfamiliar with cultural norms of interaction, white teachers may misread Black
students’ actions or words as aggressive when no harm was intended nor perceived by other
students of that culture (Rocque, 2010). Authors have suggested teacher training, in topics such
as cultural sensitivity or implicit bias, may help alleviate some of these misreads and
misinterpretations, which will be elaborated on more in the policy recommendations section of
Chapter 5 (Rocque, 2010).
Why Would School Discipline Lead to Later Incarceration?
To explain why school discipline frequently leads to adverse academic and criminal
labeling theory, which derives from a developmental cascades framework (Barnes & Motz,
2018). Labeling theory proposes that once a student is branded as deviant, it may reduce their
opportunities and resources by placing them under stricter surveillance (Morgan & Wright, 2018;
Sweeten, 2016). As a result, labeled students may be at risk to receive repeated sanctions by
school officials for milder misbehavior that can be interpreted subjectively, such as disrespect
(Morrison, Anthony, Storino, & Dillon, 2001; Morgan & Wright, 2018). Research shows that,
through word-of-mouth, “troublemaker” students can carry that label with them from
grade-to-grade or even school-to-school (Barnes & Motz, 2018).
Labeling theory also argues that over time, deviant labels may be internalized, which
increases the frequency and severity of misbehavior (Barnes & Motz, 2018; Sweeten, 2016).
Some studies have pushed back on that line of thought, though, by presenting evidence that
behavior does not change after being subject to school discipline. In a sophisticated analysis of
student infraction data, Mittleman (2018) found that the majority of the association between
school suspension and later arrest was attributable to an increased risk for repeated school
removal, rather than escalations in misbehavior. Pesta (2018) also found that exclusionary school
discipline had no significant effect on future behavior for Black and Hispanic students.
Interestingly, Pesta (2018) also found that school discipline had a significant deterrence effect
from future misbehavior for White students. This study connects directly to theoretical
discussions on the deterrent effect of punishment, which scholars argue varies based on the
nature of the offense and the punishment itself (Pesta, 2018; Rocque & Snellings, 2018).
Sherman (1993) explained that discipline will be successful at deterring future delinquency if the
punishment is seen as fair and legitimate and if the person has strong bonds with the institution
action is viewed as unfair or illegitimate and if the person has weak bonds with the administrator
(Sherman, 1993; Pesta, 2018). Qualitative research suggest that non-white students frequently
view classroom rules as being unfairly applied (Sheets, 1996; Morgan & Wright, 2018).
Furthermore, research suggests that being labeled as delinquent can decrease the school bond and
increase disengagement in the classroom (Bowditch, 1993; Cernkovich & Giordano, 1992; Pesta,
2018; Barnes & Motz, 2018). Brought together, these theories and pieces of evidence help
explain why school suspension might place a child on a path towards school drop-out, juvenile
delinquency, and later incarceration.
Disparities in Discipline
Racial, Ethnic, and Gender Disparities
Consistent with the racial threat hypothesis, research has shown that there are large
suspension gaps across race and ethnicity, particularly for Black students. Black students are two
to three times as likely to be suspended as white students are (U.S. Department of Education,
2014; Pesta, 2018; Morgan & Wright, 2018). This disparity greatly increased during the zero
tolerance era of the 1990s and early 2000s. Between 1972 and 2011, the percentage of white
students suspended for more than 1 day per year rose from 3.1% to 5.0%, while the percentage
for Black students increased from 6% to 17% (Losen & Gillespie, 2012; Pesta, 2018). In a
statewide analysis of Texas that controlled for 83 other variables, Fabelo et al (2011) concluded
that black students were 31 percent more likely to receive a suspension for a discretionary
reason. There is also research that suggests the darker an African American child’s skin, the
more likely they are to be subject to exclusionary discipline (Hannon et al., 2013). Today, Black
males are especially at risk. According to the 2018 Department of Education Civil Rights Data
students who received an out-of-school suspension and 23 percent of students expelled. In an
analysis that controlled for an extensive range of student characteristics and contextual factors
including patterns in misbehavior, Mittleman (2018) found that the two strongest predictors of
suspension for students were being male and being Black, respectively.
On the other side, Asian students are the least likely racial group to be disciplined at
school (Pesta, 2018; Morgan & Wright, 2018). Because research on the school-to-prison pipeline
has primarily focused on disparity in discipline between white and Black students, the gap
between Asian students and other groups is not as empirically documented. However, in both a
nationwide analysis by J.F. Gregory (1997) and a statewide longitudinal study by Krezmien,
Leone, and Achilles (2006), Asian students were found to be approximately three times less
likely to be suspended than other racial groups. Authors have called for more research to confirm
this disparate rate (Morgan & Wright, 2018).
Additionally, research on the existence of a white-Hispanic suspension gap is
inconsistent. Some studies have concluded Hispanic students are disciplined more than white
students (Fitzgerald, Hunt, & Kerr, 2019; Pigott, Stearns, Khey, 2018), while some have
concluded the reverse (Krezmien, Leon, & Achilles, 2006). A few have found no statistically
significant difference in the rate of suspension between white and Hispanic students (Morgan &
Wright, 2018; Gregory et al., 2018). The lack of consistency is an issue because often in the
school-to-prison pipeline literature suspension is said to disproportionately affect “students of
color” (Morgan & Wright, 2018). As illustrated above, only the white-Black suspension gap is
well-documented in the literature, and therefore only that inequity can be spoken of with relative
investigate differences in discipline not just between white and Black students in North Carolina
but also between white and Hispanic, Asian, Native American, and multiracial students.
Socioeconomic and School-Level Disparities
Research consistently shows that students from low-income families are more likely to be
disciplined in school than middle- and upper-class students (McCarthy & Hoge, 1987; Mallett,
2017). Additionally, sanctions for lower-class students are more punitive compared to similarly
behaving peers (Petras et al., 2011; Theriot, Craun, & Dupper, 2010; Morgan et al., 2019). Some
scholars have suggested that class and race may interact to put African American students from
low-income households at an especially high risk for exclusionary school discipline (Petras et al.,
2011).
Beyond the individual, the racial and economic makeup of a child’s school can affect
their risk for suspension. Attending an economically segregated school increases the chance of
suspension for students (Morgan et al., 2019; Morgan & Wright, 2018). Research has also found
that schools with larger non-white student populations are more likely to discipline students
more frequently and punitively (Payne & Welch, 2010, 2013; Kupchik & Ward, 2013; Skiba &
Peterson, 1999). Using a variety of school- and district-level measures in their analysis, Hughes,
Warren, Steward, Tomaskovic-Devey, & Mears (2017) found that attending a racially segregated
school increases the likelihood of suspension for Black and Hispanic students. Similarly,
Fitzgerald, Hunt, & Kerr (2019) found in their analysis of Oklahoma public schools that higher
referral rates to the Office of Juvenile Affairs are consistently related to higher percentages of
Ability and Achievement Disparities
Students with disabilities are also disproportionally subject to school discipline (Hashim
et al., 2018). Student with disabilities under IDEA in 2018 represented 12 percent of the total
students enrolled and 24 percent of total students expelled (Dept of Ed Civil Rights Data
Collection, 2018). Suspension rates for students with disabilities are estimated to be about 12%
to 15% while rates for students without disabilities are around 6% to 7% (Morgan et al., 2019).
Additionally, from the years 2007 to 2011, students with disabilities identifying as Black or
African American were the most likely to be suspended or expelled (Garnett, 2014).
Low-performing students are another group that is more likely to be excluded from the
classroom. Research has consistently linked school performance to school discipline, with a
child’s risk of suspension increasing as academic achievement decreases (Gottfredson, 2001;
Rausch & Skiba, 2004; Morgan et al., 2019). No Child Left Behind (NCLB) may have worsened
this trend. Using administrative data from a sample of school districts in Florida, Figlio (2006)
looked at whether school disciplinary practices changed during the NCLB testing period. His
hypothesis was that teachers and schools have an incentive to exclude low-performing students
from the classroom during NCLB testing days to artificially inflate average test scores. Indeed,
he found that although low-performing students are always assigned harsher punishments
compared to their high-performing peers, this gap grows substantially during the testing window
but only for students in the grades that are tested under NCLB (Figlio, 2006).
Adverse Outcomes of Discipline
Academic Failure and Dropout
Exclusionary school discipline has negative educational consequences. In a statewide
expelled repeated a grade, while only 5 percent of students who did not experience school
discipline did so. The authors concluded that disciplinary action doubles a student’s chance of
repeating a grade compared to a classmate with the same characteristics.
Beyond grade repetition, suspension also heightens the risk for dropping out. Both Fabelo
et al. (2011) and Schollenberger (2015), which used NSLY97 data, found that less than half of
students disciplined 10 times or more graduated from high school. Additionally, a single
suspension can potentially increase a student’s risk of dropout by 77% (Suh & Suh, 2007). There
is some evidence that suggests juvenile justice contact, which will be discussed in the next
section, plays a mediating role between exclusionary school discipline and dropout. Bernburg
and Krohn (2003) utilized state administrative data to find that arrest nearly quadruples the
likelihood of high school drop-out. Using a national, longitudinal dataset (NLSY97), Sweeten
(2016) concluded that first-time arrest doubles the likelihood of drop-out, and first-time court
appearance quadruples the likelihood. Interestingly, this study also found that the effect of justice
involvement on drop-out was especially pronounced for less delinquent youth (Sweeten 2016).
However, other research suggests that repeated discipline exponentially heightens the risk for
negative outcomes. Therefore, research is mixed on whether out-of-school discipline is more
detrimental long-term for generally well-behaving or delinquent youth.
A growing body of research suggests that suspended students are not the only ones who
suffer from exclusionary school discipline’s adverse academic effects. Studies have shown that a
school’s approach to discipline influences the achievement of students who are never suspended
as well (Black, 2016). From a theoretical perspective, schools that frequently give out harsh
consequences to students who misbehave can unintentionally harm non-misbehaving students by
perceived by the student body as unfair or arbitrary (Black, 2016). Indeed, one study that
longitudinally tracked suspension and achievement rates within school districts concluded that
high levels of exclusionary school discipline negatively affects the academic achievement of
non-suspended students, particularly in schools with low levels of violence (Morris & Perry,
2016; Black, 2016). Another study that compared suspension and achievement rates across
schools, controlling for race, poverty, and school characteristics, found that a school’s
suspension rate predicts more than one-third of the school’s overall achievement (Rausch &
Skiba, 2004). Advocates have used this evidence to deconstruct the argument that exclusionary
school discipline protects the “good” children from misbehaving or distracting peers.
Juvenile Arrest
The literature on how school discipline can lead to contact with the juvenile justice
system is well developed. Out-of-school suspension or expulsion heightens a student’s likelihood
to have contact with the juvenile justice system through interaction with an officer, citation,
probation, placement in alternative school, or arrest. Multiple studies have used a variety of
methods to confirm that suspension doubles the risk of juvenile arrest (Fabelo et al., 2011;
Monahan et al., 2014; Cuellar and Markowitz, 2015; Mittleman, 2018). Fabelo et al. (2011)
conducted the first statewide multivariate analysis on this topic with Texas students’ academic
and juvenile records. Controlling for 80 variables, the study found that a student suspended or
expelled for a discretionary school disciplinary violation was 2.85 more likely to have juvenile
justice contact within the next academic year. With a difference-in-difference analysis, Monahan
et al. (2014) also found that students were twice as likely to get arrested in the months that they
were suspended or arrested from school compared to other months. Cuellar and Markowitz
youth crime on out-of-school suspension days versus non-suspension days. Most recently,
Mittleman (2018) used propensity score matching on data collected from the Fragile Families
and Child Wellbeing study, and he also concluded that school discipline doubles the risk of
juvenile arrest.
School-to-Prison Pipeline?
Regarding adverse outcomes, what the literature lacks is a clear consensus on how
experience with school discipline affects a student’s likelihood to end up convicted in the adult
criminal system. Until 2012, no research had longitudinally investigated the relationship between
school discipline and adult criminal conviction. In her dissertation, Guan (2012) conducted the
first longitudinal look at this using 13 years of Louisiana combined state data between the
Department of Education (DOE), Office of Juvenile Justice (OJJ), and Department of Safety and
Corrections (DOC) and found that school discipline was a strong predictor of later offense, but
that it may only have relevance predicting adolescent criminality rather than life-long crime.
Jaggers et al. (2016) used the same methods as Guan, who was a co-author on the paper, to find
that the most significant predictors of adult criminal conviction were being male, contact with
the OJJ, and school expulsion. Both Guan (2012) and Jaggers et al. (2016) had a major
limitation, however: only 20% of the available sample could be used in the analysis due to issues
with data matching. As Guan explained in his dissertation:
contains 20% of the student body whose records are found and perfectly matched in the three datasets during the years 1996-2008 in Louisiana” (Guan, 2012).
Recently, two studies utilized national datasets to further explore the relationship between
school discipline and adult criminal conviction. Using the National Survey of Youth from 1997,
Schollenberger (2015) found that among boys suspended for 10 total days or more, more than 75
percent had been arrested by their later teens and more than 33 percent had been sentenced to
correctional facility confinement. Mowen & Brent (2016), who also used NLSY97, found that
suspended youth had higher odds of arrest and that the odds increased with each school year
youth were suspended. Wolf, Kerrin, & Kupchik (2017) created a multi-level logistic regression
model with the National Longitudinal Survey of Adolescent to Adult Health and concluded that
suspension in youth increases the odds of adult incarceration by 72 percent. By also analyzing
Add Health data, Katsiyannis, Thompson, Barrett, & Kingree (2013) found that the odds of being
charged with a violent crime in adulthood were approximately five times higher for youth who
had been suspended in secondary school compared to otherwise similar youth who had not been
suspended.
Therefore, although prior research has shown association between exclusionary school
discipline and adult criminal convictions, this relationship has only just started to be investigated.
The evidence for this association that is currently available to researchers and advocates in the
education field is largely based on exploratory results from two national datasets, which both
rely on self-reported suspension data. All authors cited in this section have called for more
research on this association to further understand how a child’s suspension record affects their
Chapter 3: Methods
Data
The data for this study is adapted from a longitudinal dataset developed by Lauen et al.
(2018). The researchers matched data from two sources: the North Carolina Department of
Public Instruction (NCDPI) and the North Carolina Department of Public Safety (NCDPS).
NCDPI provided information on demographics, academic performance, and disciplinary records
for all public school students in North Carolina who were first-time ninth graders between 2006
and 2012. NCDPS publishes all misdemeanor and felony convictions as public record on their
website. The researchers first pulled out all misdemeanor and felony convictions up until the end
of 2016 from the NCDPS website, and then matched that data with the NCDPI data by first
name, last name, and birthdate. This created a longitudinal dataset that tracks the academic and
criminal records of seven cohorts of students starting in eighth grade. For their sample, the
researchers decided to only include students who had appeared in the NCDPI dataset for both
eighth and ninth grade, which excluded students who had been educated at home, in a private
school, or in another state for either of those years. There was also a small amount of students
who could not be matched across the two datasets due to minor inconsistences. In total, the
merged dataset includes 738,975 students.
Two of the seven cohorts have full student disciplinary records from eighth to twelfth
grade. Since these records are essential to the study’s analysis, the other five cohorts were
automatically excluded from the analysis. This leaves two cohorts of students, one cohort that
entered ninth grade in 2011 and another in 2012. Both have complete information on academic
attendance, performance, and discipline from eighth to twelfth grade and criminal conviction
tracks students five years after ninth grade opposed to four. Assuming the average ninth grader is
15 years old, this allows us to track convictions in the adult criminal system up until the age of
20. Below is the distribution of criminal offenses in 2016 by age of conviction. Of all criminal
convictions in 2016, approximately 9% of convictions were given to people between the ages of
16 and 20. Unfortunately, this study’s conviction data does not include convictions that may
have occurred during the peak ages of 22 to 27.
Figure 2: Distribution of Criminal Convictions by Age
Note: This chart was made by aggregating individual criminal convictions, which are regularly updated on the NCDPS website.
Variables
Outcome Variables
The two outcomes of interest are misdemeanor and felony convictions in the adult
criminal system, and these are measured through three binary variables. Ever misdemeanor (var:
ever_misd) equals one if the student was ever convicted of a misdemeanor, ever felony (var:
ever_felon) equals one if the student was ever convicted of a felony, and ever crime (var:
ever_misd_or_felon) equals one if the student was every convicted of either type of crime. In 0
0.5 1 1.5 2 2.5 3 3.5 4 4.5 5
Chapter 4, ever crime outcomes will be reported when there is no significant difference between
ever misdemeanor and ever felony outcomes.
The criminal outcomes of individuals who moved outside of the state or changed their
name past ninth grade are impossible to track. Therefore, a limitation is that it is not feasible to
distinguish a student who does not appear in the dataset because they have never been convicted
of a crime from a student who does not appear because of a location or name change. All of these
potential students were still coded as “0” under ever_felon and ever_misd, which treats them as
having not been convicted of a crime (Lauen et al., 2018).
Treatment Variables
There are two treatment variables in this study: in-school suspension and out-of-school
suspension. The data on school discipline is arranged by grade, and this study will focus on
discipline administered in ninth grade since students enter and exit the dataset after ninth grade.
Additionally, ninth grade is the most common year for a student to experience exclusionary
school discipline. Fifteen percent of students in the cohort were suspended out-of-school in ninth
grade, compared to 14% in eighth, 13% in tenth, 10% in eleventh, and 6% in twelfth.
Ever suspended in-school in ninth grade (var: iss_1) and ever suspended out-of-school in
ninth grade (var: oss_1) are binary variables coded as “1” if the student received an in-school or
out-of-school suspension in ninth grade. In choosing these two variables to analyze, this study
aims to investigate the difference in effect between an in-school and out-of-school suspension.
Using just these two variables as treatments would prevent this study from analyzing the
compounding effect school discipline can have on a student. For that reason, I have included two
more variables that indicate the total number of in-school suspensions (var: number_iss_1) and
are set up in categorical form, and they will allow the analysis to investigate whether school
discipline exponentially worsens outcomes for students, which is what previous research on the
topic has shown.
Control Variables and Moderators
All analyses will control for student sex, race, economic disadvantage, disability, limited
English proficiency, academic performance, and school affluence, and models will investigate if
these factors act as moderators to the relationship being investigated. Sex is indicated by a binary
variable (var: male) that is coded as “1” for male students. Race is indicated by a series of binary
variables, and students could only be coded as “1” for one race: Asian (var: asian), Black (var:
black), Hispanic (var: his), Indian (var: indian), multiracial (var: multi), or white (var: white).
For the purposes of this study, economic disadvantage is determined by a student’s eligibility for
free or reduced-price lunch. If a student is eligible for the program in ninth grade, they are coded
as “1” for this binary variable (var: frlnch). Students with legally recognized disabilities as of
ninth grade are coded as “1” for disability (var: dis). I additionally chose to control for English
proficiency due to a study that found that students with limited English proficiency were about
half as likely to be subject to exclusionary school discipline (Anderson & Ritter, 2017). Students
with limited English proficiency, measured in ninth grade, are indicated on a binary variable as
“1” (var: islep_1_). Since research has shown that low-performing students are
disproportionately disciplined, I created an academic performance control variable that is a
combined score of eighth grade math and reading standardized test scores. After combining the
two scores, this composite variable (var: st_score) was re-standardized to make the mean equal 0.
Results for academic performance are analyzed at the mean, one standard deviation above and
Out-of-school suspensions in eighth grade is added as a binary (var: ever_oss_0) and
continuous variable (var: number_oss_0) to control for pretreatment behavior. Number of
absences in eighth grade (var: number_of_abs) is added for the same purpose.
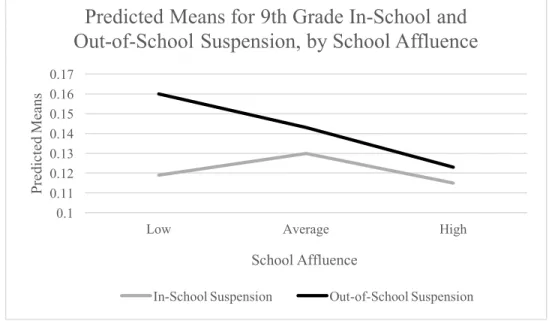
As stated in the literature review, the relative level of affluence in a child’s school can
also affect their likelihood of experiencing school discipline (Morgan et al., 2019; Morgan &
Wright, 2018). School affluence is calculated by aggregating the percentage of students in the
student’s school that are eligible for free and reduced price lunch. This variable (var: pctfrlnch) is
set up categorically. Schools with 33% or less of students eligible for free and reduced price
lunch are coded as “high affluence,” schools with 66% or more of students eligible are coded as
“low affluence,” and schools in between these two numbers are coded as “average affluence.”
Attendance at an early college high school in ninth grade will be investigated as a
moderator to the relationship between exclusionary school discipline and adult criminal
convictions. If a student attended an early college high school in ninth grade, they are coded as
“1” for that variable (var: echs_1). Student sex, race, economic disadvantage, disability, and
limited English proficiency will all be investigated as moderators as well.
Sample
The sample consists of 105,928 public school students in North Carolina who were
first-time ninth graders in 2011. Approximately 54% of the students are White, 27% are Black, and
11% are Hispanic, which are similar to state racial demographics for that age group (U.S. Census
Bureau Population Estimates, 2014). Fifty-one percent of the students are male, 48% are
economically disadvantaged, 13% have a disability, and 5% have limited English proficiency.
The average student in the sample attends a school in which approximately 48% of students are
suspended in-school in ninth grade. The average student who was suspended in-school or
out-of-school had a mean of 1.21 and 1.51 in-out-of-school or out-of-out-of-school suspension, respectively. Two
percent in the cohort have been convicted of a misdemeanor, and 1% have been convicted of a
felony. Approximately 3% attended an early college high school in ninth grade.
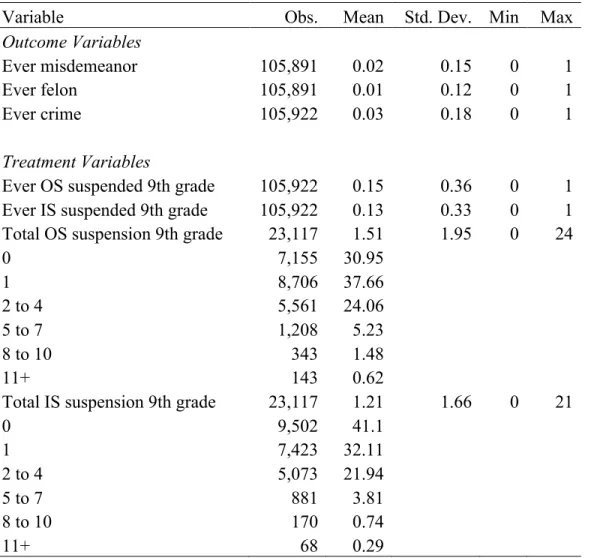
Table 1:Descriptive Statistics for Sample
Variable Obs. Mean Std. Dev. Min Max
Outcome Variables
Ever misdemeanor 105,891 0.02 0.15 0 1
Ever felon 105,891 0.01 0.12 0 1
Ever crime 105,922 0.03 0.18 0 1
Treatment Variables
Ever OS suspended 9th grade 105,922 0.15 0.36 0 1
Ever IS suspended 9th grade 105,922 0.13 0.33 0 1
Total OS suspension 9th grade 23,117 1.51 1.95 0 24
0 7,155 30.95
1 8,706 37.66
2 to 4 5,561 24.06
5 to 7 1,208 5.23
8 to 10 343 1.48
11+ 143 0.62
Total IS suspension 9th grade 23,117 1.21 1.66 0 21
0 9,502 41.1
1 7,423 32.11
2 to 4 5,073 21.94
5 to 7 881 3.81
8 to 10 170 0.74
11+ 68 0.29
Table 1
(Continued)
Variable Obs. Mean Std. Dev. Min Max
Controls and Moderators
Ever OS suspended 8th grade 105,922 0.14 0.35 0 1
Ever IS suspended 8th grade 105,922 0.16 0.36 0 1
Total OS suspensions 8th grade 25,033 1.24 0.171 0 18
Total IS suspensions 8th grade 25,033 1.41 1.78 0 28
Total absences 8th grade 105,895 8.33 8.79 0 170
Male 105,906 0.51 0.5 0 1
White 105,899 0.54 0.5 0 1
Black 105,899 0.27 0.44 0 1
Asian 105,899 0.02 0.15 0 1
Hispanic 105,899 0.11 0.31 0 1
Native American 105,899 0.02 0.13 0 1
Multiracial 105,899 0.04 0.19 0 1
Economically disadvantaged 105,918 0.48 0.5 0 1
Disability 105,917 0.13 0.34 0 1
Limited English proficiency 105,919 0.05 0.22 0 1
Academic Performance 100,572 0 1 -3.75 2.9
Attended ECHS 9th grade 105,922 0.03 0.18 0 1
School Affluence 105,859 48.06 18.8 0 100
Low 20,596 19.46
Medium 66,633 62.95
High 18,630 17.6
Analysis
To determine how a student’s individual and school characteristics affect their likelihood
to be suspended, I will run a series of two logistic regression models: one with ever out-of-school
suspended in ninth grade as the outcome and one with with ever in-school suspended in ninth
grade as the outcome. The first model will control for demographic variables, namely race, sex,
and economic disadvantage, to determine the marginal effects of factors students are born with
on likelihood of suspension. The second model will add in academic performance, limited
disciplinary history and absences in eighth grade as behavioral controls. Lastly, for the final
model I will add in school-level variables, namely school affluence and early college high school
attendance in ninth grade.
For the second research question, I will conduct a new series of logistic regression
models with the criminal conviction variables as the outcomes and the suspension variables as
the treatments. The first model will simply estimate each outcome as a function of each
treatment. Since there are four treatments (ever oss, ever iss, number of oss, number of iss) and
three outcomes (ever crime, ever felon, ever misdemeanor), there will be 12 total estimates. The
following four models will follow the same sequence as above. First, demographic variables will
be added as controls, then individual educational inputs, then behavioral controls, and lastly
school-level variables. Across these fives models, changes in estimates will be observed and
described.
To answer the third research question, race, sex, disability, economic disadvantage,
English proficiency, academic performance, and school affluence will be investigated as
moderators. To do this, I will be adding interaction terms to model five to analyze whether
student characteristics strengthen or weaken the effect in-school or out-of-school suspensions
have on criminal convictions. Each student characteristic will be added and analyzed separately
from the others, meaning that interaction terms between two control variables will not be present
in one regression at the same time, aside from a race and sex interaction term that will stay in all
models. By separately analyzing each potential moderator in model five, I will be able to more
precisely measure the moderating effect each variable has.
To investigate the fourth question, attendance at an early college will also be added as an
provide an answer to whether the early college high school intervention strengthens or weakens
the association between school suspension and criminal conviction.
All analyses described above will be performed using StataCorp’s statistical software,
Chapter 4: Results
In this chapter, I will present the results of the series of logistic regression models
developed in Chapter 3. This chapter is divided into three sections. Section A will discuss the
results of models that aimed to understand the factors that affect a student’s likelihood of
suspension. Section B will present the results on how a suspension record is associated with a
student’s likelihood of being convicted of a crime, and Section C will discuss if student and
school factors moderate the association between suspension and criminal conviction.
A. Factors Affecting Likelihood of In-School and Out-of-School Suspension
Table 1 of the Appendix displays adjusted coefficient estimates and standard errors from
models predicting in-school and out-of-school suspension in ninth grade. From model 1 to model
4, the difference between Hispanic and white students in likelihood for both in-school and
out-of-school suspension loses statistical significance, as does the difference between Native
American and white students for in-school suspension. All other controls are highly statistically
significant. As Table 1 indicates, a variety of student factors influences their likelihood of
suspension.
First, as Figure 3 on the following page shows, there are substantial racial disparities in
the likelihood of receiving a school suspension, particularly for an out-of-school suspension.
Controlling for all other factors, the average Black ninth grade student in North Carolina has a
17% likelihood of being suspended out-of-school, while the average white or Hispanic student
has a 13% likelihood. The average multiracial student and the average Native American student
also have higher likelihoods for out-of-school suspension at 16%. There is no difference between
the average Black and white students’ probabilities to receive an in-school suspension, although
being suspended in-school, the average multiracial student has a 15% likelihood. The average
Asian student has the lowest likelihood of being suspended in-school or out-of-school at 6% and
8%, respectively.
Figure 3: Adjusted Predicted Means for In-School and Out-of-School Suspension, by Race
Note. Displays adjusted means, controlling for all other variables listed in the controls and moderators section of Chapter 3. Sample is all public school students in North Carolina who entered ninth grade in 2011.
A student’s sex also influences probability of suspension. The probability of receiving a
suspension in ninth grade, in-school or out-of-school, is approximately 1.3 times higher for the
average male student compared to the average female student controlling for all other factors.
0.13 0.13
0.12
0.06
0.11
0.15 0.13
0.17
0.13
0.08
0.16 0.16
0.00 0.02 0.04 0.06 0.08 0.10 0.12 0.14 0.16 0.18
White Black Hispanic Asian Native American Multiracial
Pr
edi
ct
ed
M
ea
ns
Race
Predicted Means for In-School and Out-of-School
Suspension, by Race
Figure 4: Adjusted Predicted Means for In-School and Out-of-School Suspension, by Sex
Note. Displays adjusted means, controlling for all other variables listed in the controls and moderators
section of Chapter 3.Sample is all public school students in North Carolina who entered ninth grade in 2011.
The average Black male has the highest likelihood for out-of-school suspensions at 19%,
and the average multiracial male has the highest for in-school suspension at 15%. Racial
differences in likelihood remain the same regardless of sex, with both the average Black male
and female student having a probability of out-of-school suspension that is 1.5 times higher than
their white counterparts. To see more subgroup probabilities, Table 2 of the Appendix includes
unadjusted and adjusted estimates for in-school and out-of-school suspension by race and sex.
As Figure 5 shows, students who are economically disadvantaged have a greater
likelihood of being suspended in-school and out-of-school. The average economically
disadvantaged student has approximately 1.5 and 1.4 times the likelihood of being suspended
in-school and out-of-in-school compared to their non-disadvantaged peer, respectively. This disparity
is consistent across sex race, as seen in Figures 1 and 2 of the Appendix. The average black
economically disadvantaged male and the average Native American economically disadvantaged 0
0.05 0.1 0.15 0.2
In-School Out-of-School
Pr
edi
ct
ed
M
ea
ns
Type of Suspension
Predicted Means for 9th Grade In-School
and Out-of-School Suspension, by Sex
male have the highest likelihood for out-of-school suspension at 21%. The average multiracial
economically disadvantaged male has the highest likelihood for in-school suspension at 17%.
Figure 5: Predicted Means for In-School and Out-of-School Suspension, by Economic Status
Note. Displays adjusted means, controlling for all other variables listed in the controls and moderators
section of Chapter 3. Sample is all public school students in North Carolina who entered ninth grade in 2011.
Controlling for all other student characteristics, the average student with a disability has
relatively the same likelihood of being suspended in-school and out-of-school compared to the
average student without a disability. Across all adjusted and unadjusted models, the difference
between the two average students is not statistically significant. This contradicts prior research
that shows that students with disabilities are disproportionately subject to school discipline.
Figure 6 illustrates this lack of disparity, which is also consistent across race and sex. 0
0.05 0.1 0.15 0.2
In-School Out-of-School
Pr
edi
ct
ed
M
ea
ns
Type of Suspension
Predicted Means of 9th Grade
In-School and Out-of-In-School
Suspension, by Economic Status
Figure 6: Predicted Means for In-School and Out-of-School Suspension, by Disability Status
Note. Displays adjusted means, controlling for all other variables listed in the controls and moderators
section of Chapter 3. Sample is all public school students in North Carolina who entered ninth grade in 2011.
A finding that is consistent with prior research is that students with limited English
proficiency are less likely to be suspended. The average student with limited English proficiency
has about an 11% likelihood of being suspended in-school, compared to about a 13% likelihood
for the average student without limited proficiency. For out-of-school suspension, the average
likelihood drops from approximately 15% to 12%. Although this gap holds little practical
significance, the difference between the two student groups is statistically significant at the p <
.001 level.
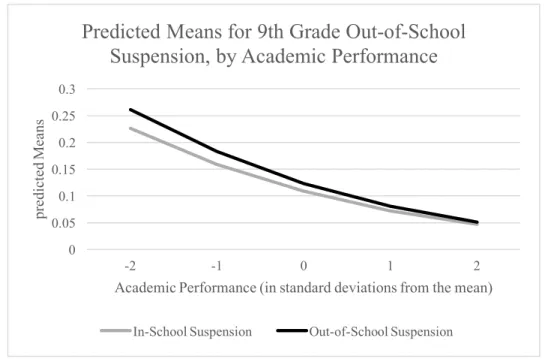
Academic performance also influences a student’s probability of being suspended. The
average student who performs at 2 standard deviations below the mean has a likelihood that is
4.8 and 5.1 times higher for in-school and out-of-school suspension, respectively, compared to
the average student who performs at 2 standard deviations above the mean. This disparity is also
consistent across racial groups, which can be seen in Figure 3 of the Appendix. The average 0
0.02 0.04 0.06 0.08 0.1 0.12 0.14 0.16
In-School Out-of-School
Pr
edi
ct
ed
M
ea
ns
Type of Suspension
Predicted Means of 9th Grade
In-School and Out-of-In-School
Suspension, by Disability Status
Black student who performs at two standard deviations below the mean has a 31% likelihood of
being suspended out-of-school, while the average Black student who performs at two standard
deviations above the mean has a 6% likelihood.
Figure 7: Predicted Means for In-School and Out-of-School Suspension, by Academic Performance
Note. Displays adjusted means, controlling for all other variables listed in the controls and moderators
section of Chapter 3.Sample is all public school students in North Carolina who entered ninth grade in 2011.
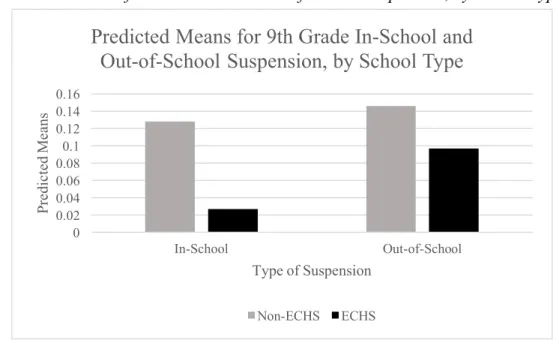
Part of my first research question is whether school characteristics affect a student’s
likelihood of being suspended, and the fourth question specifically asks about the Early College
High School (ECHS) model. The results show that students who attend an ECHS are
significantly less likely to receive a suspension, especially an in-school suspension. As seen in
Figure 8 on the next page, the average student who does not attend an ECHS has a 1.5 times
greater likelihood of receiving an out-of-school suspension in ninth grade and a 4.7 times greater
likelihood of receiving an in-school suspension compared to the average student who attends an
ECHS. Racial disparities still exist in the early college model, though. Figure 3 of the Appendix
shows that early colleges disproportionately suspend Black, multiracial, and Native American 0
0.05 0.1 0.15 0.2 0.25 0.3
-2 -1 0 1 2
pr
edi
ct
ed
M
ea
ns
Academic Performance (in standard deviations from the mean)