In-Situ Measurement of Vadose Zone Hydraulic Properties
Sarah Hinshaw
IntroductionSoil hydraulic properties (i.e., soil water retention and unsaturated hydraulic conductivity) are
fundamental for quantifying infiltration and unsaturated zone flow. They are used to create hydrographs
that simulate hydraulic response showing outcomes of infiltration events, compare soil properties
before and after landscape changes, and to show hysteretic behavior among varying soil types.
Detection of hydraulic properties is complex because different measurement techniques can influence
contrasting model results, both in the saturated1 and unsaturated zone. Best practices for measuring soil
hydraulic properties vary based on dominant flow type, soil characterization, and scale.1
Vadose zone hydrologic response is significantly more complicated to quantify than saturated
zone response due to nonlinearity between water content and hydraulic conductivity, as well as
structural heterogeneity in soil.2 Pedotransfer functions (PTFs) are common methods to relate easily
measured hydraulic properties to those which are challenging to obtain in the field. Pedotransfer
functions are basis for large databases that contain values for hydraulic properties in relation to each
other. For example, it is possible to look up pressure head in a database and receive a usable value for
probable water content at that point, based on soil textural properties. Hydraulic properties derived
from PTFs are then used to solve Richards’ equation to further evaluate unsaturated flow regimes. 3
Several studies have shown issues with PTFs which aim to solve Richards equation.2,4,5,6
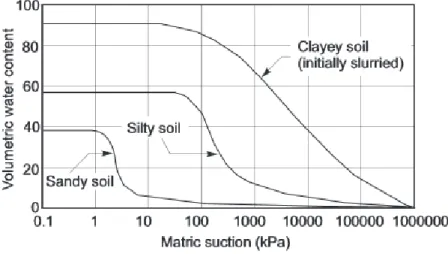
PTFs are also utilized in the creation of characteristic curves, or visual representations of the
relationship between hydraulic properties in varying soil types. PTF-generated characteristic curves are
commonly manufactured with agricultural soils in lab settings, eliminating the possibility for
incorporation of preferential flow and other heterogeneity.7 In place of volumetric water content, bulk
density and textural properties of soil are often used to derive values for hydraulic properties instead of
real measurements.7 Mixed agricultural soils contain relatively homogeneous particles and do not reflect
soil differentiation that occurs in other settings such as forested land. Though widely accessible, PTFs
may be oversimplified and cause disconnect between generated water retention and actual behavior of
soil within a catchment, particularly when additional factors may alter a soil’s physical structure without
changing the textural classification.
Several pedotransfer function models exist to directly relate volumetric water content with
matric potential. A study by Leong and Rahardjo (1997) surveyed various equations using different
numbers of parameters relating volumetric water content and matric potential. All of the methods to
create characteristic curves mathematically can be combined into one seven parameter equation. Each
parameter represents a scaling factor based on textural properties of homogenous soil. Of all the
equations provided, Leong and Rahardjo suggest that the three parameter Fredlund and Xing (1994)8
equation creates characteristic curves that best fit data while minimizing computational efforts by
incorporating only three unknowns, rather than seven.9
Equation 2. Fredlund and Xing (1994) 3 parameter equation for calculating characteristic curves. a, n, and m
Disturbances associated with land cover change such as forest clearing and mono-cropping have
substantial impacts on soil-hydraulic properties, which in turn have cascading impacts on near-surface
hydrologic response. Although disturbances can alter soil-water retention and conductivity relations,
hydrologic models relying on traditional texture based PTFs are not able to capture the disturbance
impact on infiltration and soil-moisture storage. Therefore, in-situ estimates of characteristic curves of
soil water retention and hydraulic conductivity relations are needed to predict hydrologic impacts of
land cover change, and to address the generalization of water retention and conductivity curves from
PTFs.
In order to create in situ characteristic curves, the first step is to fully understand each
parameter individually. In this study, we analyze infiltration experiments in two different land
treatments. We present a method for in-situ estimates of effective hydraulic properties that contribute
to characteristic curves by capturing hysteretic soil-water retention properties at the plot scale. We
apply this method to two different forest treatments to investigate the impact of land-use disturbances
on soil-hydraulic properties. Volumetric water content is monitored in a well-studied catchment over
periods of wetting and drying. Time series of water content over wetting and drying periods are
compared in two land treatment types in order to make inferences about how disturbance impacts soil’s
that examines and improves PTFs, which are perhaps more widely used than they ought to be in
hydrologic models.
Methods
Study Area
The G. W. Hill Demonstration Forest, henceforth referred to as Hill Forest, is an experimental
forest acquired by North Carolina State University in 1931 and currently used for a variety of forestry
and hydrologic research. It is located in Durham County, within the Falls Lake Watershed of the Neuse
River Basin in the Piedmont region of North Carolina (Figure 1). Streams located here are in the smaller
Flat River Watershed. The entire forest is 991ha in area, and was intensively studied for water balance
purposes from 2007-2010.10 The catchment of interest is 29ha and includes forested slopes and clear cut
areas with predominantly south aspect and average slopes of 13%11. Prevalent overstory species in the
forested section of the catchment are around 30 years old and include oak, red maple, sweetgum, tulip
poplar, American beech, and loblolly pine.10 The area receives annual precipitation of 1,130mm.11
Hill Forest is underlain by Carolina Slate Belt geology, specifically in the Virgilina Suite. Local
bedrock is composed of Late Proterozoic-Cambrian (about 520-650 million year old) metagranitic rocks.
The area contains a network of now metamorphosed plutons including the Mt. Moriah pluton, and the
Flat River Complex which is known for dominantly granodiorite metamorphosed to Greenschist facies.12
Greenschist facies minerals include chlorite, actinolite, and albite, and are formed in low temperature,
moderate pressure conditions. Metavolcanic rocks lie adjacent to Hill Forest, and develop into soils with
higher clay content than soils derived from metagranitic rocks. Metamorphism occurred when large
pieces of continental crust collided to conjoin the mountains and piedmont of North Carolina.13
In a water balance study by Dreps et al,11 soils of Hill Forest, including the Tatum, Appling, and
other series are described in detail:
The Tatum soil series (fine, mixed, semiactive, thermic Typic Hapludults) covers 55%
of the catchment, primarily on hillslopes around stream areas. The Tatum E series has
15-25% slopes (USDA, 1971, 2010), and many hillslope locations have slopes greater
than 40% and semiactive clays described as having moderate shrink-swell potential.
The remaining 45% of the HF catchment is covered by hydrologically similar fine,
kaolinitic, thermic Typic Kanhapludults (Appling, Cecil, and Georgeville series) (USDA,
1971) that are deep and have low shrink-swell potentials in the subsurface and depths
to bedrock greater than five feet (USDA, 1971). Initial field observations and
laboratory analysis suggest that the riparian soils are morphologically distinct from
the surrounding Tatum soils, and are likely Entisols with less developed, sandier
surface and subsurface horizons.11
Field sites for this study are located in the riparian zone as well as upslope flat
area. Riparian soil observations agree with Dreps et al and fall into the sandy loam
higher shrink swell potential, as well as lower porosity. Clay-rich soils are anisotropic with
different hydraulic conductivities in the vertical and horizontal directions. This
anisotropy inspires less vertical and more lateral flow within clay soils, and also increased
infiltration excess overland flow.
Part of the experimental area was cleared in November 201014, creating immediately adjacent
areas of clear cut (HFCC) and forested (HF) land treatments that run off to the same stream. In this
study, we measured water content response to known applied fluxes in both forested and clear cut
areas.
Field Experiments
Prior to field experiments, a lab trial was performed to gain an accurate wetting front curve and
to test equipment. Sand from Jordan Lake, NC was collected in a 5-gallon bucket. Decagon EC-5 time
domain reflectometry (TDR) probes were inserted at 5cm, 10cm, and 20cm depth in the bucket, and 2
liters of water were gradually poured over the sand. Volumetric water content was measured overnight
with a Decagon Em50 data logger. These instruments, along with Decagon 5TE soil moisture sensors,
were used for the remainder of this research.
Experimental sites within the field catchment were roughly 60m from each other. The forested
site (HF) had slopes of approximately 12% and was situated about 5m from the nearby creek. The clear
cut site was flat with significantly different vegetation including grass, shrubs, briars, and young pine
trees. Each site had 0.5m trench dug for TDR probe insertion. EC-5 TDR probes were inserted at 5cm,
and 20cm depths. A shortage of probes caused the inconsistent number of probes at the two sites.
Decagon Em50 data loggers were installed for data collection throughout the study period.
Infiltration experiments were conducted at forested and clear cut sites. 0.6m by 0.6m plots were
set up adjacent to the trenches. Plots were cleared of leaf litter to avoid interception and unnecessary
overland flow. A conventional backpack sprayer with marked volume was used to spray 15 liters onto
each plot over periods of about 30 minutes each. Incipient ponding occurred briefly in some instances.
Upon observation of incipient ponding, spray halted. Overland flow appeared occasionally, but overall
did not cause many pauses in the experiments. Volumetric water content was monitored over a period
of 48 hours from Friday, November 21st to Sunday, November 23rd, 2014.
Artificial infiltration experiments are supplemented by observation of natural precipitation
events in both forested and clear cut areas. Volumetric water content was monitored over a period of
two weeks. Within those two weeks, a large storm took place on the morning of April 8th.
In addition to lab and field study, a HYDRUS-1D model was run using soil moisture data from the
field. This model shows a general, simplified solution to Richard’s equation using indexed values for
hydraulic conductivity and other soil hydrology parameters. In HYDRUS, a one dimensional soil profile Figure 3. Location of HF and HFCC within Hill
was created to represent conditions at Hill Forest. This model can be useful for future work by providing
a comparison for future generated in situ characteristic curves.
Results
1. Lab Results
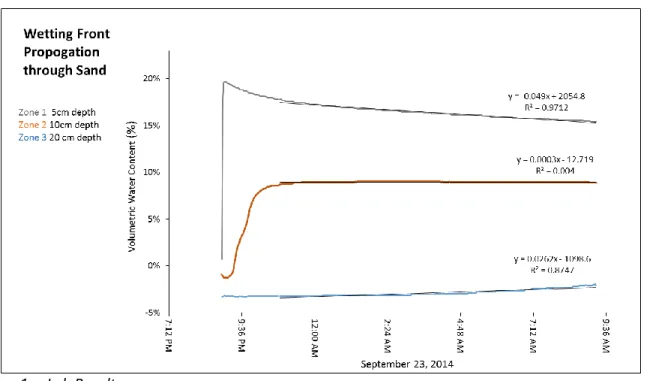
Experiment 1 was conducted in a lab setting in sand that is assumed to be relatively
homogenous and isotropic. The topmost section of sand reacted quickly to the addition of water,
jumping from 0.7% water to 17.9% water within one minute. Sand at 10cm depth took about 50 minutes
to increase from the minimum positive moisture value (0.4%) to the point of inflection where moisture
begins to level off (7.9%). The probe at 20cm did not show a significant jump in water content, but
rather recorded negative values throughout the experiment. This is likely a result of the area
surrounding the probe remaining dry during infiltration.
Linear regressions were calculated once the water content began to decline at a constant rate.
In Zone 1, the slope is, as expected, a shallow negative slope that indicates water gradually draining
at 10cm as the top portion lost saturation. Zone 3’s TDR remained negative the entire time, indicating
that no significant amount of water reached the probe. This situation most likely arose by preferential
flow throughout sand in the bucket, or from a non-uniform application of water at the top. However,
the value from Zone 3 gradually increased as water is assumed to have flowed down the sequence from
Zone 1. An increase in humidity surrounding the 20cm probe is a likely explanation. Because the lab
study was conducted in an impermeable plastic bucket, air within pore spaces was only allowed to
escape upwards rather than laterally as in real soil. This could give reason for water not reaching 20cm
depth if air was unable to escape, creating back-pressure that prevented water from flowing below the
pressure-depth threshold.
2. Field Results
y = -0.0037x + 157.13 R² = 0.9719
y = -0.0064x + 268.4 R² = 0.983 y = -0.0324x + 1359.6
R² = 0.9279
y = -0.0309x + 1298.8 R² = 0.9247
15% 17% 19% 21% 23% 25% 27% 29% 31% 33%
1:12 PM 1:12 AM 1:12 PM 1:12 AM 1:12 PM
Volu m etric Wa ter Con ten t (% )
November 21-23, 2014
HF
10cm 20cm
HF reaches a maximum saturation of 30.6% at 3:47pm at 20cm depth. Both 10cm and 20cm
depths react quickly to water application, but 20cm lags behind 10cm by about one minute. Because of
the lag time, the rate of wetting front propagation in this scenario can be calculated as 10cm per
minute, or 0.17cm per second. Soil at 20cm remained consistently more saturated than soil at 10cm for
the entire experiment, aside from initial wetting. This can be attributed to an extremely porous root
zone in HF, with many large preferential pathways created by 30+ year old tree root networks. Descent
in the soil profile of HF reveals higher clay content through subsequent soil horizons, which supports
higher capability for ponding and slow drainage compared to upper soil counterparts.
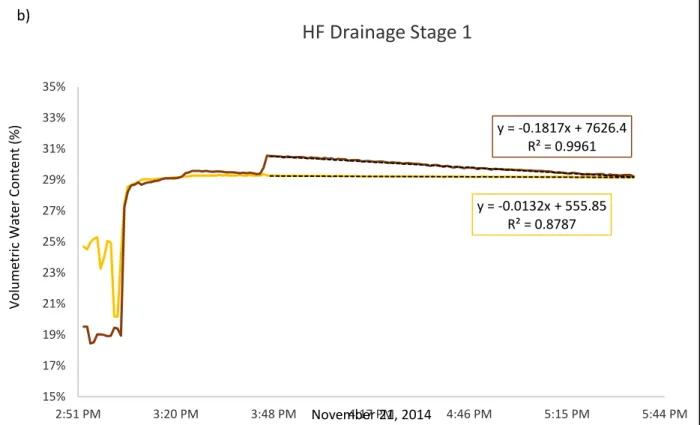
HF shows three distinct stages of drainage. The first stage, Stage 1, occurs after the maximum
soil moisture value is reached. Stage 2 starts when the volumetric water content of both depths Figure 5. a) Compiled experimental data from HF. The second and third stages of drainage are shown, along with linear regression equations for both stages at depths of 10cm and 20cm. b) Experimental data is magnified to show Stage 1, the initial, most rapid stage of drainage. Variable, oscillating values before initial wetting show instrument adjustment to surroundings, and should not be considered in the wetting and drying processes.
y = -0.0132x + 555.85 R² = 0.8787
y = -0.1817x + 7626.4 R² = 0.9961
15% 17% 19% 21% 23% 25% 27% 29% 31% 33% 35%
2:51 PM 3:20 PM 3:48 PM 4:17 PM 4:46 PM 5:15 PM 5:44 PM
Volu m etric Wa ter Con ten t (% )
November 21, 2014
HF Drainage Stage 1
converges and the rate of drying becomes slower. The significantly longer Stage 3 is the last stage of
drainage able to be measured within 48 hours. Stage 3 occurred when the slope once again flattened
and water content gradually decreased. If stage three characterized the final process of drainage, it
would take more than a year until the soil reached its initial water content of 19.5%. Of course, this
would neglect additional processes requiring water in soil such as evaporation, transpiration, microbial
uptake, and others.
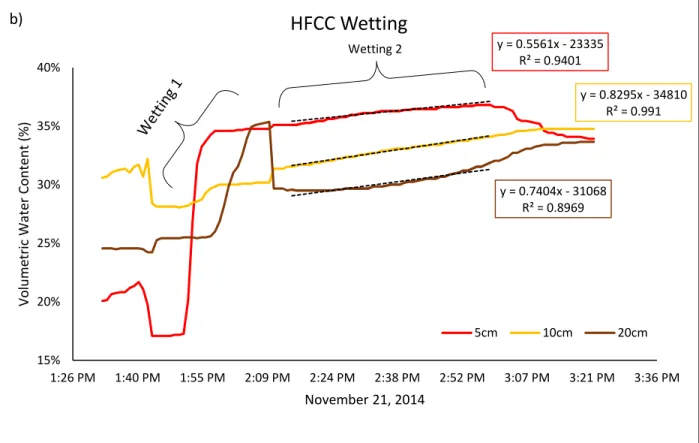
y = 0.5561x - 23335 R² = 0.9401
y = 0.8295x - 34810 R² = 0.991
y = 0.7404x - 31068 R² = 0.8969
15% 20% 25% 30% 35% 40%
1:26 PM 1:40 PM 1:55 PM 2:09 PM 2:24 PM 2:38 PM 2:52 PM 3:07 PM 3:21 PM 3:36 PM
Volu m etric Wa ter Con ten t (% )
November 21, 2014
HFCC Wetting
5cm 10cm 20cm
Wetting 2 b)
y = -0.1583x + 6641.7 R² = 0.8818
y = -0.2163x + 9077 R² = 0.9869
31% 32% 32% 33% 33% 34% 34% 35% 35%
3:21 PM 3:50 PM 4:19 PM 4:48 PM 5:16 PM 5:45 PM
Volu m etric Wa ter Con ten t (% )
November 21, 2014
HFCC Drainage
5cm 10cm 20cm
-Stage 2 Drainage for 5cm -Stage 1 Drainage for 20cm c)
HFCC shows diverse stages in wetting as well as drying. The initial wetting period moved quite
fast in HFCC at 5cm and 20cm, but remained gradual at 10cm depth. This site also showed a lag time
between shallow and deeper probe heights. There is a spike at 20cm depth in which the water content
increases rapidly, suddenly drops, and then begins the second period of wetting. This could be a result
of runoff directly onto the probe, or quick drainage by means of a preferential pathway. The probe at
10cm did not show changes in soil moisture throughout the testing period after original wetting. This
could be due to instrumental error or a pocket of moisture that formed and was trapped during the 48
hours. In figure 6c) the water content appears to decrease jerkily. This jagged curve could be a reflection
of the unsteady nature of drainage at the pore scale, and represents how areas with large pore
diameters drain faster than areas with low porosity. Grains that are closer together have stronger total
hygroscopic influence, and are more inclined to hold water that has adsorbed to mineral surfaces.
Both forested and clear cut soils were monitored over two weeks, a period that includes an actual
precipitation event that occurred on the morning of April 8, 2015. Forested soils respond simultaneously
at depths of 10, 20, and 30cm. This indicates that flow moved very rapidly downward from the ground
surface to the subsurface. Forested soils showed an overall higher maximum water content during this
period, indicating that there is higher combined primary and secondary porosity. Clear cut soils took
longer to respond to the major storm event, and overall reached a lower maximum water content.
Discussion
Much like Hewlett and Hibbert’s landmark study on soil drainage in the southern Appalachains,
our data show distinct stages of drainage that are detectable from rates of soil moisture change over
time. 15 Notable results from this study are the steady rates in water content decline as the soil slowly
Figure 7. a) Forested response to natural precipitation event. b) Clear cut response to natural infiltration event.
drains. This “Stage 3” drainage behaves similarly to groundwater drainage after a precipitation event, or
the baseflow recession that occurs until another storm hits. Each rate of water loss found in this
research indicates that it would take an extremely long period of time to fully drain soils to their original
water contents. However, 48 hours is not long enough to quantify other processes present such as
evapotranspiration, adsorption, microbial use, as well as convergent flow from higher elevation
flowpaths. A longer term experiment could use patterns from Stage 3 to further quantify loss from other
processes. This study adds evidence that subsurface stormflow is composed of old water as well as
new.16 The system gets “flushed,” so to speak, when new water infiltrates. This would not be possible if
soil immediately drained to field capacity shortly after infiltration.
HF and HFCC show different reactions to infiltration, as shown in the results section. HFCC has
the highest saturation value, 36.8% from 2:56 to 2:59pm on November 21. This maximum is at 5cm
which is not measured in HF, so it cannot be directly compared to HF. HFCC still has a higher maximum
water content value than HF at 10cm, reaching up to 35.4%. HF 20cm reached its maximum of 30.6% at
3:47pm. The two sites also show various rates of moisture decline, but little can be reported of a pattern
since 10cm data was not suitable for analysis at HFCC. Instead of quantitative discussion, we propose
the conceptual question: Why would the two soils react differently to the same volume of water over
the same area?
Many factors influence the two soils’ dissimilar reactions to infiltration. First and foremost, HFCC
and HF are visually different soils. HFCC has higher clay content than HF, which could allow for slower
flow through pores in the soil as well as soil swelling instead of immediate drainage. Varying soil types
indicates porosity differences. HF has a higher secondary porosity than HFCC, based on observation of
the root zone and number of trees and rocks present. With more abundant interconnected flow paths
caused by roots and other large particles in the soil, water in HF is able to flow more quickly through the
High porosity and permeability are associated with high hydraulic conductivity, which is
nonlinearly related to water content. As soil moisture increases, i.e. as the infiltration experiment or
natural precipitation progresses, conductivity increases and has potential to drive each soil’s response
farther and farther apart. Slope is also a parameter that can differentiate HF from HFCC by increasing
the lateral flow component in HF. Grayson et al’s classic 1997 paper emphasizes the influence of high
slope, convergent terrain on nonlocally controlled lateral soil moisture flow.17
From observations of natural precipitation events, we can gain insight into long term soil
response to infiltration. During and after the event on April 8th, clear cut soil responded differently than
forested soil. Forested soil supports a sophisticated root network that allowed rapid flow through
several soil horizons. In fact, water flowed through the topmost layer at 10cm that it remained at
consistently lower water content than 20cm, where the root zone ends and clay content increases. Clear
content is slower to respond and reaches lower moisture content because of a combination of factors
including different soil chemistry, a shallower root zone because of grass and young tree vegetation, and
compaction from the process of forest clearing and settling of soil once vegetation is lost. Overall, this
natural response provides evidence that the forested soil has more accommodation space for water
falling as precipitation, and more capacity to infiltrate and percolate down toward the water table.
Water that is prevented from infiltrating due to limiting factors in the clear cut environment has
potential to flow over land as infiltration excess overland flow, also known as Hortonian overland flow.
Although some differences in wetting front propagation arise from spatial characteristics like
slope and proximity to streams, a large amount of soil response can be attributed to land use. Research
has previously established that clear cutting leads to alteration of soil’s physical and chemical response,
evidenced by increased and chemically distinct streamflow following clear cut practices. 18 Land
response to lack of vegetation, and inhabitance of new species that repopulated since the clear cut.
Land disturbance also drastically interrupts natural levels of evapotranspiration and overland flow.
In order to further quantify impacts of land disturbance on soil hydraulic properties, hydrologic
models must be properly calibrated to account for land cover change. Instead of pedotransfer functions
to relate conveniently measured properties like water content to more complex properties (i.e. pressure
head), we need to focus energy and resources on understanding structural as well as textural changes
that alter as a result of land exploitation. Improved grasp on structural drivers for soil land use response
is observable at the plot scale with studies that measure each property individually.
Future Work and Ongoing Research
In addition to soil moisture probes, tensiometers are deployed as an extension of this project.
With pressure head data, we will be able to directly compare characteristric curves generated from
pedotransfer functions with those based on in situ curves, and use both methods to evaluate land
cover change. The current deployment eliminated slope as a variable by placing equipment in a flat
forested area. Chemical analysis of HF and HFCC soils is also undergoing, and we will soon have results
for loss on ignition as a proxy for organic matter in each soil as well as XRF analysis for elemental
composition.
Acknowledgements
Thank you to everyone who helped me with this project. Funding was provided by the Mims and
Pignatiello Fellowship. Thanks to Larry Benninger, who put up with me blubbering about Murphy’s Law
Percy for great lab company and help with field work, Oliver Hamilton for manual labor, and Decagon
Devices for solving the problems that I couldn’t solve myself.
References
1. Davis, S. H., Vertessy, R. A. & Silberstein, R. P. The sensitivity of a catchment model to soil hydraulic properties obtained by using different measurement techniques. Hydrol. Process.13, 677–688 (1999).
2. Vogel, H.-J. & Ippisch, O. Estimation of a Critical Spatial Discretization Limit for Solving Richards’ Equation at Large Scales. Vadose Zone Journal7, 112 (2008).
3. Guber, A. K. et al. Multimodel Simulation of Water Flow in a Field Soil Using Pedotransfer Functions. Vadose Zone Journal8, 1 (2009).
4. Ross, P. J. Efficient numerical methods for infiltration using Richards’ equation. Water Resources Research26, 279–290 (1990).
5. Downer, C. W. & Ogden, F. L. Appropriate vertical discretization of Richards’ equation for two-dimensional watershed-scale modelling. Hydrol. Process.18, 1–22 (2004).
6. Van Dam, J. C. & Feddes, R. A. Numerical simulation of infiltration, evaporation and shallow groundwater levels with the Richards equation. J. Hydrol.233, 72–85 (2000).
7. Vereecken, H. et al. Using Pedotransfer Functions to Estimate the van Genuchten–Mualem Soil Hydraulic Properties: A Review. Vadose Zone Journal9, 795 (2010).
8. Fredlund, D. G. & Xing, A. : Equations for the soil-water characteristic curve. Canadian Geotechnical Journal31, 1026–1026 (1994).
9. Leong, E. C. & Rahardjo, H. Review of Soil-Water Characteristic Curve Equations. Journal of Geotechnical and Geoenvironmental Engineering123, 1106–1117 (1997).
10. Boggs, J., Sun, G., Jones, D. & Mcnulty, S. G. Effect of Soils on Water Quantity and Quality in Piedmont Forested Headwater Watersheds of North Carolina. 49, (2012).
11. Dreps, C., James, a. L., Sun, G. & Boggs, J. Water Balances of Two Piedmont Headwater
Catchments: Implications for Regional Hydrologic Landscape Classification. JAWRA J. Am. Water Resour. Assoc.50, 1063–1079 (2014).
13. Rogers, J. J. W. Stone Quarries and Sourcing in the Carolina Slate Belt, Chapter 2: The Carolina Slate Belt. U.S. Army Corps Eng. Eng. Res. Dev. Center, Constr. Eng. Res. Lab.UNC Archeo, 10–15 (2006).
14. Boggs, J. et al. Grant Final Report: ‘ BMP Effectiveness Monitoring Study - Phase II ’ North Carolina Division of Forest Resources Forestry Nonpoint Source Branch Diameter at Breast Height. US-EPA Non-Point Source Pollut. Control Grant through Sect. 319 h Clean Water Act.NC
Departm, (2010).
15. Hewlett, J. D. & Hibbert, A. R. Moisture and energy conditions within a sloping soil mass during drainage. Journal of Geophysical Research68, 1081 (1963).
16. McDonnell, J. J. A rationale for old water discharge through macropores in a steep, humid catchment. Water Resour. Res.26, 2821–2832 (1990).
17. Grayson, R. B., Western, A. W., Chiew, F. H. S. & Blöschl, G. Preferred states in spatial soil moisture patterns: Local and nonlocal controls. Water Resour. Res.33, 2897 (1997).
18. Swank, W. T., Vose, J. M. & Elliott, K. J. Long-term hydrologic and water quality responses following commercial clearcutting of mixed hardwoods on a southern Appalachian catchment. in
Forest Ecology and Management143, 163–178 (2001).