AN ANALYSIS OF CURRENT PRACTICES FOR NCAA DIVISION I-FBS STUDENT-ATHLETE EXIT INTERVIEWS
Stephen J. Iannotta
A thesis submitted to the faculty of the University of North Carolina at Chapel Hill in partial fulfillment of the requirements for the degree of Master of Arts in the Department of Exercise
and Sport Science (Sport Administration)
Chapel Hill 2015
Approved by:
Erianne Weight
Barbara Osborne
iii ABSTRACT
Stephen Iannotta: An Analysis of Current Practices for NCAA Division I-FBS Student-Athlete Exit Interviews
(Under the direction of Erianne Weight)
On January 10, 1991, the National Collegiate Athletic Association (NCAA)
adopted a bylaw (6.3.2) to its constitution, making it mandatory for member institutions to
conduct exit interviews with their student-athletes. The wording of the bylaw allows schools a
great deal of freedom to choose how they conduct their interviews, who is a part of the interview
process, and what topics are being discussed in the interview itself. This lack of guidance and
direction in the bylaw has led to a wide array of methods used by schools to conduct exit
interviews. This study analyzes the current methods being used by NCAA Division I-FBS
athletic programs to conduct student-athlete exit interviews. A survey of twenty-six Division
I-FBS athletic administrators responsible for exit interview oversight revealed that while methods
for conducting student-athlete exit interviews, the content being discussed is very similar. The
results of the survey serve as a bridge to literature regarding the student-athlete experience and
iv
ACKNOWLEDGEMENTS
I would like to thank my committee, my classmates, colleagues in the Football Offices,
and family for their continued encouragement throughout this entire process. I could not have
v
TABLE OF CONTENTS
LIST OF TABLES ... vii
CHAPTER 1 ... 1
Significane of Study ... 1
Statement of Purpose ... 2
Research Questions ... 3
Definition of Terms... 3
Assumptions ... 4
Limitations ... 5
Delimitations ... 5
CHAPTER 2 ... 6
Role of Intercollegiate Athletics ... 6
Student-Athlete’s Voice ... 8
Exit Interviews ... 11
Theoretical Framework ... 15
CHAPTER 3 ... 19
Subjects ... 19
Instrumentation & Datat Collection ... 19
Data Analysis ... 20
CHAPTER 4 ... 21
vi
Current method of conducting student-athlete exit interviews ... 21
Reason for choosing current method ... 26
Satisfaction level with current method ... 27
Topics being discussed in student-athlete exit interviews ... 29
Reporting exit interview data ... 30
Utilizing exit interview results ... 31
Comparisons by geographic region and athletic department budget ... 33
CHAPTER 5 ... 41
Student-athlete exit interview method ... 41
Exit interview oversight ... 42
Method reasoning... 43
Exit interview satisfaction... 44
Topics being discussed in exit interivews ... 46
Utilization of exit interview results... 48
Geographic region and athletic budget comparisons ... 48
Conclusion ... 50
Future Studies ... 50
vii
LIST OF TABLES
Table 1: S-A Exit Interview Method ... 22
Table 2: Face-to-Face Interview Oversight ... 24
Table 3: Online Survey Oversight... 25
Table 4: Paper Survey Oversight ... 26
Table 5: Focus Group Oversight ... 26
Table 6: Reason for Choosing Current Method ... 27
Table 7: Current Method Satisfaction Level ... 28
Table 8: Topics Being Discussed in S-A Exit Interviews ... 30
Table 9: Method of Reporting Data ... 31
Table 10: Utilization of Exit Interview Results ... 32
Table 11: Exit Interview Results Level of Guidance for Athletic Department Decisions ... 33
Table 12: S-A Exit Interview Method (Geographic) ... 34
Table 13: S-A Exit Interview Method (Budget) ... 35
Table 14: Reason for Choosing Current Method (Geographic) ... 36
Table 15: Reason for Choosing Current Method (Budget) ... 36
Table 16: Current Method Satisfaction Level (Geographic) ... 37
Table 17: Current Method Satisfaction Level (Budget) ... 37
Table 18: Method of Reporting Data (Geographic) ... 38
Table 19: Method of Reporting Data (Budget) ... 38
Table 20: Utilization of Exit Interview Results (Geographic) ... 39
1 CHAPTER I INTRODUCTION
Richard A. Baddour served as the Director of Athletics for the University of North
Carolina at Chapel Hill from 1997-2011. In his fourteen years as the Tar Heels Athletic Director,
Mr. Baddour was responsible for overseeing over the well-being of all UNC student-athletes. In the late 1980’s, while Baddour served as an associate athletic director for the Tar Heels, there
became an increased focus on studying the student environment for Carolina athletes. Originally,
graduating student-athletes completed written surveys to a faculty committee and members of the
athletic department. Baddour wanted to add a personal element to the process though, and so an
exit interview was created. The exit interviews, which were conducted in the spring, consisted of
five to six student-athletes meeting with UNC’s Faculty Athletics Rep and a representative from
the athletic department. While this was a great stepping stone for beginning to understand the
experience of student-athletes, Baddour claims that approximately only 50 student-athletes
completed surveys each year, and only 20-30 were personally interviewed.
Significance of Study
On January 10, 1991, the National Collegiate Athletic Association (NCAA) adopted a
bylaw to its constitution that made it mandatory for institutions to conduct exit interviews with
2
Evaluation” section of Article 6 of the NCAA Constitution, Institutional Control. The bylaw
states:
“The institution’s director of athletics, senior woman administrator
or designated representatives (excluding coaching staff members)
shall conduct exit interviews in each sport with a sample of
student-athletes (as determined by the institution) whose eligibility
has expired. Interviews shall include questions regarding the value of the students’ athletic experiences, the extent of the athletics time
demands encountered by the student-athletes, proposed changes in
intercollegiate athletics and concerns related to the administration of the student athletes’ specific sports.”
While this bylaw is important for schools to evaluate the student-athletes’ experiences, the ambiguous nature of the bylaw’s wording deemphasizes the importance of student-athlete
exit interviews. By allowing the institutions to determine the sample size, schools may opt to
conduct a minimal number of exit interviews to simply fulfill a requirement. The true purpose of
the exit interviews, which is for schools to study and evaluate their current operations, is thus
diminished.
Statement of Purpose
The purpose of this study is to analyze the methods of conducting varsity student-athlete
exit interviews utilized by NCAA Division I – FBS athletics programs. The study surveyed
administrators responsible for conducting student-athlete exit interviews during the 2014-2015
3 Research Questions
Based on the review of literature, the following research questions were formed for this
study:
[ RQ 1 ] What methods are Division I – FBS institutions currently using to conduct
student-athlete exit interviews?
[ RQ 2] Why do institutions use the current methods for conducting student-athlete exit
interviews?
[ RQ 3 ] Are athletic administrators satisfied with their current methods of conducting
student-athlete exit interviews?
[ RQ 4 ] What content is being discussed in current student-athlete exit interviews?
[ RQ 5 ] How do athletic departments disseminate data collected from student-athlete
exit interviews?
[RQ 6] Do differences in RQ1-RQ5 exist based on the following criteria?
a. Geographic region
b. Budget size
Definition of Terms
1) NCAA – The National Collegiate Athletic Association is a voluntary membership
organization of higher education universities and institutions that participate in
intercollegiate athletics. The NCAA is the general governing body that develops,
4
2) Division I – FBS – Division I Football Bowl Subdivision, formerly known as Division
I-A, is the top level of college football. In the 2014-2015 academic year, there were 125
full-time institutions and 3 transitional institutions in Division I – FBS.
3) Student-Athlete – A student enrolled full-time at a college or university who is
participating in intercollegiate athletics, either as a scholarship or non-scholarship athlete.
4) Exit Interview – An interview conducted by an institutions’ director of athletics, senior
woman administrator or designated representatives with a student-athlete who has
exhausted his or her athletic eligibility.
5) Power Five – Five Athletic conferences in NCAA Division I FBS. The Power Five
conferences consist of the Atlantic Coast Conference, Big 12 Conference, Big Ten
Conference, Pacific-12 Conference, and Southeastern Conference.
Assumptions
1) The research methods used in this study are valid and reliable
2) Survey participants will answer the survey questions truthfully, objectively, and
completely.
3) Respondents completed the survey voluntarily and understood all questions in a similar
5 Limitations
1) There may be a non-response bias as institutions may elect not to share their methods of
conducting student-athlete exit interviews.
Delimitations
1) The sample of the study will be focused on Division I – FBS institutions. Thus it cannot
be applied to all student-athlete exit interviews for the rest of Division I schools.
2) The study only focuses on what methods institutions are currently using for conducting
6 CHAPTER II
REVIEW OF LITERATURE
Role of Intercollegiate Athletics
Integration of higher education and athletic programs began as a positive form of
entertainment for students that helped build character and promoted both school and community
spirit (Saffici & Pellegrino, 2012). Within the first fifty years of competition, intercollegiate
athletics began to influence the academic component of institutions of higher learning with
growing dominance as the extracurricular activity of choice (Smith, 2011).
The origins of intercollegiate athletics can be traced back to 1850s rowing regattas
between Harvard and Yale Crew teams. At its inception, students created, governed, and
controlled all aspects of competition, but as intercollegiate athletics grew, the need for fair and
safe competition grew as well (Sack and Staurowsky, 1998). In 1906, the Intercollegiate Athletic
Association of the United States (IAAUS) was formed in response to violence in the sport of
football. Although safety was the catalyst that brought the IAAUS into existence, “problems
relating to amateurism and eligibility rules received as much, if not more attention at the first annual meeting” (Sack, 1988). A governing body was needed to standardize rules for
competition, eligibility, and recruiting (Sack and Staurowsky, 1998). The IAAUS was renamed
the National Collegiate Athletic Association (NCAA) in 1908.
7
in 1921, the National Collegiate Track and Field Championships. Although the NCAA remains a rules-making and governing body for member institutions, the current stated mission of the organization is “to be an integral part of higher education and to focus on the development of our student-athletes” (Office of the, 2010, ¶5).
Current advocates for intercollegiate athletics as an integral part of a collegiate
educational experience, argue that athletics helps to define the spirit of the American college. And in addition, it allows colleges and universities to address their broader public purpose (Gerdy, 2002; Toma, 1999). Athletics aids in the overall development of young people,
contributes to increased academic performance and upward occupational mobility, and can help increase a school’s enrollment and revenue (Brand, 2006; Miller, 2003). Many opportunities are
granted to students that participate in intercollegiate athletics that other students do not have the chance to experience. Through participation, values such as dedication, sacrifice, team-work, integrity, and leadership are developed. Each of these character-building values can be acquired through participation and are beneficial throughout life (Duderstadt, 2000; Olivia, 1989). These advocates assert that intercollegiate athletics provides opportunities for student-athletes to develop into individuals possessing desirable character qualities that will succeed in a life after competition has ended.
8
2001) and are not engaged in effective educational practices at the same level as non-athletes (Umbach et al., 2006). The over-arching criticism of intercollegiate athletics is that, in the context of higher education, the interests of academics and athletics are out of balance (Suggs, 2003).
One contributing factor to this lack of balance is that the student-athletes are not well represented in decision-making procedures by the NCAA. There is a lack of student-athlete input in the current reform of intercollegiate athletics. Strides have been made by the NCAA in the last twenty-five years to increase student-athlete involvement in new legislation, but there is still a ways to go until the student-athlete is properly represented.
Student-Athletes’ Voice
Some of the first research done on the “voice of the student-athlete” comes from Jobyann
Renick’s (1974) article, The Use and Misuse of College Athletics from The Journal of Higher
Education. Renick discusses how colleges are reflecting a more liberal attitude towards a
student’s ability to direct his or her own destiny. After citing numerous examples of such ability,
Renick poses the following question:
If athletics are to be an “integral part” of college, and if students
are actively involved in the decision-making process of other
aspects of college life, would it not be reasonable for the
student-athlete to be an active participant in the making of decisions in
athletics?
Renick states that there is an obvious exclusion of student-athletes
9
is belittled to nothing more than a performer “who must comply with eligibility
standards and other regulations to gain the privilege of playing” (Renick, 1974).
Renick concludes by discrediting the NCAA’s claim that intercollegiate athletics
support the development of educational leadership among student-athletes
(Renick, 1974).
In the 2006 Vanderbilt Law Review article, Student-Athlete Contract Rights in the
Aftermath of Bloom v. NCAA, Joel Eckert discusses the lack of legal voice student-athletes have
as well. Citing court rulings from Gulf South Conference v. Boyd, Eckert states that
student-athletes have little choice but to join the association [NCAA]. The specific court ruling stated that “the athlete himself has no voice or bargaining power concerning the rules and
regulations…because he is not a member, yet he stands to be substantially affected, and even
damaged, by an association ruling declaring him to be ineligible to participate in intercollegiate athletics.” Eckert also cites Congressman Spencer Bacchus’ (R-AL) questioning of the validity
of the NCAA as a “voluntary association.” He claims this to be inaccurate due to the fact that
student-athletes are most affected by NCAA decisions, yet they have no voice in the rulemaking
process.
John Allison’s 1995 article in the Kansas Law Review titled, Rule-Making Accuracy in
the NCAA and its Member Institutions: Do Their Decision Structures and Processes Promote
Educational Primacy for the Student-Athlete, further analyzes the degree to which the
perspective of the student-athlete is adequately incorporated into NCAA and institutional
decision-making. Allison discusses that the NCAA has created a vehicle for the student-athlete
10
The Student-Athlete Advisory Committee (SAAC) was formed at the 1989 NCAA
Convention. The primary purpose of this committee was to review and offer student-athlete input
on NCAA activities and proposed legislation that affected student-athlete welfare (NCAA
SAAC, 2002). Its mission statement reads: “The mission of the National Collegiate Athletic
Association Student-Athlete Advisory Committee is to enhance the total student-athlete
experience by promoting opportunity, protecting student-athlete welfare, and fostering a positive
student-athlete image” (NCAA SAAC, 2002). SAAC is comprised of current student-athletes,
both male and female, with separate national committees forming for each division of the NCAA
in 1997. NCAA legislation mandates that all member institutions have SAACs on their
respective campuses (NCAA SAAC, 2002).
Allison is critical of the structure of the national SAACs. He claims that if the committee
hopes to continue to operate that it should be divided into two separate bodies – one of which
represents Division 1-A (FBS) football and Division I men’s basketball, and the other
representing all other collegiate sports. Division I-A football and men’s basketball encounter an
entirely different mix of competing interests and pressures than others with respect to the
furtherance of educational primacy (Allison, 1995).
Despite the presence of the Student-Athlete Advisory Committee, Allison (1995) claims
that it is probably not feasible to design a structure that would guarantee meaningful input from
currently enrolled student-athletes directly to institutional or NCAA decision making because
they do not have the independence nor the maturity and experience judgment to perform the
function adequately. Rather, Allison (1995) postulates that the student-athlete perspective should
be factored into an institution’s decision making by means of an advisory board whose
11
should be publicized to current student-athletes and student-athletes should be given every
opportunity to contact the advisory board directly.
Knorr (2004) explains that Student-Athlete Advisory Committees have progressed better
than Allison expected. Through NCAA sponsorship and resources, the Student-Athlete Advisory
Committee has emerged as a powerful representative for the student-athlete (Knorr, 2004). Each division of the NCAA has its own National SAAC, which reports directly to that division’s
respective Management Council (NCAA SAAC, 2002). Further NCAA legislation has created
conference and campus-mandated SAACs, the purpose of which are to better represent the views
of all student-athletes.
Along with the creation of the Student-Athlete Advisory Committee, the NCAA
mandated another way for athletes to have a voice and institutions to gather
student-athlete input: student-student-athlete exit interviews.
Exit Interviews
The concept of the exit interview originated in business and the majority of research
comes from that industry. The exit interview is a discussion between a representative of an
organization and a person whose employment with that organization has been ended (Giacalone
& Duhon, 1991). Exit interviews have been used by companies since the 1950’s (Brooks, 2007).
The exit interview enables an improved understanding of the reasons why employees leave and
they provide opportunities for effective communication (Neal, 1989). Exit interviews have been
found to be usefulness as a means of creating better public relations, checking on the soundness
of initial selection procedures, and uncovering poor personnel practices, specific sources of job
12
The two major elements of the exit interview are (1) discovery and (2) communication
(Neal, 1989). Discovery is in the form of an employee’s motivation for vacating a certain
position. Communication consists of the sharing of this information with management personnel;
neither element is easy to deal with (Neal, 1989). Critical to the success of an exit interview is
the structure and content of the contact with the departing employee. Key elements are the clear
assignment of responsibility for conducting the interviews, effective scheduling procedures, the
creation of the proper climate for the interview and a productive format (Neal, 1989). A
commitment of sufficient time and appropriate staff for dialogue, analysis, and feedback is also
essential (Neal, 1989). Topics covered during exit interviews are varied and may be different for
every company. These topics may include, but are not limited to, reason for departure, rating of
the job, supervision, working conditions, advancement opportunities, training, pay, and things
employees like best (and least) about the job (Giacalone & Duhon, 1991). Some organizations
have even found it effective to distribute a pre-interview questionnaire or survey, and use the
information as a guide for the interview discussion (Neal, 1989). Regardless of the structure of
the exit interview, it should always include four basic elements:
(1) A diagnosis function
(2) A therapy/improvement function
(3) A separation assistance function
(4) A determination of reasons for leaving function (Neal, 1989).
Numerous studies have analyzed the importance of who is conducting the exit interview.
According to Neal (1989), exit interviews should be conducted by an individual, preferably a
personnel or human resources professional, who is knowledgeable about the work of the
13
interviewing, and who is trusted by the employees. Credibility and approachability are essential
qualities (Neal, 1989). Giacalone and Duhon (1991) further this point by stating that the exit
interview should be conducted by someone who is perceived as neutral. A staff member from the
personnel department is generally a better choice than a supervisor or manager. Previous studies
have showed that employees are likely to be more open in their comments when speaking on a
confidential basis with someone with whom they have had previous contact with, such as a
member of the personnel staff (Goodale, 1982; Giacalone & Duhon, 1991). More recently,
Branham (2005) found that exit interviews are most successful when conducted by a third-party
vendor. A third-party vendor provides a confidential, nonbiased, skilled approach to obtaining
exit interview data (Branaham, 2005). Regardless, it is clear that there is a necessity for extensive
training in interviewing techniques for those whose responsibility it is to conduct exit interviews
(Lefkowitz & Katz, 1969).
Perhaps the single most important concept relevant to all aspects of the exit interview
survey (EIS) process is the level of accuracy or honesty of the answers provided by those
participating in the interview. A consistent concern with the EIS process has focused on the
likelihood of obtaining truthful, comprehensive information from the interviewee (Knouse &
Beard, 1996). A major threat to the value of exit information has always been the omnipresent
threat of interviewee lying and distortion (Giacalone & Duhon, 1991).
Working from earlier research from Hinrichs (1975) and Zarandona & Camuso (1985),
Giacalone and Knouse (1989) identified five areas that may lead to interviewee distortion:
(1) Interviewees often make personal considerations a priority.
(2) Interviewees who are forced to exit may resent the organization.
14
(4) Interviewees may attempt to protect long-term interests.
(5) Interviewees may provide erroneous information because they do not
have time or incentive to think through how they feel.
In a 1991 study with ninety-nine graduate students seeking a Master’s degree in business
administration who were also working full-time in the Rhode Island-Massachusetts area,
Giacalone and Duhon found that when meeting with a personnel manager for an exit interview at
the end of their job tenure, employees may choose not to express their honest appraisal of certain
topics. The likelihood of answer distortion decreased in managerial ranks, compared with
nonmanagerial positions (Giacalone & Duhon, 1991). In 1997, Giacalone and Knouse completed
a follow-up study focused on motivation for and prevention of honest responding in exit
interviews. The study identified three factors that motivate honest responding in EIS: (1) positive
equity, (2) capricious and self-oriented reasons, (3) negative equity (Giacalone & Knouse, 1997).
The results of the study suggest that different types of EIS may be appropriate for different types
of organizations. For a company with a strong, positive work climate, a direct interview at the
time of separation may deliver honest responses. For a company with a negative climate,
however, an interview given by a neutral third party may be more effective (Giacalone &
Knouse, 1997). Finally, their study suggests the implementation of a long-term project, wherein
the company conducts random follow-up interviews with previous employees. Comparing those
answers to responses given at exit time, would allow companies to quantify the degree of bias
(Giacalone & Knouse, 1997).
With a lack of research conducted regarding student-athlete exit interviews, athletic
departments must utilize the data presented in the preceding studies. Regardless of employing a
15
critical for those staff members who are conducting the student-athlete exit interviews. The
coupling of face-to-face interviews and exit interview surveys appear to have the potential to
yield the best results for athletic departments. This study builds upon the literature presented in
this section, by examining the methods of conducting student-athlete exit interviews currently
used by Division-I FBS institutions.
Theoretical Framework
The theoretical foundation for this study is based upon institutional theory. Institutional
theory postulates that organizations, like individuals, seek approval or legitimacy from their
peers (Cooper & Weight, 2011). Therefore, organizations tend to behave in ways that are
consistent with the actions and orientations of the organizations within their institutional sphere.
An important element of institutional theory proposes that organizations within the same social
system are influenced by one another, and tend to imitate one another (DiMaggio & Powell,
1983; Cooper & Weight, 2011). DiMaggio and Powell (1983) defined the process of
organizations becoming similar to one another as “institutional isomorphism.” The theory of
institutional isomorphism further postulates that actors occasionally may forsake their own best
interests in order to follow established institutional logic and mirror the actions of their peers.
Rather than risk untested, potentially beneficial behavior, actors will behave in established ways
as a means of exuding legitimacy and avoiding criticism (DiMaggio & Powell, 1983).
DiMaggio and Powell (1983) suggested three potential, but not theoretically or
empirically distinct, sources of isomorphism: (1) Coercive isomorphism, which stems from an actor’s need to gain legitimacy; (2) Mimetic isomorphism, by which actors reduce perceived
16
another in determining how best to structure complex, professionalized organizations. It appears
conceivable, if not likely, that at least one of these processes could explain the logic behind
current methods being used by athletics departments to conduct their student-athlete exit
interviews.
The concept of isomorphism has been well researched within the sport management
literature (Washington & Patterson, 2010). Slack and colleagues (Amis, Slack, & Hinings, 2004;
Danisman, Hinings, & Slack, 2006; Slack & Hinings, 1994) have published numerous studies
examining the changes in a variety of National Sport Organizations (NSOs) that are a part of
Sport Canada. Slack and Hinings (1994), for example, examined the impact on changes to 36
NSOs as a result of institutional pressure from Sport Canada. They found that as Sport Canada
has created pressures for NSOs to adopt a more professional bureaucratic structure, there was a
reduction in the variations of NSO structures. Similar to other institutional theory studies, Slack
and Hinings (2006) provided a discussion of the impact of the three different types of
institutional pressures and how they contributed to this reduction in NSO structures.
The isomorphism hypothesis in institutional theory has also been used to explain the
relationship between US state political ideology and the distance between the women’s golf tees and the men’s tees (Arthur, Van Buren, & Del Campo, 2009), the increasing formalization within
a Canadian amateur ice hockey organization (Stevens & Slack, 1998), the low percentage of
black coaches in the NCAA (Cunningham, Sagas, & Ashley, 2001), the relationship between the
status of soccer clubs in the English Premier League and their website design (Lamertz, Carney,
& Bastien, 2008), the relationship between State sport Policy in Norway, and similarity of goals
17
Phelps and Dickson (2009) examined the naming choices of the New Zealand Men’s and
Women’s Ice Hockey clubs. They found that both clubs drew upon the legitimacy of the All
Black’s Rugby club and the Fern as the national flower to name their club. They suggest this
finding argues that isomorphism (in this case, naming conventions) leads to legitimacy (in this
case, social support for women and men’s ice hockey). Indeed, similar to the pronouncements
made by Mizruchi and Fein (1999) and Dacin et al. (2002), the isomorphism hypothesis of
institutional theory has been well researched in the sport management literature (Washington &
Patterson, 2010).
In 2011, Cooper and Weight tested the theory of institutional isomorphism in an attempt
to explain the actions of athletic administrators in regards to the value of and cutting of Olympic
sports. Cooper and Weight (2011) specifically looked at normative isomorphism and its idea that
all organizations act similarly due to the values and processes adopted by decision makers. College athletic administrators, or “decision makers,” most likely have been trained and educated
within organizations and universities who use and promote analogous methods and strategies
(Cooper & Weight, 2011). The values and beliefs that have been engrained in them as a result of
this will be reflected in the structures and processes these administrators institute within their
respective organizations (Cooper & Weight, 2011). After surveying a sample of administrators
from the Division I, II, and II level, Cooper and Weight found that the small standard deviations
and clear agreement the athletic directors demonstrated in highly valuing Olympic sport
academics supports the theory of institutional isomorphism (Cooper & Weight, 2011).
When Bylaw 6.3.2 was adopted in 1991, the NCAA did not stipulate proper policies and
procedures for conducting student-athlete exit interviews. Without standard procedures,
18
that the structure the other school is using is beneficial; especially schools that simply conduct
exit interviews to comply with NCAA Bylaws. Mimetic isomorphism can explain this
phenomenon. Mimetic isomorphism occurs most often when an organizations goals or means of
achieving such goals are unclear (DiMaggio & Powell, 1983).
Coercive isomorphism may also have an effect on the policies and procedures schools
use to conduct student-athlete exit interviews. Administrators may feel pressure from the other
members of their conference or geographic region to implement certain procedures when
conducting exit interviews. According to DiMaggio & Powell (1983), organizations are
increasingly homogenous within given domains and increasingly organized around rituals of
conformity to wider institutions. Therefore, schools tend to conform how they handle situations,
student-athlete exit interviews being an example of said situations, within the domain of an
19 CHAPTER III METHODOLOGY
Subjects
The population for this study was athletic administrators who are responsible for
administering student-athlete exit interviews at the one hundred twenty-eight Division I Football
Bowl Subdivision schools (125 full-time member institutions and 3 transitional institutions).
There were no sampling methods used for this study.
Instrumentation & Data Collection
Due to the nature of this study, it was necessary to develop an instrument specific to the
research questions addressed. The survey instrument utilized in this study was compiled based on
a thorough, foundational review of literature. A panel of experts was assembled to consult in the creation of the survey and compile relevant questions to address the study’s specific research
questions. This panel included two University of North Carolina at Chapel Hill Sport
Administration professors, both of whom are former intercollegiate student-athletes, and a
former Division I Director of Athletics. In addition, a specialist in survey methodology from the University of North Carolina at Chapel Hill’s Odom Institute for Research in Social Science was
consulted to facilitate additional validity of the survey instrument. Prior to releasing the survey, a
20
Each subject received a link to the survey via e-mail. E-mails were sent to the Athletic
Directors at each Division I FBS institutions with instructions to forward on the survey to the
administrator most responsible for conducting student-athlete exit interviews. E-mail addresses
for the Athletic Directors were retrieved from the institutions’ athletic websites. Subjects
completed the survey online using a program called Qualtrics. Each question on the survey
pertains to at least one of the five stated research questions. Likert scale questions, multiple choice, “check all that apply” and open-ended questions were used for the survey.
Data Analysis
Due to a relatively small N, the quantitative data collected from the completed surveys
was simply entered into frequency tables and analyzed using descriptive statistics. No statistical
tests were run on the qualitative data because results would have been inconclusive. The
21 CHAPTER IV
RESULTS
Demographics
The 26 survey respondents (20% of the population) represented nine athletic conferences
from 19 different states, which stretched across 5 distinct geographic regions. The number of
intercollegiate sports offered at the institutions represented by the survey respondents had a mean
of 16.48 ranging from 12 to 27. Athletic department total budgets for survey respondents had a
mean of M = $52,080,053 and ranged from slightly over $16,000,000 to over $110,000,000.
Overall, the demographics reflected a representative sample of the population.
Current method of conducting student-athlete exit interviews
Table 1 below displays the responses to the first survey question, which asked
respondents to select which method(s) they are currently using to conduct student-athlete exit
interviews. The question offered an option to select all that applied, in the event that the
institution used more than one method to conduct their student-athlete exit interviews. All 26
respondents answered the question, and at 77%, face-to-face interview was the most commonly
selected answer (n = 20). Over half of the respondents (54%, n = 14) also indicated they use
online surveys to conduct exit interviews and 27% (n = 7) use paper surveys. Focus groups are
the least used method at 8% (n = 2). The survey offered an “Other, please list” option, and one
22
interviews. Instead of reporting that as “Other,” an additional tally was added to each of the
respective categories.
Fifteen institutions selected multiple options, meaning their athletic departments use
multiple methods to conduct exit interviews with student-athletes. The 3rd and 4th columns of
Table 1 indicate the schools that only selected one option. Six of 26 schools (23%) use
face-to-face interviews, only three schools (12%) use online surveys only, and nearly 10% of schools (n
= 2) use paper surveys online. No institutions use only focus groups to conduct their exit
interviews.
Table 1
S-A Exit Interview Method Total Usage Stand Alone Usage
% n % n
Face-to-Face Interview 77% 20 23% 6
Online Survey 54% 14 12% 3
Paper Survey 27% 7 8% 2
Focus Group 8% 2 0% 0
N = 26
The following four tables display the data from follow up questions to the responses listed from Question 1, “What methods does your academic institution currently use to conduct
student-athlete exit interviews?” For every method that a respondent selected, a drop down
question appeared, asking them who is responsible for the oversight and carrying out of that
specific method. Table 2 displays the data for those respondents who selected that their athletic
department uses face-to-face interviews to conduct exit interviews. Similar to the previous
question regarding their methods, this question gave respondents the opportunity to check all
23
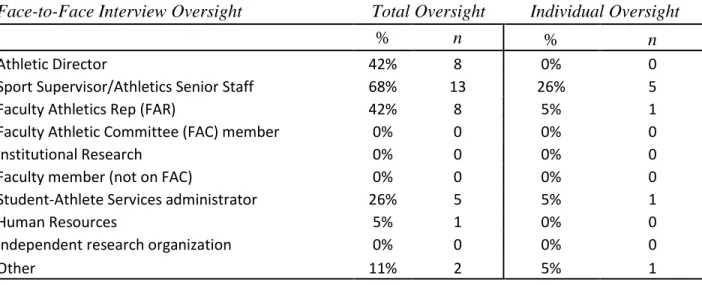
Face-to-Face Interviews was the most common method to conduct student-athlete exit
interviews (N = 20). Table 5 below displays the data for who oversees the interviews at those
schools that use the face-to-face interview method (Table 5 shows N = 19 because, similar to
Table 2, one institution did not receive a follow-up Question 5 because of the way they answered Question 1 with “Other” rather than checking multiple methods). Sport Supervisor/Athletics
Senior Staff oversaw the majority of the face-to-face interviews (68%). Both Athletic Director
and FARs were the next most-selected, each representing 42% of respondents (n = 8).
Student-Athlete Services administrator had the next highest percentage, just over one-fourth of
respondents (26%). Two institutions selected “Other,” one indicating that their Senior Woman
Administrator (SWA) has oversight of the face-to-face interview, and the other indicating that the university’s Intercollegiate Athletic Committee handles the face-to-face exit interviews. The
4th column in Table 5 shows that 8 institutions have only one person, who is given individual
oversight of the face-to-face interviews. Sport Supervisors are again the highest percentage (n =
5, 26%). The three other institutions with one person or group conducting face-to-face interviews
use the FAR (n = 1), Student-Athlete Services administrator (n = 1), and Other, which they later
24 Table 2
Face-to-Face Interview Oversight Total Oversight Individual Oversight
% n % n
Athletic Director 42% 8 0% 0
Sport Supervisor/Athletics Senior Staff 68% 13 26% 5
Faculty Athletics Rep (FAR) 42% 8 5% 1
Faculty Athletic Committee (FAC) member 0% 0 0% 0
Institutional Research 0% 0 0% 0
Faculty member (not on FAC) 0% 0 0% 0
Student-Athlete Services administrator 26% 5 5% 1
Human Resources 5% 1 0% 0
Independent research organization 0% 0 0% 0
Other 11% 2 5% 1
N = 19
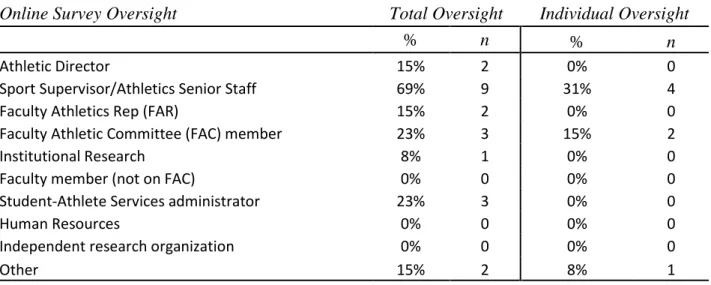
Table 3 below displays the data for institutions currently using online surveys, the second
most popular method for conducting exit interviews, according to the survey. Thirteen people (N
= 13) responded to Question 2 about online survey oversight, which is one less than Table 1
indicates use online surveys (This disparity comes from a survey respondent manually writing in
two choices, rather than checking all that apply, and thus not receiving any of the follow-up
questions 2-5). Sport Supervisor/Athletics Senior Staff was the overwhelmingly most popular
choice (69%, n = 9). Faculty Athletic Committee member and Student-Athlete Services
administrator were selected by nearly one-fourth (23%) of respondents. Athletic Director,
Faculty Athletics Rep (FAR), and Other were each selected twice (15%) and Institutional
Research once (8%). The 3rd and 4th columns show that just under half of the schools use
multiple people to oversee the distribution and analysis of the electronic survey exit interview.
Seven of the schools using online surveys only have one person overseeing those surveys, with
25 Table 3
Online Survey Oversight Total Oversight Individual Oversight
% n % n
Athletic Director 15% 2 0% 0
Sport Supervisor/Athletics Senior Staff 69% 9 31% 4
Faculty Athletics Rep (FAR) 15% 2 0% 0
Faculty Athletic Committee (FAC) member 23% 3 15% 2
Institutional Research 8% 1 0% 0
Faculty member (not on FAC) 0% 0 0% 0
Student-Athlete Services administrator 23% 3 0% 0
Human Resources 0% 0 0% 0
Independent research organization 0% 0 0% 0
Other 15% 2 8% 1
N = 13
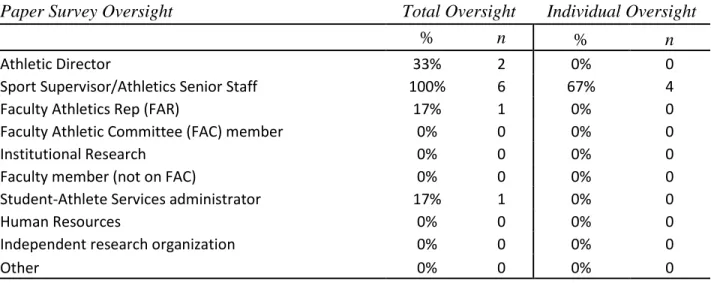
Table 3 below displays the data for the oversight of paper surveys. Check all that apply
was once again the option for this question. All 6 respondents (100%) answered that their paper
survey exit interviews are handled by Sport Supervisors. One-third (n = 2) of the respondents indicated that their school’s Athletic Director oversees the paper survey and Student-Athlete
Services administrator and FAR were each chosen once (17%). Four of the six institutions that
currently use paper surveys to conduct student-athlete exit interviews only use one individual to
oversee the surveys, as indicated by Columns 3 and 4 of Table 3. For each of the four schools
that do not have multiple people overseeing the paper survey process, it is the specific Sport
26 Table 4
Paper Survey Oversight Total Oversight Individual Oversight
% n % n
Athletic Director 33% 2 0% 0
Sport Supervisor/Athletics Senior Staff 100% 6 67% 4
Faculty Athletics Rep (FAR) 17% 1 0% 0
Faculty Athletic Committee (FAC) member 0% 0 0% 0
Institutional Research 0% 0 0% 0
Faculty member (not on FAC) 0% 0 0% 0
Student-Athlete Services administrator 17% 1 0% 0
Human Resources 0% 0 0% 0
Independent research organization 0% 0 0% 0
Other 0% 0 0% 0
N = 6
Table 5 shows who has oversight of the focus group at schools that use that method to
conduct their student-athlete exit interviews. Only two respondents indicated that their athletic
department uses focus groups to conduct student-athlete exit interviews. In each case, there is
one individual, or group of individuals, that is responsible for the oversight of the focus group.
One institution selected “Faculty Athletic Committee” and the other selected “Other,” specifying that their “Athletic Council” oversee focus groups.
Table 5
Focus Group Oversight Total Oversight Individual Oversight
% n % n
Athletic Director 0% 0 0% 0
Sport Supervisor/Athletics Senior Staff 0% 0 0% 0
Faculty Athletics Rep (FAR) 0% 0 0% 0
Faculty Athletic Committee (FAC) member 50% 1 50% 1
Institutional Research 0% 0 0% 0
Faculty member (not on FAC) 0% 0 0% 0
Student-Athlete Services administrator 0% 0 0% 0
Human Resources 0% 0 0% 0
Independent research organization 0% 0 0% 0
Other 50% 1 50% 1
27 Reason for choosing current method
Respondents were asked, “Why did your department chose its current method for
conducting student-athlete exit interviews?” It then listed five options as well as a sixth option, “Other,” which allowed them to manually enter in their reason for choosing the method they use.
The most popular response was, “Developed internally by athletic department,” with over
three-fourths (77%) of respondents selecting it. “Recommended by NCAA” had the next highest
percentage (19%). “Recommended by athletic conference” and “Developed internally by
academic institution” were both chosen by 15% of respondents (n = 4) and “Other” was selected
3 times (12%). The three responses coupled with choosing “Other,” included (1) “Best practices
from other institutions and historical data,” (2) “Genuinely interested in seeking feedback,” and (3) “Used by the current AD for over 30 years.” As was the case with Tables 2-5, the last two
columns of Table 6 represent the institutions that selected only one reason for choosing their current method. Fifty percent of all respondents (n = 13) indicated their school’s reasoning for
choosing their exit interview method was developed internally by the athletic department. Six
other institutions indicated a one individual reason for choosing their method of conducting exit
interviews: Developed internally by academic institution (n = 3), Other – (1) and (3) from above
(n = 2), and Recommended by athletic conference (n = 1).
Table 6
Reason for Choosing Current Method Total Reasoning Individual Reasoning
% n % n
Recommended by NCAA 19% 5 0% 0
Recommended by athletic conference 15% 4 4% 1
Recommended by outside consultant 0% 0 0% 0
Developed internally by athletic department 77% 20 50% 13 Developed internally by academic institution 15% 4 12% 3
Other 12% 3 8% 2
28 Satisfaction level with current method
Participants were asked “How satisfied are you with your department’s current method(s)
of conducting student-athlete exit interviews?” They were asked to respond using a five-point
Likert scale: (1) very dissatisfied, (2) dissatisfied, (3) neutral, (4) satisfied, and (5) very satisfied.
The data in Table 7 below suggests that the majority of schools are content with their current
methods (M = 4.19, SD = 0.69). Eighty-five percent of respondents were either satisfied (n = 13,
50%) or very satisfied (n = 9, 35%) with their institutions current methods. 15% (n = 4)
respondents were neutral on how they felt towards their current methods. Zero respondents were
either dissatisfied or very dissatisfied.
Table 7
Current Method Satisfaction Level
% n
Very Dissatisfied (1) 0% 0
Dissatisfied (2) 0% 0
Neutral (3) 15% 4
Satisfied (4) 50% 13
Very Satisfied (5) 35% 9
N = 26 M = 4.19
SD = 0.69
Along with the aforementioned Likert scale question, respondents were asked what about
their current methods work well for their athletic department. The format of the question was
open-ended response. There were a total of 13 responses to this question. While each response
was unique to its own institution, there were a few identifiable themes. One such theme is that
the one-on-one interview is impactful. A face-to-face interview allows for candid feedback and a
more conversational atmosphere. A number of respondents also commented on how using
29
experiences and adds validity to the results. A third pattern that arose was that using multiple
people or committee to conduct the interviews worked well for schools. It allowed for academics
to have a part in the process, to really uncover the full student-athlete experience. It also avoids
putting the burden on one individual to oversee, organize, and analyze the results of every single
student-athlete exit interview.
As a follow-up to Question 12, Question 13 then asked respondents how their institutions
could improve their current method(s) for conducting student-athlete exit interviews. Responses
were again open-ended and there were a total of 11 responses. Once more, a number of
distinguishable themes emerged in the responses. The most discussed improvement was the
structure of the exit interview itself (n = 4). Respondents indicated a desire to increase the
amount of face-to-face interaction with student-athletes and administrators to conduct the
interviews (n = 3). Stressing the importance of the interviews to the student-athletes is also a
necessary improvement to the respondents (n = 2). Respondents also showed an aspiration to
include a wider range of administrators for the exit interviews. Frequency of interviews was also
discussed. Adding multiple per year or just once at the end of every academic year could
improve the results. And finally respondents expressed a desire to compile and utilize their
results more effectively.
Topics being discussed in student-athlete exit interviews
Question 8 asked respondents to list the topics that are being discussed in current
student-athlete exit interviews. They were given seven, check-all-that-apply, options, with an additional Other choice, in which they could specifically list the topics discussed that didn’t fall under
30
(100%) indicated that both “Overall athletic experience” and “Academic support provided by the athletic department” were topics discussed in current exit interviews. Twenty-five respondents
(96%) also checked that “Overall university experience” and “Professional behavior of coaching
staff” were topics discussed in exit interviews. “Athletic development support provided by the
athletic department” and “Overall academic experience” were each selected by twenty-four
respondents (92%), and Academic support provided by the institution was selected by 81% of
respondents (n = 21). Six respondents (23%) also selected “Other.” While each response that followed “Other” was different, there were a few topics that appeared more than once: “Strength
and Conditioning” (n = 3), “Sports Medicine” or “Athletic Training” (n = 3), and “Compliance”
(n = 2).
Table 8
Topics Being Discussed in S-A Exit Interviews Total Discussion
% n
Overall university experience 96% 25
Overall athletic experience 100% 26
Overall academic experience 92% 24
Academic support provided by the institution 81% 21
Academic support provided by the athletic department 100% 26 Athletic development support provided the athletic department 92% 24
Professional behavior of coaching staff 96% 25
Other 23% 6
N = 26
Reporting exit interview data
Question 9 asked, “How does your institution report the data collected from
student-athlete exit interviews?” Respondents were given three options: (1) “Written report,” (2) “Notes
taken and stored, but no results formally written,” and (3) “Other, please specify.” Sixteen
31
stored, but no results formally written.” “Written report” was selected by half of the respondents
(50%). As shown in column 4 of Table 9, the majority of institutions used only one method. Nine
institutions (35%) report their data only through written report, and nine institutions (35%) take and store notes without formally writing a report. Four institutions (15%) selected “Other,” with
three of those institutions (12%) selecting “Other” exclusively. Each response was unique (n = 1), and included: (1) “Specific major concerns will be investigated,” (2) “Approved requests,”
(3) “Reports per team and cumulative – looking for consistencies in data to improve future
student experience and development,” and (4) “Spreadsheet with comments – no names used,
sport may be listed;” the latter three being the ones used exclusively, without another reporting
method.
Table 9
Method of Reporting Data Total Reporting Individual Reporting
% n % n
Written report 50% 13 35% 9
Notes taken and stored, but results not formally written 62% 16 35% 9
Other 15% 4 12% 3
N = 26
Utilizing exit interview results
Question 10 asked respondents to indicate how their institutions utilize the results of the
information and data collected from student-athlete exit interviews. A total of 7 options were
listed, including Other with an option to specify. Twenty-four of twenty-six respondents (92%)
indicated that the results were for internal use by the athletic department. Forty-two percent of
respondents (n = 11) indicated that results were for internal use by the university. Fifty percent
of respondents (n = 13) indicated their results were for internal athletic department use only (as
32
interview results were for internal use by the university only. No respondents indicated that their
data was reported to the NCAA or the respective athletic conference. Also, no respondents indicated that their results were posted on the institution’s or athletic department’s websites.
Fifteen percent of respondents (n = 4) selected “Other,” however, none of them exclusively
chose that option, meaning they utilized results in multiple ways. These responses included
sharing the results with academic committees/councils and coaches.
Table 10
Utilization of Exit Interview Results Total Utilization Individual Utilization
% n % n
For internal use by university 42% 11 4% 1
For internal use by athletic department 92% 24 50% 13
Reported to NCAA 0% 0 0% 0
Reported to athletic conference 0% 0 0% 0
Posted annually on the institution's website 0% 0 0% 0 Posted annually on the athletic department's website 0% 0 0% 0
Other 15% 4 0% 0
N = 26
Question 11 asked respondents to use a 5-point Likert scale to indicate the level to which
the results from student-athlete exit interviews currently guide athletic department decisions. The
options were: (1) Not currently, never has in the past, (2) Not currently, but have in the past, (3)
Yes, to a minimal extent, (4) Yes, to a moderate extent, and (5) Yes, to a great extent. Table 11
below displays the results from Question 11. The average response was 4.00 (SD = 0.57).
Eighteen respondents (69%) selected option 4. Options 3 and 5 were each selected by 15% of
33 Table 11
Exit Interview Results Level of Guidance for Athletic Department Decisions
% n
Not currently, never has in the past (1) 0% 0
Not currently, but have in the past (2) 0% 0
Yes, to a minimal extent (3) 15% 4
Yes, to a moderate extent (4) 69% 18
Yes, to a great extent (5) 15% 4
N = 26 M = 4.00
SD = 0.57
Comparisons by geographical region and athletic department budget
After recording the results from each of the survey questions, further analysis was
completed to compare the respondents’ institutions by their geographic location and total athletic
department budget. Five distinct geographic regions were used: (1) Northwest, (2) Southwest, (3)
Midwest, (4) Southeast, and (5) Northeast. The following 5 tables show the responses to survey questions 1, 6, 7, 9, and 10. For each of these tables, all 26 respondents’ results were reported.
Under each column, N represents how many institutions belong to that geographic category.
Institutions were also broken down into 4 categories based on their 2013 athletic
department budget (Data collected from the 2013-2014 academic year via The Equity in
Athletics Data Analysis cutting tool). The ranges for the budgets were: (1)
$15,000,000-$29,999,999, (2) $30,000,000-$44,999,999, (3) $45,000,000-$74,999,999 and (4) $75,000,000+. In the following 5 tables below, the budgets are listed in $1,000’s and at the bottom of each
column, the N represents how many institutions fell into that range. For these tables, only 25
institutions were counted because there was no budget data for one of the respondents. Due to a
34
ranges as whole. Also, because of the small sample size, statistical calculations were not
conducted to determine significance between independent variables or budget and region. Tables 12 and 13 below shows the responses to Question 1, “What method(s) does your
academic institution currently use to conduct student-athlete exit interviews?” 100% of
respondents in the Northwest and Northeast use both face-to-face interviews and online surveys.
Midwest institutions had the highest percentage of paper survey usage (43%). Only two regions,
Southwest and Southeast, had schools that use focus groups to conduct their exit interviews.
The second budget range ($30,000,000-$44,999,999) is the only group of institutions in
which online survey (83%) had a higher percentage than face-to-face interviews (67%). The third
range ($45,000,000-$74,999,999) is the only group of institutions to not use paper surveys for
conducting student-athlete exit interviews. Only two budget ranges had schools that used focus
groups, confirming it as the least popular interview method listed.
Table 12
S-A Exit Interview Method Northwest Southwest Midwest Southeast Northeast
Face-to-Face Interview 100% 83% 71% 70% 100%
Online Survey 100% 50% 43% 50% 100%
Paper Survey 0% 17% 43% 30% 0%
Focus Group 0% 15% 0% 10% 0%
35 Table 13 S-A Exit Interview
Method
$15,000 - $29,999
$30,000 - $44,999
$45,000 - $74,999
$75,000 +
Face-to-Face Interview 71% 67% 83% 83%
Online Survey 29% 83% 67% 50%
Paper Survey 29% 17% 0% 50%
Focus Group 0% 17% 0% 17%
N = 25 N = 7 N = 6 N = 6 N = 6
*Budget listed in $1,000's
Table 14 and 15 display the results from Question 6. The Northeast region was the only
region in which, “developed internally by athletic department” wasn’t the response with the
highest percentage. 0 regions had institutions that reported that they chose their current method
based on a recommendation from an outside consultant. The Southeast schools appear to have
the most athletic conference influence because 30% of respondents in this region chose “recommended by athletic” conference, which was the highest of any region.
The $30,000,000-$44,999,999 range was the only group of institutions to have more than
1 school say that their reasoning for using their current method(s) was recommended by the
NCAA (n = 2). Interestingly, the $75,000,000 group of institutions had the lowest percentage of
schools claim their methods were developed internally by the athletic department (50%), but that
group had the highest percentage that were developed internally by the academic institution
(50%). In fact, of the other nineteen institutions outside the $75,000,000 range, only one school
36 Table 14 Reason for Choosing Current
Method Northwest Southwest Midwest Southeast Northeast
Recommended by NCAA 50% 17% 29% 10% 0%
Recommended by athletic conference 0% 0% 14% 30% 0%
Recommended by outside consultant 0% 0% 0% 0% 0%
Developed internally by athletic
department 100% 83% 86% 70% 0%
Developed internally by academic
institution 0% 0% 14% 30% 0%
Other 0% 17% 14% 0% 100%
N = 26 N = 2 N = 6 N = 7 N = 10 N = 1
Table 15 Reason for Choosing Current
Method $15,000 - $29,999 $30,000 - $44,999 $45,000 - $74,999 $75,000 +
Recommended by NCAA 14% 33% 17% 17%
Recommended by athletic
conference 14% 17% 17% 17%
Recommended by outside
consultant 0% 0% 0% 0%
Developed internally by athletic
department 86% 83% 83% 50%
Developed internally by academic
institution 14% 0% 0% 50%
Other 0% 0% 33% 17%
N = 25 N = 7 N = 6 N = 6 N = 6
*Budget listed in $1,000's
Question 7 was a Likert-scale question that surveyed respondents’ level of satisfaction with their institution’s current method(s) of conducting exit interviews. Tables 16 and 17 are
frequency tables showing how many respondents in each region and budget range selected each
of the five levels of satisfaction. None of the five regions had any respondents select
37
the satisfaction level for each region. Midwest respondents had the highest level of satisfaction
(M = 4.29, SD = 0.76), followed by Southeast (M = 4.20, SD = 0.63), Southwest (M = 4.17, SD
= 0.75), Northwest (M = 4.00, SD = 1.41), and Northeast (M = 4.00, SD = N/A).
Similar to the geographic regions, none of the four budget groups had any institutions select that they were “dissatisfied” or “very dissatisfied” with their current methods. The two
highest budget ranges had the highest level of satisfaction (M = 4.33), which is a greater mean
than any of the 5 regions had. The lowest budget range had a mean of 4.14 (SD = 0.69) and the
$30,000,000-$44,999,999 range had the lowest mean of 4.00 (SD = 0.89).
Table 16
Current Method Satisfaction Level Northwest Southwest Midwest Southeast Northeast
Very Dissatisfied (1) 0 0 0 0 0
Dissatisfied (2) 0 0 0 0 0
Neutral (3) 1 1 1 1 0
Satisfied (4) 0 3 3 6 1
Very Satisfied (5) 1 2 3 3 0
N = 26 N = 2 N = 6 N = 7 N = 10 N = 1
M = 4.00 M = 4.17 M = 4.29 M = 4.20 M = 4.00
SD =1.41 SD = 0.75 SD = 0.76 SD = 0.63 SD = N/A
Table 17 Current Method Satisfaction
Level $15,000 - $29,999 $30,000 - $44,999 $45,000 - $74,999 $75,000 +
Very Dissatisfied (1) 0 0 0 0
Dissatisfied (2) 0 0 0 0
Neutral (3) 1 2 0 1
Satisfied (4) 4 2 4 2
Very Satisfied (5) 2 2 2 3
N = 25 N = 7 N = 6 N = 6 N = 6
38
The following tables (Table 18 & 19) display the percentage of respondents in each
region and budget range to the question asking the method in which their institutions report data
collected from student-athlete exit interviews. The Midwest region was the only region in which “notes taken and stored, but results not formally written” had a higher percentage than “written
report.” Four out of six schools (67%) in the Southwest report their data using written reports,
giving that region the highest percentage of written reports.
The $45,000,000-$74,999,999 budget range was the only group to have zero schools
select that they report the findings and results of their exit interview data via a formal written
report. The highest budget range ($75,000,000+) had the highest percentage of schools write
formal reports (67%) and the lowest percentage of schools that take and store notes, but not write
anything formal (33%).
Table 18
Method of Reporting Data Northwest Southwest Midwest Southeast Northeast
Written report 50% 67% 43% 50% 0%
Notes taken and stored, but
results not formally written 50% 33% 86% 40% 0%
Other 50% 0% 0% 20% 100%
N = 26 N = 2 N = 6 N = 7 N = 10 N = 1
Table 19
Method of Reporting Data $15,000 -
$29,999 $30,000 - $44,999 $45,000 - $74,999 $75,000 +
Written report 29% 50% 0% 67%
Notes taken and stored, but results not
formally written 71% 33% 83% 33%
Other 14% 17% 33% 17%
N = 25 N = 7 N = 6 N = 6 N = 6
39
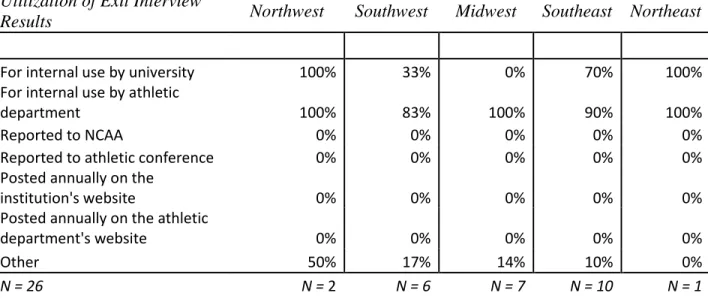
Finally, Tables 20 & 21 shows how the different regions and budget ranges utilize the
results of their student-athlete exit interviews. For each of the five regions, “for internal use by the athletic department” had the highest percentage. The Midwest region was the only region to
have zero institutions select that results were for internal use by the university. Zero regions
listed that they report their results to the NCAA or their respective athletic conferences. Also,
zero regions reported that their institutions annually post exit interview results on their school
and athletic department website.
The lowest budget range ($15,000,000-$29,999,999) had the lowest percentage of
schools report that results are used for internal use by the university (14%). The second budget
range was the only group to not have 100% of its institutions select that exit interview results
were utilized for internal use by athletic department. Similar to the five geographic reasons, no
schools report their results to the NCAA, their respective athletic conferences, or post them on either their academic institution’s website, or their athletic department’s website.
Table 20 Utilization of Exit Interview
Results Northwest Southwest Midwest Southeast Northeast
For internal use by university 100% 33% 0% 70% 100%
For internal use by athletic
department 100% 83% 100% 90% 100%
Reported to NCAA 0% 0% 0% 0% 0%
Reported to athletic conference 0% 0% 0% 0% 0%
Posted annually on the
institution's website 0% 0% 0% 0% 0%
Posted annually on the athletic
department's website 0% 0% 0% 0% 0%
Other 50% 17% 14% 10% 0%
40 Table 21
Utilization of Exit Interview Results $15,000 -
$29,999
$30,000 - $44,999
$45,000 - $74,999
$75,000 +
For internal use by university 14% 67% 33% 67%
For internal use by athletic department 100% 67% 100% 100%
Reported to NCAA 0% 0% 0% 0%
Reported to athletic conference 0% 0% 0% 0%
Posted annually on the institution's
website 0% 0% 0% 0%
Posted annually on the athletic
department's website 0% 0% 0% 0%
Other 0% 50% 17% 0%
N = 25 N = 7 N = 6 N = 6 N = 6