Social Support, Simpatía, and Hypertension Prevalence in
Hispanics/Latinos: Findings from the HCHS/SOL Sociocultural
Ancillary Study
Erin L. Merz1, Scott C. Roesch2, Vanessa L. Malcarne2, Frank J. Penedo3, Gregory A. Talavera2, Sheila F. Castañeda2, Martha L. Daviglus4, Aida L. Giachello3, Franklyn Gonzalez II5, Krista M. Perreira5, Liliana A. Ponguta6, and Linda C. Gallo2
1California State University, Dominguez Hills 2San Diego State University
3Northwestern University 4University of Illinois at Chicago
5University of North Carolina at Chapel Hill 6Albert Einstein College of Medicine
Abstract
There is a significant burden of hypertension in the United States, which extends to the large and growing Hispanic/Latino population. Previous literature suggests that psychosocial factors are related to hypertension in Hispanics/Latinos. However, cultural factors unique to this population have been largely understudied in this context. The purpose of the current investigation was to examine the association of hypertension prevalence with social support and simpatía, a Hispanic/ Latino cultural value emphasizing social harmony. Cross-sectional data from 5,313 adult
Hispanics/Latinos, age 18 to 75 years, representing multiple heritage groups were collected as part of the Hispanic Community Health Study/Study of Latinos Sociocultural Ancillary Study.
Contrary to predictions, higher social support was related to higher odds of hypertension prevalence across models (OR = 1.11, 95% CI: 1.02, 1.22). In the final main effects logistic regression model, higher simpatía was related to lower odds of hypertension (OR = .83, 95% CI: . 77, .90). Sex modified the link between simpatía and hypertension, with significant effects for men but not women. A 1 SD increase in simpatía was associated with 36% lower odds of hypertension in Hispanic/Latino men. The findings suggest that social support was inversely related with hypertension prevalence and that simpatía may be a protective cultural characteristic in relation to hypertension in the Hispanic/Latino population, but only in men. These results contribute to a growing discourse about the role of Hispanic/Latino cultural values in cardiovascular health.
Keywords
social support; simpatía; hypertension; blood pressure; Hispanic/Latino
HHS Public Access
Author manuscript
J Lat Psychol
. Author manuscript; available in PMC 2017 August 11.Published in final edited form as:
J Lat Psychol. 2016 August ; 4(3): 131–141. doi:10.1037/lat0000047.
A
uthor Man
uscr
ipt
A
uthor Man
uscr
ipt
A
uthor Man
uscr
ipt
A
uthor Man
uscr
Hypertension affects approximately one-third of U.S. adults and is a risk factor for coronary heart disease and stroke (Go et al., 2013). The literature is replete with data demonstrating that hypertension prevalence varies by race/ethnicity, with non-Hispanic/Latino Blacks (women: 47.0%, men: 42.6%) having a higher burden than non-Hispanic/Latino Whites (women: 30.7%, men: 33.4%; Go et al., 2013). Recent findings from the Hispanic Community Health Study/Study of Hispanics/Latinos (HCHS/SOL) suggest that among Hispanics/Latinos, 23.5% of women and 25.4% of men are hypertensive (Daviglus et al., 2012). Although Hispanics/Latinos are the largest and fastest growing ethnic group in the U.S. (Ennis et al., 2011), few investigations have evaluated factors associated with hypertension in this population.
Numerous demographic (Go et al., 2013) and behavioral risk factors (Huai, Xun, Reilly, Wang, Ma, & Xi, 2013; Sesso, Cook, Buring, Manson, & Gaziano, 2008; Virdis,
Giannarelli, Neves, Taddei, & Ghiadoni, 2010) for hypertension have been identified over decades of research. Psychosocial factors also contribute to hypertension risk (Cuffee, Ogedegbe, Williams, Ogedegbe, & Schoenthaler, 2014) through influences on the sympathetic nervous system, hypothalamic-pituitary-adrenal axis, and the release of glucocorticoids and catecholamines into the bloodstream. Social support is a particularly relevant psychosocial resource in the context of hypertension, given its wide recognition as being protective against poor cardiovascular outcomes (Chida & Hamer, 2008; Uchino, Bowen, Carlisle & Birmingham, 2012). There have been only a few studies on this topic in Hispanics/Latinos, despite a strong cultural emphasis on social support in traditional Hispanic/Latino culture (Almeida, Molnar, Kawachi, & Subramanian, 2009; Caplan, 2007). Using data from the 2001–2006 National Health and Nutrition Examination Survey, Bell, Thorpe, and Laveist (2010) found that Mexican Americans with high emotional and financial social support had lower hypertension prevalence. Another study suggested that low family social support related to higher systolic and diastolic blood pressure in Mexican American men but not women (McClure et al., 2010). Conversely, one study reported that whereas social support is inversely related to hypertension in non-Hispanic/Latino Whites, the relationship was not significant for Hispanics/Latinos (Tomaka, Thompson, & Palacios, 2006). Another study found that Mexican American women living with three or more people were more likely to be hypertensive than those who lived alone (33% vs. 70%; Gorman & Porter, 2011).
Cultural values related to Hispanic/Latino social life may be relevant to hypertension prevalence in this population. Several studies have demonstrated that Hispanic/Latino values such as familism relate to physical health outcomes including birthweight (Campos, Dunkel-Schetter, Abdou, Hobel, Glynn, & Sandman, 2008) and asthma (Abdou, Dominguez, & Myers, 2013). Despite the hypothesis that cultural norms regarding social interactions may partly explain some Hispanic/Latino health advantages, no study has evaluated cultural ideals about social relationships in relation to blood pressure (Jasso, Massey, Rosenzweig, & Smith, 2004). Simpatía, a Hispanic/Latino cultural value emphasizing social harmony, conflict avoidance, and acquiescence (Triandis, Marin, Lisansky, & Betancourt, 1984), may be relevant to understanding hypertension. There is no English equivalent to the term simpatía (Triandis et al., 1984), but it can be characterized by concepts such as
agreeableness and politeness (Ramírez-Esparza, Gosling, & Pennnebaker, 2008), and has
A
uthor Man
uscr
ipt
A
uthor Man
uscr
ipt
A
uthor Man
uscr
ipt
A
uthor Man
uscr
shown modest relationships with other Hispanic/Latino cultural values such as respect (Yu, Lucero-Liu, Gamble, Taylor, Christensen, & Modry-Mandell, 2008) and familism (Gamble & Modry-Mandell, 2008). Simpatía has been studied in the context of substance treatment (Griffith, Joe, Chatham, & Simpson, 1998) and family relationships (Gamble & Modry-Mandell, 2008; Yu et al., 2008; Sotomayor-Peterson, Cabeza De Baca, Figueredo, & Smith-Castro, 2013), but not in relation to physical health outcomes. In the absence of such data, studies of agreeableness may be used to inform hypotheses regarding the health implications of simpatía. The literature has focused primarily on non-Hispanic/Latino Whites, but suggests that being more agreeable predicts lower blood pressure (D’Antono, Ditto, Moskowitz, & Rios, 2001; Miller, Cohen, Rabin, Skoner, & Doyle, 1999; van Reedt
Dortland, Giltay, van Veen, Zitman, & Penninx, 2012). However, one recent investigation on negative social interactions and hypertension in older adults included agreeableness as a covariate, given that it was related to increased hypertension risk (b = 0.38, p = .03; Sneed & Cohen, 2014).
The purpose of the current study was to extend the sociocultural understanding of hypertension in Hispanics/Latinos. The primary aim was to examine the relationships of social support and simpatía with hypertension status after accounting for standard covariates (sociodemographic characteristics and health risks/behaviors). It was predicted that higher social support and simpatía would be associated with lower rates of hypertension.
Exploratory analyses were conduced to test the interaction of social support and simpatía on hypertension prevalence, and to examine sex as a moderator of social support and simpatía on hypertension prevalence.
Method
The current study was based on data from the Hispanic Community Health Study/Study of Latinos (HCHS/SOL) Sociocultural Ancillary Study (N = 5,313). The HCHS/SOL (N = 15,079) is a multi-site cohort study designed to evaluate the prevalence, incidence, and risk factors for chronic diseases among Hispanics/Latinos. Participants were recruited from four field centers (Miami, FL; San Diego, CA; Bronx, NY; Chicago, IL). The sampling strategy (LaVange et al., 2010) and approach (Sorlie et al., 2010) are detailed elsewhere. Participants attended a baseline visit with physical exam and interview-administered surveys. Study visits took place in the morning. Participants were asked not to perform physical activity on the morning of the exam, and to fast and refrain from smoking for at least 12 hours. Participants were asked to bring in all medications, which were barcode scanned or
transcribed and coded manually. Height and weight were measured in light clothing without shoes in the standing position to the nearest .01 cm and .1 kg, using a standard wall-mounted stadiometer and calibrated digital scale, respectively. Three seated blood pressure readings were obtained using an automatic sphygmomanometer following a 5-minute rest.
Approximately one-third of the cohort attended a separate visit for the HCHS/SOL
Sociocultural Ancillary Study, which entailed an assessment of socioeconomic, cultural, and psychosocial factors (Gallo et al., 2014). Recruitment for the ancillary study began during the second wave of parent study enrollment and all HCHS/SOL participants were eligible if they were able and willing to complete a second visit within nine months of the parent study
A
uthor Man
uscr
ipt
A
uthor Man
uscr
ipt
A
uthor Man
uscr
ipt
A
uthor Man
uscr
exam; 72.6% of the 7,321 parent study participants attempted for contact participated. The sample is considered a representative sub-sample of HCHS/SOL participants, with the exception that participation was lower in some higher socioeconomic strata (Gallo et al., 2014). Assessments were administered by interview and included the measures of social support and simpatía used in the current study. Standardized reviews of randomly selected interview voice recordings were conducted periodically to ensure fidelity of protocol implementation and accuracy of instrument delivery. Participants were compensated $60 for their time and effort. Institutional Review Board approval was attained from all sites for all HCHS/SOL and ancillary study procedures. All participants provided written informed consent.
Measures
Hypertension—The second and third blood pressure readings were averaged to indicate systolic and diastolic blood pressure (SBP; DBP). Hypertension was defined according to Joint National Committee on Prevention, Detection, Evaluation, and Treatment of High Blood Pressure-VII criteria (Chobanian et al., 2003) as any of the following: average measured SBP ≥ 140 mmHg, or DBP ≥ 90 mmHg, or use of antihypertensive medications.
Social Support—The 12-item version of the Interpersonal Support Evaluation List (ISEL-12; Cohen, Mermelstein, Kamarck, & Hoberman, 1985) was used. Respondents rate their perceived social support on a four-point scale ranging from definitely false to definitely true. The total score, representing overall perceived social support (range: 0–36; higher scores indicate greater support) was used and has been validated in the current sample (Merz
et al., 2014). Internal consistency was α = .818 (Spanish α = .804, English α = .857).
Simpatía—The 10-item version (Sotomayor-Peterson, Figueredo, Christensen, & Taylor, 2012; Sotomayor-Peterson et al., 2013) of the Texas Christian University Simpatía Scale (Griffith et al., 1998) was used. Respondents evaluate the importance they place on different aspects of simpatía on a five-point scale ranging from not important to extremely important. Scores range from 0 to 40; higher scores indicate greater simpatía. In this sample, a 1-factor
structure fit well overall and structural measurement invariance1 was established across
Spanish and English languages. Internal consistency was α = .751 (Spanish α = .751,
English α = .766).
Sociodemographics—Variables included age, sex, self-identified Hispanic/Latino heritage, marital status, income, highest level of education, the number of years living in the U.S., and nativity. The language in which a participant chose to complete the interview for the HCHS/SOL Sociocultural Ancillary Study determined Spanish or English preference.
Health Risks/Behaviors—BMI was calculated as weight in kg/height in m2 and categorized according to the National Heart Lung and Blood Institute (1998) criteria as underweight (< 18.5), normal weight (18.5–25), overweight (25–30), obese I (30–35), obese II (35–40), or obese III (> 40). Physical Activity was categorized as high (vigorous activity
1There were small factor differences across language in 4 items. Because the differences were small in magnitude and model fit was adequate, it is unlikely that this conferred any substantive affect on measurement precision.
A
uthor Man
uscr
ipt
A
uthor Man
uscr
ipt
A
uthor Man
uscr
ipt
A
uthor Man
uscr
≥3 days/week and total Metabolic Equivalent of Task units [METs] ≥ 1500, or moderate and vigorous activity 7 days/week and total METs ≥ 3000), moderate (vigorous activity ≥ 3 days/week and daily vigorous activity ≥ 60 min., or moderate activity ≥ 5 days/week and daily moderate activity ≥ 150 min., or moderate and vigorous activity ≥ 5 days/week and total activity/day ≥ 600 min.), or low (all values lower than the moderate criterion) using the Global Physical Activity Questionnaire (World Health Organization, 2009). Smoking status was categorized as never smoker (< 100 cigarettes in lifetime), former smoker (≥ 100 cigarettes in lifetime but not currently smoking), or current smoker (currently smokes on some days or daily) [Centers for Disease Control and Prevention (CDC), 2010]. Alcohol use was categorized as non-drinker (no alcohol in the last year), former drinker (stopped using alcohol in the last year), low-risk (≤ 7 and ≤ 14 or fewer drinks/week for women and men, respectively), or at-risk (>7 and >14 drinks/week for women and men, respectively; CDC, 2010).
Statistical Analyses
Descriptive and inferential statistics accounted for design effects and sample weights to produce weighted population estimates (LaVange et al., 2010). Analyses were performed in SPSS Statistics 19.0 (IBM, Inc., Armonk, NY) and Mplus 7.2 (Muthén & Muthén, 2006) using complex survey procedures. The social support and simpatía variables were normally distributed and modeled continuously. Multicollinearity was not detected among the predictor variables. Logistic regression was used to evaluate the associations of social support and simpatía with hypertension prevalence (model 1: hypertension regressed on sociodemographic covariates, social support and simpatía; model 2: health risks/behaviors added to model 1). Additional models were run to test the possible interactive effects of social support and simpatía (model 3: social support X simpatía interaction added to model 2), and to test whether sex moderated the associations of social support (model 4: sex X social support interaction added to model 2) or simpatía (model 5: sex X simpatía interaction added to model 2) in relation to hypertension prevalence. The social support and simpatía scores were z transformed (Ms = 0, SDs = 1) prior to analysis to facilitate interpretation.
Results
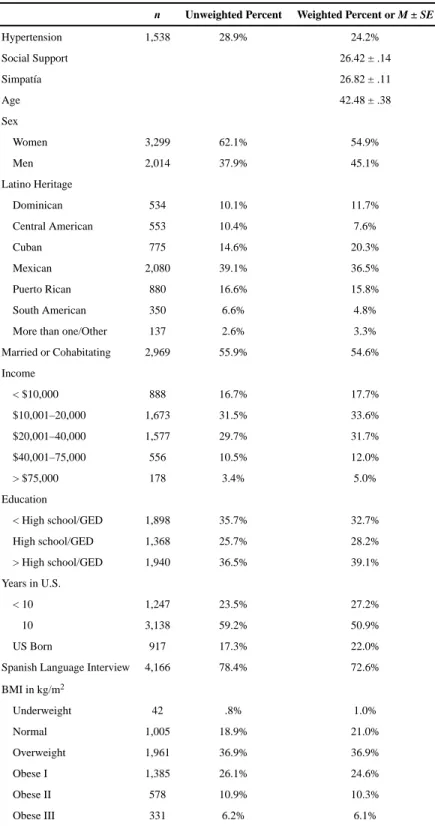
The sample is described in Table 1. The majority of respondents were born outside the U.S., Spanish speaking, overweight (BMIs: 14.49–70.35), not physically active, non-smoking, and not drinking in excess. Less than one-third (28.9%) of the sample met the criteria for hypertension. Social support and simpatía were modestly correlated, r = .14, p < .0001. Social support and simpatía were also examined across sex and Hispanic/Latino heritage groups (a table of these results are available from the authors upon request). There were no significant differences between women (social support: M = 26.27, SE = .19; simpatía: M = 26.70, SE = .16) and men (social support: M = 26.61, SE = .19; simpatía: M = 26.97, SE = . 13; ps > .05). Across heritage groups there were six significant differences for social support (Cubans reported higher social support compared to Central Americans, Puerto Ricans, and South Americans, ps ≤ .001; Mexicans reported higher social support compared to Central Americans, Puerto Ricans, and South Americans, ps ≤ .002) and four significant differences for simpatía (Mexicans reported lower simpatía compared to Dominicans, Central
A
uthor Man
uscr
ipt
A
uthor Man
uscr
ipt
A
uthor Man
uscr
ipt
A
uthor Man
uscr
Americans, Cubans, and Puerto Ricans, ps ≤ .001). However, it should be noted that the differences were minimal (social support Ms: 24.97–27.16, SEs: .22–1.15; simpatía: Ms: 25.99–27.79, SEs: .15–49).
Table 2 describes the models testing the study hypotheses. The sociodemographic model
(Model 1) fit well, z = 17.81, R2 = .38, p < .0001. Social support showed a small positive
association with hypertension, OR = 1.10, 95% CI (1.01, 1.20); a 1 SD increase in social support was associated with a 10% higher odds of hypertension. Simpatía had a modest inverse association with hypertension, OR = .85, 95% CI (.78, .92); a 1 SD increase in simpatía related to an 18% lower odds of hypertension. Model 2 included health risks/
behaviors and also fit the data well (z = 22.26, R2 = .46, p < .0001). In this model, the
associations of social support and simpatía with hypertension remained statistically
significant after accounting for these additional explanatory factors (Table 2). Social support showed a small positive association with odds of hypertension, OR = 1.11, 95% CI (1.02, 1.22). A 1 SD increase in simpatía was associated with 20% lower odds of hypertension, OR = .83, 95% CI (.77, .90). Given the unexpected positive association of social support with hypertension, individual logistic models were built that included social support and each covariate (examined iteratively, in separate models) to determine whether any covariate functioned as a suppressor variable. Across the models, none of the covariates led to a significant change in the social support-hypertension relationship. This pattern of findings, combined with the lack of collinearity among predictor variables, suggests the absence of a suppressor effect that could explain the counterintuitive (albeit modest) positive association of social support and hypertension.
Three models exploring interaction effects were also fit to the data (Table 2). Model 3 (z =
22.25, R2 = .46, p < .0001) tested the social support X simpatía interaction, which was not
significant (p = .433). Model 4 (z = 22.32, R2 = .46, p < .0001) tested the sex X social
support interaction, which was not significant (p = .933). Model 5 (z = 22.53, R2 = .47, p < .
0001) tested the sex X simpatía interaction (p = .024). This significant interaction terms was probed by calculating simple regression lines for each sex group. Sex stratified analyses showed that, in women, the simpatía-hypertension relationship was not statistically significant (p = .454); however, for men, simpatía was a protective factor, OR = .733, 95% CI (.653, .823, p < .0001). For men, a 1 SD increase in simpatía was associated with 36% lower odds of hypertension.
Discussion
Previous investigations have acknowledged the roles of psychosocial constructs, including social support and Hispanic/Latino cultural values, in physical health. Few studies have evaluated psychosocial predictors of elevated blood pressure in Hispanics/Latinos, and none to date have investigated simpatía. Thus, the current study sought to describe social support and simpatía in Hispanics/Latinos, and to determine whether these constructs were
associated with hypertension prevalence.
Overall, the average social support scores reported in the current sample are similar to those reported by 1,399 mostly (84.5%) non-Hispanic/Latino White respondents using the
A
uthor Man
uscr
ipt
A
uthor Man
uscr
ipt
A
uthor Man
uscr
ipt
A
uthor Man
uscr
ISEL-12 (M = 28.8, SE = .15; Cohen, 2008). Men and women did not differ on their levels of social support and simpatía, which is consistent with previous reports using the same measures (e.g., social support: Cohen, 2008; simpatía: Sotomayor-Peterson et al., 2012). Across heritage groups, several significant differences were observed; however, we caution against overstating these findings given their small size (e.g., for social support the largest heritage group difference was 2.19 points out of 36 points; for simpatía, the largest difference was 1.80 points out of 40 points).
In the main effects models, social support and simpatía were independently associated with hypertension. Paradoxically, higher social support was associated with greater odds of hypertension. As predicted, simpatía was associated with lower odds of hypertension. There was no evidence that the social support-simpatía interaction clarifies the sociocultural pathway in Hispanic/Latino hypertension prevalence. Sex did not modify the effects of social support. However, simpatía predicted hypertension risk among men, but not women. For Hispanic/Latino men, greater simpatía was associated with lower odds of hypertension.
The social support findings seem to contradict a large body of research, however, prior studies have also suggested that support is not unilaterally health promoting (Uchino, 2006). Indeed, several investigations have linked higher social support to poorer health outcomes in Hispanics/Latinos. For example, social support was correlated with poorer glycemic control (b = .18, p = .04 in the fully adjusted model) in a prior study of 766 Hispanics/Latinos with diabetes from the HCHS/SOL cohort (Fortmann et al., 2014). Gorman and Porter (2011) also found that hypertension prevalence was lower among older adult Mexican-American women living alone (versus living with 3 or more persons). Although social support has many positive features, negative aspects of social relationships can be a significant source of stress (Uchino, 2006). For example in a large sample of Hispanics/Latinos from multiple heritages (N = 2,450), family cohesion, which imparts some aspects of social support, was linked with increased distress when coupled with family cultural conflict (b = .06, p < .05; Rivera, Guarnaccia, Mulvaney-Day, Lin, Torres, & Alegría, 2008).
It is possible that cultural differences in the transactional nature of social support among Hispanics/Latinos (e.g., obligations to assist family members; Alegría, & Woo, 2009) may help explain the current finding. Future studies aimed at disentangling the positive and negative influences of social relationships in relation to hypertension among Hispanics/ Latinos are warranted. Specific areas for inquiry include evaluating health differences related to specific social relationships (e.g., familial, spousal, community), types of supportive behaviors (e.g., emotional vs. instrumental), and determining whether expectations for reciprocity or other demands undermine the protective function of social support in relation to health among Hispanics/Latinos. It is also worth considering the possibility that the ISEL-12, which was developed using primarily non-Hispanic/Latino samples, provides an incomplete experience of social support in Hispanics/Latinos. Although the measure appears to be performing adequately, and there is not evidence of biased responding in the current sample (Merz et al., 2014), culturally relevant aspects of social support germane to clarifying the aforementioned issues may not be fully captured by the measure.
A
uthor Man
uscr
ipt
A
uthor Man
uscr
ipt
A
uthor Man
uscr
ipt
A
uthor Man
uscr
Interestingly, men’s, but not women’s, odds of hypertension were lower in the presence of greater simpatía. Although other studies have suggested that social phenomena benefit men’s health more than women’s health (Orth-Gomér, 2009), the processes that explain this effect remain unclear. It is also plausible that Hispanic/Latino gender role expectations are contributing factors (Alegría, & Woo, 2009). Perhaps for women, simpatía involves acquiescence and compliance for the sake of social harmony, but for men being simpático means being less competitive and conflictive. Given that empirical study of simpatía is relatively new, additional research is needed to replicate the current findings. Future studies should also aim to test the potential explanatory pathways that may underlie sex differences in the health implications of simpatía.
This study has several limitations. First, the observed relationship magnitudes were small. Second, blood pressure was measured 3–9 months prior to social support and simpatía. However, given that most respondents completed the sociocultural study soon after the parent study exam (Gallo et al. 2014), and social support and simpatía are relatively stable constructs, the data were considered cross-sectional. Third, physical activity, smoking, and alcohol use were based on self-report, and information on the previous drinking patterns for former drinkers was not available. Given that alcohol was only used as a covariate, it is not expected that this substantially affected the results. Finally, the HCHS/SOL is not a
population-based study and data were not collected in some geographic regions where many Hispanics/Latinos reside (e.g., southwestern states). Despite these limitations, the current results contribute to a growing literature about Hispanic/Latino cultural values and health. Although this area of study is in its infancy, the implications of the current study may inform the development of social-health frameworks, a greater understanding of risk/protection profiles, and the tailoring of effective prevention and treatment strategies for hypertension in the growing U.S. Hispanic/Latino population.
Acknowledgments
We would like to acknowledge the following funding sources and individuals: The Hispanic Community Health Study/Study of Latinos is funded by contracts from the National Heart, Lung, and Blood Institute (NHLBI) to the University of North Carolina (N01-HC65233), University of Miami (N01-HC65234), Albert Einstein College of Medicine HC65235), Northwestern University HC65236), and San Diego State University (N01-HC65237). The following Institutes/Centers/ Offices contribute to the HCHS/SOL through a transfer of funds to the NHLBI: National Center on Minority Health and Health Disparities, the National Institute of Deafness and Other Communications Disorders, the National Institute of Dental and Craniofacial Research, the National Institute of Diabetes and Digestive and Kidney Diseases, the National Institute of Neurological Disorders and Stroke, and the Office of Dietary Supplements. The HCHS/SOL Sociocultural Ancillary Study was supported by grant 1 RC2 HL101649 from the NHLBI/NIH (Gallo/Penedo PIs). The authors thank the staff and participants of HCHS/SOL and the HCHS/SOL Sociocultural Ancillary Study for their important contributions. We thank Suzanne P. Lindsay Ph.D., M.S.W., M.P.H., Caroline A. Macera, Ph.D., and Angela P. Gutierrez, B.A. for their helpful comments.
References
Abdou CM, Dominguez TP, Meyers HF. Maternal familism predicts birthweight and asthma symptoms three years later. Social Science & Medicine. 2013; 76:28–38. [PubMed: 23142569]
Alegría, M., Woo, M. Conceptual Issues in Latino Mental Health. In: Villaruel, FA.Carlo, G.Grau, JM.Azmitia, M.Cabrera, NJ., Chahin, TJ., editors. Handbook of US Latino Psychology: Developmental and community-based perspectives. Thousand Oaks, CA: Sage; 2009. p. 15-30.
A
uthor Man
uscr
ipt
A
uthor Man
uscr
ipt
A
uthor Man
uscr
ipt
A
uthor Man
uscr
Almeida J, Molnar BE, Kawachi BE, Subramanian SV. Ethnicity and nativity status as determinants of perceived social support: Testing the concept of familism. Social Science & Medicine. 2009; 68:1852–1858. [PubMed: 19303184]
Bell CN, Thorpe RJ, LaVeist TA. Race/Ethnicity and hypertension: The role of social support. American Journal of Hypertension. 2010; 23:534–540. [PubMed: 20186126]
Campos B, Dunkel-Schetter C, Abdou C, Hobel C, Glynn LM, Sandman CA. Familialism, social support, and stress: Positive implications for pregnant Latinas. Cultural Diversity & Ethnic Minority Psychology. 2008; 14:155–162. [PubMed: 18426288]
Caplan S. Latinos, acculturation, and acculturative stress: A dimensional concept analysis. Policy, Politics, & Nursing Practice. 2007; 8:93–106.
Centers for Disease Control and Prevention. Health behaviors of adults: United States, 2005–2007.
Vital and Health Statistics. 2010. Retrieved from www.cdc.gov/nchs/data/series/sr_10/sr10_245.pdf
Chida Y, Hamer M. Chronic psychosocial factors and acute physiological responses to laboratory induced stress in healthy populations: a quantitative review of 30 years of investigations. Psychological Bulletin. 2008; 134:829–885. [PubMed: 18954159]
Chobanian AV, Bakris GL, Black HR, Cushman WC, Green LA, Izzo JL. … The National High Blood Pressure Education Program Coordinating Committee. The Seventh Report of the Joint National Committee on Prevention, Detection, Evaluation, and Treatment of High Blood Pressure: The JNC 7 Report. Journal of the American Medical Association. 2003; 289:2560–2571. [PubMed: 12748199]
Cohen, S. [Accessed November 12, 2014] Basic psychometrics for the ISEL-12. 2008. http://
www.psy.cmu.edu/~scohen/scales.html
Cohen, S., Mermelstein, R., Kamarck, T., Hoberman, HM. Measuring the functional components of social support. In: Sarason, IG., Sarason, BR., editors. Social Support: Theory, Research, and Applications. The Hague, Holland: Martinus Nijhoff; 1985. p. 73-94.
Cuffee Y, Ogedegbe C, Williams NJ, Ogedegbe G, Schoenthaler A. Psychosocial risk factors for hypertension: An update of the literature. Current Hypertension Reports. 2014; 16:483. [PubMed: 25139781]
D’Antono B, Ditto B, Moskowitz DS, Rios N. Interpersonal behavior and resting blood pressure in college women: A daily monitoring study. Journal of Psychosomatic Research. 2001; 50:309–318. [PubMed: 11438112]
Daviglus ML, Talavera GA, Avilés-Santa ML, Allison M, Cai J, Criqui MH, … Stamler J. Prevalence of major cardiovascular risk factors and cardiovascular diseases among Hispanic/Latino
individuals of diverse backgrounds in the United States. Journal of the American Medical Association. 2012; 308:1775–1784. [PubMed: 23117778]
Fortmann AL, Roesch SC, Penedo FJ, Isasi CR, Carthenon MR, Corsino L, … Gallo LC. Glycemic control among U.S. Hispanics/Latinos with diabetes from the HCHS/SOL Sociocultural Ancillary Study: Do structural and functional social support play a role? Journal of Behavioral Medicine. 2014; doi: 10.1007/s10865-014-9587-0
Gallo LC, Penedo FJ, Carnethon M, Isasi C, Sotrez-Alvarez D, Malcarne VL, … Talavera GA. The Hispanic community health study/study of Latinos sociocultural ancillary study: Sample design and procedures. Ethnicity & Disease. 2014; 24:77–83. [PubMed: 24620452]
Gamble WC, Modry-Mandell K. Family relations and the adjustment of young children of Mexican descendants: Do family cultural values moderate these associations? Social Development. 2008; 17:358–379.
Go AS, Mozaffarian D, Roger VL, Benjamin EJ, Berry JD, Borden WB, … Turner MB. Heart disease and stroke statistics - 2013 update: a report from the American Heart Association. Circulation. 2013; 127:e6–e245. [PubMed: 23239837]
Gorman BK, Porter JR. Social networks and support, gender, and racial/ethnic disparities in hypertension among older adults. Population Research & Policy Review. 2011; 30:885–911. Griffith JD, Joe GW, Chatham LR, Simpson DD. The development and validation of a Simpatía scale
for Hispanics entering drug treatment. Hispanic Journal of Behavioral Sciences. 1998; 20:468– 482.
A
uthor Man
uscr
ipt
A
uthor Man
uscr
ipt
A
uthor Man
uscr
ipt
A
uthor Man
uscr
Huai P, Hun H, Reilly KH, Wang Y, Ma W, Xi B. Physical activity and risk of hypertension: A meta-analysis of prospective cohort studies. Hypertension. 2013; 62:1021–1026. [PubMed: 24082054] Jasso, G., Massey, DS., Rosenzweig, MR., Smith, JP. Immigrant Health-Selectivity and Acculturation.
In: NormanRodolfo, Barney, editors. Critical Perspectives on Racial and Ethnic Differences in Health in Late Life. Washington D.C: National Academies Press; 2004. p. 227-266.
Lavange LM, Kalsbeek WD, Sorlie PD, Aviles-Santa LM, Kaplan RC, Barnhart J, … Elder JP. Sample design and cohort selection in the Hispanic Community Health Study/Study of Latinos. Annals of Epidemiology. 2010; 20:642–649. [PubMed: 20609344]
MacKinnon DP, Krull JL, Lockwood CM. Equivalence of the Mediation, Confounding and Suppression Effect. Prevention Science. 2000; 1:173–181. [PubMed: 11523746] Marín, G., Marín, BV. Research with Hispanic populations. Newbury Park, CA: Sage; 1991. McClure HH, Martinez CR, Snodgrass JJ, Eddy JM, Jiménez RA, Isiordia LE, McDade TW.
Discrimination-related stress, blood pressure and Epstein-Barr virus antibodies among Latin American immigrants in Oregon, US. Journal of Biosocial Science. 2010; 42:433–461. [PubMed: 20178683]
Merz EL, Roesch SC, Malcarne VL, Penedo FJ, Llabre MM, Weitzman OB, … Gallo LC. Validation of Interpersonal Support Evaluation List-12 (ISEL-12) Scores Among English- and Spanish-Speaking Hispanics/Latinos From the HCHS/SOL Sociocultural Ancillary Study. Psychological Assessment. 2014; 26:384–394. [PubMed: 24320763]
Miller GE, Cohen S, Rabin BS, Skoner DP, Doyle WJ. Personality and tonic cardiovascular, neuroendocrine, and immune parameters. Brain, Behavior, & Immunity. 1999; 13:109–123. Muthén, L., Muthén, B. Mplus User’s Guide. 6. Los Angeles, CA: 2006.
National Heart, Lung, and Blood Institute. Clinical guidelines on the identification, evaluation, and treatment of overweight and obesity in adults: The evidence report. 1998. Retrieved from
www.nhlbi.nih.gov/guidelines/obesity/ob_gdlns.pdf
Orth-Gomér K. Are social relations less health protective in women than in men? Social relations, gender, and cardiovascular health. Journal of Social and Personal Relationships. 2009; 26:63–71. Ramírez-Esparza N, Gosling SD, Pennebaker JW. Paradox lost: Unraveling the puzzle of Simpatía.
Journal of Cross-Cultural Psychology. 2008; 39:703–715.
Rivera FI, Guarnaccia PJ, Mulvaney-Day N, Lin JY, Torres M, Alegría M. Family cohesion and its relationship to psychological distress among Latino groups. Hispanic Journal of Behavioral Sciences. 2008; 30:357–378. [PubMed: 19444326]
Sesso HD, Cook NR, Buring JE, Manson JE, Gaziano JM. Alcohol consumption and the risk of hypertension in women and men. Hypertension. 2008; 51:1080–1087. [PubMed: 18259032] Sneed RS, Cohen S. Negative social interactions and incident hypertension in older adults. Health
Psychology. 2014; 33:554–565. [PubMed: 24884909]
Sotomayor-Peterson M, Cabeza De Baca R, Figueredo AJ, Smith-Castro V. Shared parenting, parental effort, and life history strategy: A cross-cultural comparison. Journal of Cross-Cultural
Psychology. 2013; 44:620–639.
Sotomayor-Peterson M, Figueredo AJ, Christensen DH, Taylor AR. Couples’ cultural values, shared parenting, and family emotional climate within Mexican American families. Family Process. 2012; 51:218–233. [PubMed: 22690862]
Sorlie PD, Avilés-Santa LM, Wassertheil-Smoller S, Kaplan RC, Daviglus ML, Giachello AL, … Heiss G. Design and Implementation of the Hispanic Community Health Study /Study of Latinos. Annals of Epidemiology. 2010; 20:629–641. [PubMed: 20609343]
Tomaka J, Thompson S, Palacios R. The relation of social isolation, loneliness, and social support to disease outcomes among the elderly. Journal of Aging & Health. 2006; 18:359–384. [PubMed: 16648391]
Triandis H, Marin G, Lisansky J, Betancourt H. Simpatía as a cultural script of Hispanics. Journal of Personality & Social Psychology. 1984; 47:1363–1375.
Uchino B. Social support and health: A review of physiological processes potentially underlying links to disease outcomes. Journal of Behavioral Medicine. 2006; 29:377–387. [PubMed: 16758315]
A
uthor Man
uscr
ipt
A
uthor Man
uscr
ipt
A
uthor Man
uscr
ipt
A
uthor Man
uscr
Uchino BN, Bowen K, Carlisle M, Birmingham W. Psychological pathways linking social support to health outcomes: A visit with the “ghosts” of research past, present, and future. Social Science & Medicine. 2012; 74:949–957. [PubMed: 22326104]
van Reedt Dortland AKB, Giltay EJ, van Veen T, Zitman FG, Penninx BWJH. Personality traits and childhood trauma as correlates of metabolic risk factors: The Netherlands study of depression and anxiety (NESDA). Progress in Neuro-Psychopharmacology & Biological Psychiatry. 2012; 36:85– 91. [PubMed: 22001949]
Virdis A, Giannarelli C, Neves MF, Taddei S, Ghiadoni L. Cigarette smoking and hypertension. Current Pharmaceutical Design. 2010; 16:2518–2525. [PubMed: 20550499]
World Health Organization. Global Physical Activity Questionnaire (GPAQ) Analysis Guide. 2009.
Retrieved from www.who.int/chp/steps/resources/GPAQ_Analysis_Guide.pdf
Yu JJ, Lucero-Liu AA, Gamble WC, Taylor AR, Christensen DH, Modry-Mandell KL. Partner Effects of Mexican Cultural Values: The Couple and Parenting Relationships. The Journal of Psychology: Interdisciplinary and Applied. 2008; 142:169–192. [PubMed: 18447074]
A
uthor Man
uscr
ipt
A
uthor Man
uscr
ipt
A
uthor Man
uscr
ipt
A
uthor Man
uscr
A
uthor Man
uscr
ipt
A
uthor Man
uscr
ipt
A
uthor Man
uscr
ipt
A
uthor Man
uscr
ipt
Table 1
Description of the sample (N = 5,313)
n Unweighted Percent Weighted Percent or M ± SE
Hypertension 1,538 28.9% 24.2%
Social Support 26.42 ± .14
Simpatía 26.82 ± .11
Age 42.48 ± .38
Sex
Women 3,299 62.1% 54.9%
Men 2,014 37.9% 45.1%
Latino Heritage
Dominican 534 10.1% 11.7%
Central American 553 10.4% 7.6%
Cuban 775 14.6% 20.3%
Mexican 2,080 39.1% 36.5%
Puerto Rican 880 16.6% 15.8%
South American 350 6.6% 4.8%
More than one/Other 137 2.6% 3.3%
Married or Cohabitating 2,969 55.9% 54.6%
Income
< $10,000 888 16.7% 17.7%
$10,001–20,000 1,673 31.5% 33.6%
$20,001–40,000 1,577 29.7% 31.7%
$40,001–75,000 556 10.5% 12.0%
> $75,000 178 3.4% 5.0%
Education
< High school/GED 1,898 35.7% 32.7%
High school/GED 1,368 25.7% 28.2%
> High school/GED 1,940 36.5% 39.1%
Years in U.S.
< 10 1,247 23.5% 27.2%
≥ 10 3,138 59.2% 50.9%
US Born 917 17.3% 22.0%
Spanish Language Interview 4,166 78.4% 72.6%
BMI in kg/m2
Underweight 42 .8% 1.0%
Normal 1,005 18.9% 21.0%
Overweight 1,961 36.9% 36.9%
Obese I 1,385 26.1% 24.6%
Obese II 578 10.9% 10.3%
Obese III 331 6.2% 6.1%
A
uthor Man
uscr
ipt
A
uthor Man
uscr
ipt
A
uthor Man
uscr
ipt
A
uthor Man
uscr
ipt
n Unweighted Percent Weighted Percent or M ± SE
Low 3,245 61.1% 11.4%
Moderate 1,531 28.8% 29.8%
High 486 9.1% 58.8%
Cigarette Use
Never Smoker 3,240 61.0% 61.3%
Former Smoker 1,094 20.6% 18.1%
Current Smoker 974 18.3% 20.7%
Alcohol Use
Former Drinker 1,752 32.9% 30.4%
Never Drinker 1,105 20.8% 20.0%
Low-risk Drinker 2,193 41.3% 43.6%
At-risk Drinker 261 4.9% 6.0%
A
uthor Man
uscr
ipt
A
uthor Man
uscr
ipt
A
uthor Man
uscr
ipt
A
uthor Man
uscr
ipt
T ab le 2Results of logistic re
gressions predicting h
ypertension
V
ariable
Model 1(R
2 = .38)
Model 2(R
2 =. 46)
Model 3(R
2 =. 46)
Model 4(R
2 = .46)
Model 5(R
2 =. 47)
OR (95% CI)
OR (95% CI)
OR (95% CI)
OR (95% CI)
OR (95% CI)
Age
1.10 (1.09, 1.10)
1.10 (1.09, 1.10)
1.10 (1.09, 1.10)
1.10 (1.09, 1.10)
1.10 (1.09, 1.10)
Se
x (W
omen)
1
Men
1.55 (1.31, 1.84)
1.97 (1.63, 2.39)
1.98 (1.63, 2.40)
1.97 (1.63, 2.40)
1.98 (1.63, 2.40)
Latino Heritage (Me
xican)
1
Dominican
1.76 (1.37, 2.26)
1.78 (1.39, 2.30)
1.80 (1.40, 2.32)
1.79 (1.39, 2.30)
1.78 (1.38, 2.29)
Central American
1.58 (1.20, 2.09)
1.41 (1.06, 1.88)
1.41 (1.06, 1.88)
1.41 (1.06, 1.88)
1.41 (1.06, 1.88)
Cuban
1.98 (1.53, 2.55)
1.71 (1.31, 2.22)
1.71 (1.31, 2.22)
1.71 (1.31, 2.22)
1.71 (1.32, 2.23)
Puerto Rican
1.79 (1.33, 2.41)
1.64 (1.23, 2.19)
1.65 (1.23, 2.20)
1.64 (1.23, 2.20)
1.65 (1.23, 2.20)
South American
1.17 (0.83, 1.66)
1.14 (0.79, 1.63)
1.14 (0.79, 1.63)
1.14 (0.79, 1.63)
1.13 (0.78, 1.62)
More than one/Other
0.95 (0.57, 1.58)
0.93 (0.57, 1.54)
0.93 (0.57, 1.54)
0.93 (0.56, 1.54)
0.93 (0.56, 1.53)
Married or Cohabitating
0.81 (0.68, 0.96)
0.81 (0.68, 0.98)
0.81 (0.68, 0.98)
0.81 (0.68, 0.98)
0.82 (0.68, 0.99)
Income (> $75,000)
1
< $10,000
1.41 (0.82, 2.43)
1.25 (0.72, 2.16)
1.23 (0.72, 2.13)
1.25 (0.72, 2.16)
1.25 (0.73, 2.17)
$10,001–20,000
1.59 (0.94, 2.69)
1.44 (0.85, 2.44)
1.43 (0.84, 2.41)
1.44 (0.85, 2.44)
1.45 (0.85, 2.47)
$20,001–40,000
1.67 (0.97, 2.86)
1.49 (0.87, 2.55)
1.48 (0.86, 2.52)
1.49 (0.87, 2.55)
1.51 (0.88, 2.58)
$40,001–75,000
1.21 (0.65, 2.27)
1.17 (0.63, 2.17)
1.16 (0.62, 2.16)
1.16 (0.63, 2.17)
1.16 (0.62, 2.17)
Education (> High school/GED)
1
< High school/GED
1.02 (0.81, 1.29)
0.95 (0.76, 1.20)
0.95 (0.76, 1.20)
0.95 (0.76, 1.20)
0.96 (0.76, 1.21)
High school/GED
1.13 (0.88, 1.46)
1.07 (0.84, 1.37)
1.07 (0.84, 1.37)
1.07 (0.84, 1.37)
1.08 (0.84, 1.37)
Y
ears in U.S. (U.S. Born)
1
< 10
0.67 (0.43, 1.02)
0.75 (0.48, 1.17)
0.75 (0.48, 1.17)
0.75 (0.48, 1.17)
0.75 (0.48, 1.17)
≥ 10
0.80 (0.58, 1.11)
0.86 (0.61, 1.22)
0.86 (0.61, 1.22)
0.86 (0.61, 1.22)
0.87 (0.61, 1.23)
Spanish Language Intervie
w
1.01 (0.73, 1.40)
0.87 (0.61, 1.23)
0.87 (0.62, 1.23)
0.87 (0.61, 1.23)
0.86 (0.61, 1.23)
BMI (Normal: 18.5–25)
1
Underweight (< 18.5)
1.05 (0.49, 2.24)
1.05 (0.49, 2.23)
1.05 (0.49, 2.25)
A
uthor Man
uscr
ipt
A
uthor Man
uscr
ipt
A
uthor Man
uscr
ipt
A
uthor Man
uscr
ipt
V ariable Model 1(R2 = .38)
Model 2(R
2 =. 46)
Model 3(R
2 =. 46)
Model 4(R
2 = .46)
Model 5(R
2 =. 47)
OR (95% CI)
OR (95% CI)
OR (95% CI)
OR (95% CI)
OR (95% CI)
Ov
erweight (25–30)
2.10 (1.55, 2.84)
2.10 (1.56, 2.84)
2.10 (1.55, 2.84)
2.09 (1.55, 2.82)
Obese I (30–35)
3.37 (2.47, 4.59)
3.38 (2.48, 4.62)
3.37 (2.47, 4.59)
3.38 (2.48, 4.60)
Obese II (35–40)
4.62 (3.13, 6.81)
4.61 (3.13, 6.79)
4.62 (3.13, 6.80)
4.62 (3.13, 6.80)
Obese III (> 40)
8.59 (5.85,12.62)
8.61 (5.86,12.64)
8.60 (5.86, 12.61)
8.65 (5.89, 12.70)
Ph ysical Acti vity (High) 1 Lo w
1.82 (1.30, 2.54)
1.82 (1.31, 2.55)
1.82 (1.30, 2.54)
1.83 (1.31, 2.56)
Moderate
1.96 (1.42, 2.70)
1.96 (1.42, 2.71)
1.96 (1.42, 2.70)
1.99 (1.44, 2.75)
Cig
arette Use (Ne
v er Smok er) 1 F ormer Smok er
1.10 (0.89, 1.35)
1.10 (0.90, 1.35)
1.10 (0.89, 1.35)
1.10 (0.89, 1.35)
Current Smok
er
1.03 (0.79, 1.34)
1.03 (0.79, 1.34)
1.03 (0.79, 1.35)
1.03 (0.79, 1.35)
Alcohol Use (Ne
v er Drink er) 1 F ormer Drink er
0.71 (0.54, 0.93)
0.71 (0.54, 0.94)
0.71 (0.54, 0.93)
0.72 (0.55, 0.94)
Lo
w-risk Drink
er
0.66 (0.52, 0.85)
0.66 (0.52, 0.85)
0.66 (0.52, 0.85)
0.66 (0.52, 0.85)
At-risk Drink
er
1.53 (1.04, 2.25)
1.53 (1.04, 2.25)
1.53 (1.04, 2.25)
1.54 (1.05, 2.27)
Social Support
1.10 (1.01, 1.20)
1.11 (1.02, 1.22)
1.11 (1.02, 1.22)
1.13 (0.86, 1.49)
1.11 (1.02, 1.21)
Simpatía
0.85 (0.78, 0.92)
0.83 (0.77, 0.90)
0.83 (0.77, 0.90)
0.83 (0.77, 0.90)
1.16 (0.90, 1.49)
Social Support X Simpatía
1.04 (.96, 1.14)
Se
x X Social Support
0.99 (0.83, 1.18)
Se
x X Simpatía
0.80 (0.68, 0.94)
Note
.
1 Reference group in parentheses; Social support and simpatía were
z transformed to a mean of 0 and a standard de