THE GENERATION OF AN EXPERIMENTAL DATABASE FOR TESTING PREDICTIVE MODELS FOR α-PINENE GAS- AND PARTICLE-PHASE REACTIONS
IN THE ATMOSPHERE
Jyoti Bapat
A thesis submitted to the faculty of the University of North Carolina at Chapel Hill in partial fulfillment of the requirements for the degree of Master of Science in the Department of
Environmental Sciences and Engineering, Gillings School of Global Public Health.
Chapel Hill 2011
Approved by
ii ABSTRACT
Jyoti Bapat
The Generation of an Experimental Database for Testing Predictive Models for α-Pinene Gas- and Particle-Phase Reactions in the Atmosphere
(Under the direction of Professor Richard M. Kamens)
Atmospheric chemistry of biogenic and anthropogenic volatile organic compounds (VOCs) has become an increasingly important aspect of environmental policy. Atmospheric oxidation of VOCs produces ozone (O3) and particulate matter (PM), both of which have
been shown to have effects on climate and human health. α-Pinene, a biogenically emitted VOC, is a source of O3, and in an urban environment is an important source of urban
secondary organic aerosol (SOA). This work attempts to model the O3 and SOA production
of α-pinene photooxidation in the presence of oxides of nitrogen (NOx) and an urban
hydrocarbon (HC) mixture. The model was compared against recent experimental data. Under most conditions, the model predicts SOA production well, and fits gas-phase data better than other common mechanisms. Results indicate that further experimentation is required to model α-pinene chemistry at α-pinene/NOx ratios lower than 1, especially since
iii
ACKNOWLEDGEMENTS
I owe my deepest gratitude to my parents, Ashok and Mina Bapat, and my brother, Deepak Bapat, for their love and support. They have encouraged every one of my endeavors and for that I am truly grateful.
This thesis would not have been possible if it were not for Professor Rich Kamens, who not only served as my advisor, but challenged and encouraged me from the day that I joined his group. I would also like to thank the members of my committee, Dr. Will Vizuete and Dr. Jason Surratt, for their advice and guidance.
Special thanks go to Haofei Zhang and Harshal Parikh, who have been invaluable resources and colleagues throughout my time at UNC.
iv
TABLE OF CONTENTS
LIST OF TABLES...vi
LIST OF FIGURES...vii
Chapter I. INTRODUCTION...1
II. EXPERIMENTAL SECTION...5
Chamber Description...5
Methods...6
Instrumentation...8
III. MECHANISM DEVELOPMENT...10
Original Gas-Phase Mechanism Development...10
Original Particle-Phase Mechanism Development...11
Mechanism Modifications...13
IV. RESULTS AND DISCUSSION...20
α-Pinene + NOx Gas-Phase Simulations and Comparisons...20
α-Pinene with Toluene and HCMix Simulations...26
Inter-Comparison of Common Mechanisms...28
Particle-Phase Mechanism Comparisons...32
Simulation of α-Pinene Particle-Phase Products...35
v
VI. Recommendations...43
APPENDICES...45
Appendix A: Explanation of Extraction Efficiency...45
Appendix B: Additional Tables and α-Pinene Mechanism...47
Tables...47
α-Pinene Mechanism...48
Appendix C: Simulations of 1999 Experiments...52
Appendix D: All Gas and SOA Simulations for 2009, 2010, 2011 Experiments...57
vi
LIST OF TABLES
Table
1. HCMix composition...6 2. Changes to rate constants from MCMv3.1...17 3. Changes to rate constants from IUPAC: Subcommittee
For Gas Kinetic Data Evaluation...17 4. Partitioning constants for all particle-phase species...19 5. Experiments performed over the summer of
2009, 2010, and 2011...21 6. Two experiments performed in 1999 used for development
of original mechanism...21 7. Sensitivity analysis: maximum O3 with significant
vii
LIST OF FIGURES Figure
1. UNC dual chamber located in Pittsboro, North Carolina...5 2. Model and data gas-phase results of four α-pinene + NOx
experiments using the updated UNC mechanism...23 3. Model and data gas-phase results of four α-pinene + NOx
experiments using original 2001 mechanism...24 4. Sensitivity analysis of major changes to mechanism for
Experiment 7...25 5. Model and data particle-phase results of Experiments 5 and
4 with different initial conditions using the updated UNC
mechanism...27 6. Gas-phase model performances for Experiment 12 using the
updated UNC mechanism, CB05, SAPRC07, and MCMv3.1...29 7. Relative errors of UNC mechanism and 3 other commonly used
mechanisms...30 8. Model and data particle-phase results for Experiments 12 and 13
using the original 2001 mechanism...33 9. Model and data particle-phase results for Experiments 12 and 13
using the updated UNC mechanism...34 10.Model and data particle-phase results of Experiments 4, 5, and
9 with different initial conditions using the updated UNC
mechanism...34 11.GC/MS total ion chromatogram for Experiment 13 Filter 2 with
pinonic acid, pinic acid, pinonaldehyde, and oxypinonaldehyde
peaks labeled...36 12.Data and model estimations of particle phase pinonic acid from
1 Chapter I INTRODUCTION
α-Pinene (2,6,6-trimethyl-bicyclo[3.1.1]hept-2-ene) is an important biogenic volatile organic compound (VOC) in the class of monoterpenes, all of which have the chemical formula C10H16. α-Pinene is naturally emitted through the oil of a number of coniferous and
non-coniferous plants, most notably from pine trees (Blanch, et al., 2011). It has been demonstrated that atmospheric oxidation of α-pinene creates ozone (O3) and forms a number
of low saturation vapor-pressure products which can condense onto pre-existing particles or create new aerosols via nucleation; therefore, α-pinene is an important contributor to global secondary organic aerosol (SOA) production (Guenther et al., 1995). α-Pinene oxidation also causes O3 production near the Earth’s surface, which has been shown to have adverse health
effects on humans (Hackney et al., 1975; Krupnick et al., 1990). SOA have also been demonstrated to have potential health effects (Pope et al., 2002). Additionally, SOA have direct effects on climate by reflecting sunlight back to space, cooling the Earth (Solomon, et al., 2007; Hallquist et al., 2009). For these reasons, both O3 and SOA have become important
in atmospheric science and policy.
2
Zhang et al., 2010). The gas-phase products of α-pinene are well documented (Yu et al., 1998; Jang et al., 1999). A few significant gas-phase products of α-pinene are pinonaldehyde and norpinonaldeyhde, pinic and norpinic acid, pinonic and norpinonic acid, among others. Identification of some of the particle-phase products has also been previously described (Kamens et al., 1999; 2001). Estimations of SOA production range from 2 to 79 Tg/year (Kanakidou et al., 2000; Tsigaridis et al., 2003).
Attempts have been made to model α-pinene oxidation. The Carbon Bond mechanisms, CB4 (Gery et al., 1989) and CB05 (Yarwood et al., 2005) use an engineered method to represent atmospheric chemistry, with chemical species based on functional groups and reactivity. SAPRC07 (Carter et al., 2009) is an example of a lumped mechanism, and represents chemistry a little more explicitly than the Carbon Bond mechanisms. The Master Chemical Mechanism version 3.1(MCMv3.1) is a semi-explicit mechanism, and details a number of oxidation reactions for α-pinene (Jenkin et al., 1997; Saunders et al., 2003). Limitations exist with both of these mechanistic methods. Lumped or engineered mechanisms, like SAPRC and the Carbon Bond mechanisms, are too condensed to represent many types of gas-phase products and SOA precursors. On the other hand, explicit mechanisms contain a large number of reactions, and are therefore too big to use in current air quality models. For this reason, a mechanism with fewer reactions than MCMv3.1, but more specific than either Carbon Bond or SAPRC, is needed.
3
1998, Jeffries developed a more sophisticated kinetic solver, called Morphocule (MORPHO), which could accommodate a far greater number or species and reactions, and is only limited by the size or memory on the computer.
Besides accommodating for a large number of species, MORPHO also allows the user at each time step to sum related species into a scalar quantity, and permits the sum of these individual species to react with other individual species. This is particularly useful for the representation of peroxy radical (RO2) cross reactions, and also permits all particle-phase
products to be grouped together, and then react with individual gas phase-species, simulating gas-phase condensation to the particle phase. Another feature of MORPHO is that it allows the several individual mechanisms to be run in tandem. For example, two mechanisms written separately for two VOCs and saved as separate files can be run in conjunction to simulate the photooxidation of those VOCs in the presence of each other. These features make MORPHO a much more flexible solver to use with these mechanisms.
4
Although α-pinene contributes considerably to global terpene emissions (Guenther et al., 1993; 1995), on an urban scale it can contribute substantially to urban SOA formation (Lewandowski et al., 2008). Hence, there is a need not only for α-pinene – NOx experiments,
5 Chapter II EXPERIMENTAL
Chamber Description
A series of experiments were performed in UNC’s Ambient Air Research Facility dual outdoor smog chamber located in Pittsboro, North Carolina, over the summers of 2009, 2010, and 2011. The smog chamber is made out of clear FEP Teflon, and a sheet of the same material separates the chamber into two sides. One side, called “North”, is 136 m3. The other side, called “South”, has a volume of 138 m3. The dual chambers allow two simultaneous experiments with different concentrations and species of VOCs to be run at the same time under the same meteorological conditions. The chamber sits above a sampling laboratory. Gas- and particle-phase sampling lines run from both sides of the chamber through the floor into the room below, which houses all instrumentation as well as the air compressor. All experiments were performed under clear skies with natural sunlight, at ambient relative humidity (RH), and at ambient temperatures ranging from 285 to 315 K. An image of the chamber can be seen below in Figure 1.
6
Methods
For at least six hours prior to each experiment, the chambers were purged with rural North Carolina air. Sulfur hexafluoride (SF6) was injected into each side of the chamber to
track dilution through the chamber walls. Different amounts of nitrogen oxides (NOx = NO +
NO2) were then injected into the chamber from a high-pressure gas cylinder. The injection of
NOx occurred before the addition of any hydrocarbons, to titrate out any ambient O3 in the
chamber. Concentrations of NOx, O3, and VOCs were monitored by on-site instrumentation
housed in the sampling laboratory under the chamber.
To simulate an urban air mixture, a gas mixture of eleven hydrocarbons of varying concentrations, called the UNC hydrocarbon gas mixture (HCMix), was injected into the chamber prior to the addition of the VOC. The composition of hydrocarbons in HCMix is shown in Table 1. α-Pinene or toluene was then injected into the chamber by vaporizing the pure liquid in a U-tube and flushing the hydrocarbon into the chamber with a flow of pure N2
gas. After each injection, a series of mixing fans were turned on. These served a dual purpose in that they flushed out the gas lines going into the chamber as well as mixed the air in the chamber, ensured a well-mixed reactor.
Table 1. HCMix composition
Compound Concentration (ppmC)
isopentane 0.16135
n-Pentane 0.25285
2-methylpentane 0.08363 2,4-dimethylpentane 0.08301 2,2,4-trimethylpentane 0.11157
1-butene 0.02805
cis-2-butene 0.03074 2-methylbutene 0.02753 2-methyl-2-butene 0.03923
ethylene 0.13051
propylene 0.05154
7
Each experiment was run for approximately twelve hours. Gas-phase species (NO, NO2, O3) were measured every minute, particles were counted and measured for size
approximately every five minutes, and temperature was measured every thirty minutes. Gas-phase organic species were monitored throughout the experiment with the use of gas chromatography (GC).
Filter samples of SOA were taken during the experiment on October 18th, 2010. One borosilicate microfiber filter (PALL Life Sciences, 47-mm diameter, 1.0-µm pore size) on each side of the chamber was pulled for an hour before the injection of any hydrocarbons to get a reading on background aerosol. After the injection of hydrocarbons, another set of filters was set up on both sides of the chamber, pulling aerosol for approximately two hours. A third and final set of filters was used to pull aerosol from the chamber for an additional two hours. The flow rate for each filter-sampling period was approximately 25 L/min. Each set of filters was actually two filters, a filter on top which was separated by a 4 mm filter holder from the filter on the bottom. The top filter would collect aerosols, and the bottom filter would collect only gaseous organics that were absorbed onto each filter (McDow et al., 1990). To get the mass of just the aerosols deposited on the top filter within the two hours, the mass of the bottom filter, or the gas-phase product deposition, was subtracted from the top filter.
The filters were extracted using 8 mL high purity methanol (LC-MS CHROMASOLV-grade, from Sigma-Aldrich) through 45 minutes of sonication. The extracted product in methanol was blown dry under a gentle stream of N2. The dry product
8
The GC/MS instrument was equipped with an electron ionization (EI) source that was operated at 70 eV (Hewlett 5890 Packard Series II Gas Chromatograph interfaced to a HP 5971A Series Mass Selective Detector, Econo-Cap-EC-5 column, 30 m×0.25 mm×0.25 µm). The GC/MS method was run on SCAN mode with a solvent delay of 3 minutes. An initial inlet temperature of 250°C and pressure of 3 psi was used. Initial oven temperature was 80°C and final oven temperature was 250°C. Total run time for the method was 22 minutes. Blank filters spiked with a pinonic acid standard (Sigma-Aldrich, 98%) were also run through the same extraction procedure, to determine extraction efficiency and the degree of retention through the drying process. All samples included two internal standards: bornyl acetate and methyl dodecanoate. These two internal standards were chosen because their volatilities fell within the range of volatilities of known α–pinene products. Known amounts of both internal standards were injected into each filter sample and standard. All samples were analyzed using GC/MS within 30 hours of being extracted and concentrated.
Instrumentation
During each experiment, NOx and O3 mixing ratios were monitored using a
chemilumicescent NOx meter (9841A Teledyne Instruments Monitor Labs, Englewood, CO)
and an ultraviolet O3 meter (49 Thermo Electron Instruments, Hopkinton, MA). Both of these
meters were calibrated before each experiment using a NIST certified NOx tank. The outdoor
9
GC (Shimadzu Model 14A, column: 30 m, 0.25mm i.d., J&W DB-1, 0.25m film thickness) coupled to a flame ionization detector (FID). The method was run for ten minutes at an oven temperature of 50°C and held isothermally through the entire run. Every GC was calibrated before each experiment using a mix of eight basic hydrocarbons ranging in number of carbons. The lab also includes instrumentation for measuring SF6 and peroxyacetyl nitrate
10 Chapter III
MECHANISM DEVELOPMENT
Original Gas-Phase Mechanism Development
The basis of the α-pinene photolysis mechanism is the 2001 version written by Kamens et al., (1999; 2001). A list of compounds and their abbreviations used in the mechanism is given in Appendix B Table B-1 and B-2 at the end of this manuscript. The main reaction pathway for α-pinene oxidation in the atmosphere is through hydroxyl radical (OH) attack (Kamens et al., 1999). Through OH addition to the double bond, two similar peroxy (RO2) radicals are generated, and these were grouped together in the mechanism as
‘ap-oo’. This RO2 radical undergoes further reaction with nitric oxide (NO) to ultimately
produce pinonaldehyde and organic nitrates, along with nitrogen dioxide (NO2) and
hydroperoxyl radicals (HO2). Attack by the NO3 radical on the α-pinene double bond is also
possible, resulting in organic nitrates (Atkinson, 1990; 1997). α-Pinene reaction with O3 is
also depicted, resulting in the production of two Criegee bi-radicals which undergo further reaction to produce a number of RO2 radicals and stable products. Two of the most important
gas-phase products of α-pinene chemistry, pinic and pinonic acid, are formed from the O3
and OH pathways (Kamens et al., 2001).
11
coefficient, J, was calculated using Equation 1. Light flux, Γ, is based on measurements from one of the UNC outdoor smog chambers (Jeffries et al., 1989). The cross section (σ) and quantum yield (Φ) are both dependent upon the species being photolyzed, and are based upon the International Union of Pure and Applied Chemistry (IUPAC, 2002) and Jet Propulsion Laboratory (JPL) (Sander et al., 2006) suggested values.
= Γ λ σλ Φλ (1)
Most recently, this mechanism was updated in 2007 (Li et al., 2007) with the addition of oligomerization reactions. These are represented by a series of reactions in which particle-phase products combine to form an oligomer, called “seed1” in this mechanism. Throughout the discussion, this version of the mechanism will be referred to as the 2001 mechanism, including gas- and particle-phase chemistry and oligomerization. Reaction rates and yields from this mechanism come from previous works (Kamens et al., 2001; Li et al. 2007)
Original Particle-Phase Mechanism Development
Eventually, the organics produced from α-pinene photo-oxidation undergo a series of oxidation steps, the products of which have low vapor pressures allowing them to condense onto available particles. These are represented in the mechanism as 9 different particle-phase species. The particle-phase species and their corresponding gas-phase species are defined in the Appendix B.
Rate constants for partitioning to and from the particle-phase were calculated originally by Kamens, et al. (1999, 2001). The partitioning coefficient, Kp, is equal to the
ratio of the rates of the forward and backward reactions, kon and koff, respectively (Equation
12
shown below in Equation 3. Vapor pressure, pL, can be calculated using Equation 5. Entropy
of vaporization, ∆Svap, can be calculated using the boiling point of each species, which was
estimated using empirical methods based on chemical structure determined by Joback, et al. (1987). The Joback calculation of boiling points uses a combinatorial method to estimate the contribution of specific groups. The reaction rate for partitioning from the particle to the gas phase is koff (Equation 4). In this equation, Ea is the activation energy required for the
absorption to take place. This activation energy can be calculated by assuming a roughly linear relationship between activation energy and the natural log of vapor pressure of the compound. The pre-exponential factor, β, is equal to kb/h*T, where kb is Boltzmann’s
constant, h is Planck’s constant, and T is the ambient temperature. Since kb and h are
constant, and temperature does not change significantly over the course of a day, an average of temperature of 298K was used to calculate β. The method of partitioning rate calculations has been described in previous works (Kamens et al., 1999).
= / (2)
= !×"#.× $%&×'$ (3)
= ( × )*
+,
-. (4)
ln12 =345,6 781.8 ;1 − 7= + 0.8ln 7 @ (5)
13
α-Pinene Mechanism Modifications
The α-pinene mechanism was last updated in 2007, with the addition of only a few reactions detailing the formation of oligomers from particle-phase reactions (Li et al., 2007). Since that time, several new developments in the atmospheric chemistry of α-pinene have been published (Claeys et al., 2009; Szmigielski et al., 2010; Yasmeen et al., 2010). There have also been updates in rate constants. Rate constant changes have been determined through either further research or a change in the accepted atmospheric rate constant suggested by the International Union of Pure and Applied Chemistry (IUPAC). The complete mechanism is given in Appendix B, and major mechanism updates from rate constants are given in this section in Tables 2 and 3.
The production of high-molecular weight species from α-pinene oxidation has been documented in a few recent studies through the use of liquid chromatography interfaced to mass spectroscopy (LC/MS). This includes compounds such as terpenylic acid, 2-hydroxyterpenylic acid, and diaterpenylic acid acetate (Claeys et al., 2009; Yasmeen et al., 2010), which have molecular weights of 172, 188, and 232, respectively. In addition, LC/MS has been used to detect oligomeric species from smog chamber studies of α-pinene oxidation (Gao et al., 2004; Tolocka et al., 2004; Hall et al., 2010) as well as organosulfate formation in α-pinene SOA generated in the presence of NOx and acidified sulfate seed aerosol (Surratt
14
than other significant α-pinene oxidation products, and therefore will have a potentially greater contribution to SOA production.
Recently, a high-molecular weight compound with three carboxylic acid groups was identified as a product of α-pinene oxidation with the OH radical (Szmigielski et al., 2010). 3-methyl-1,2,3-butane-tricarboxylic acid (MBTCA), an eight carbon carboxylic acid with a molecular weight of 204, is formed in several stages from the reaction of pinonic acid with the OH radical. A mechanism for formation has been proposed by Szmigielski et al. (2010), who suggest that MBTCA may form directly in the particle phase. This proposed reaction sequence was condensed to two reactions for inclusion in this mechanism. Starting with the reaction of pinonic acid and the OH radical, this sequence results in the formation of an intermediate product, ‘pre-tri’, which stands for the pre-tricarboxylic acid product.
Originally, in the reaction of the α-pinene nitrate RO2 with NO3, there was only one
stoichiometric equivalent of nitrogen generated. This reaction was modified to produce a di-nitrate product, called ‘OH-apN2O6’, to maintain a nitrogen mass balance. The production of an α-pinene di-nitrate product has been documented by Spittler, et al (2006). The α-pinene nitrate RO2 radical undergoes addition of NO to form a di-nitrate product, called
‘OH-apN2O6’ in the mechanism (Equation 6). As Spittler et al. (2006) stated, while this may not be significant in heavily forested areas, this pathway may be more important in high-NOx
regions such as areas with heavy vehicle traffic. NO3 chemistry also becomes more
significant at night, when the lack of sunlight makes reactions with the OH radical minimal. In the original mechanism, RO2 radical cross reactions were limited due to limitations
15
each other. MORPHO allows for this to be represented quite simply. All RO2s were
combined into a scalar value called “RO2” (Leungsakul et al., 2005). Multiplying the rate
constant of a reaction by this value is the equivalent of having the reactant in each reaction react with the entire group “RO2”. This process was performed for all RO2 cross reactions,
combining a number of reactions. These equations can be seen in R[AP_54] to R[AP_61] in Appendix B.
To update rates for the α-pinene mechanism, important reactions were first compared with the Master Chemical Mechanism v3.1 (MCMv3.1). MCMv3.1 provides comprehensive experimental reaction rates for each major reaction. MCMv3.1 is the most explicit mechanism out of all widely used mechanisms. In MCMv3.1, in the case that a rate of reaction has not been experimentally determined, a generic rate is assigned. For example, MCMv3.1 has a generic rate constant for all NO + RO2 reactions is 2.7E-12*EXP(360/T).
Similarly, there are universal rate constants for RO2 + HO2 reactions, RO2 + NO3 reactions
(Jenkin et al., 1997; Saunders et al., 2003).
In addition to MCMv3.1, the IUPAC Subcommittee for Gas Kinetic Data Evaluation compares all experimentally derived rate constants for the main, important reactions of VOCs and atmospheric oxidants. For α-pinene, IUPAC publishes rate constants for reactions with O3, OH, and NO3. IUPAC also publishes rate constant data for the main α-pinene
photo-oxidation product, pinonaldehyde. The database includes rate constants for the reaction of pinonaldehyde with O3, OH, and NO3. Several rate constants in the 2001 α-pinene reaction
16
All of these additions were necessary to keep the mechanism up to date. However, they did not create a significant amount of additional O3. Even with the inclusion of these
mechanisms, the model was still under predicting O3 in experiments with low concentrations
of α-pinene, as shown later in the Results and Discussion section. A few changes did influence the amount of O3 produced. These changes are outlined below.
Another change to the gas-phase α-pinene mechanism was an adjustment in the representation of acetone. Previously, acetone was represented as a dead-end product (Kamens et al., 2001). It was explicitly created, but did not react further. This original α-pinene mechanism was coupled with CB4, which did not include acetone reaction chemistry (Gery et al., 1989). However, CB05 includes atmospheric acetone chemistry, where one molecule of acetone has the same reactivity as three PAR, or three singly-bonded one-carbon atom components (Yarwood et al., 2005). All acetone molecules were converted to PAR by multiplying the stoichiometric coefficient of the acetone by three. This allows for the simulation of acetone reacting with oxidants in the atmosphere, as it would in reality. Although acetone is relatively long-lived in the atmosphere, a small amount of acetone oxidation does occur. This means that ultimately, the change of the species from one acetone to three PAR increases O3 production, as happened in this case.
Reaction R[AP_64] was added to the mechanism to simulate the decomposition of the α-pinene organic nitrate to NO2 and pinonaldehyde (Equation 7). This change was made to
try and increase O3 production from the model, as the photolysis of NO2 can create O, which
reacts with O2 to create O3. This only slightly increased the overall production of O3. The rate
17
raised to 1.5E-11, to try and produce as much NO2 as possible without affecting the
production of PAN and other nitrates. This value is the upper limit of this rate constant; if raised any more, the solver was unable to compile the mechanism.
R[AP_4] = 'apNO3-oo' + NO 0.81*NO2 + 0.19*'OH-apN2O6' (6)
+ 0.81*'OH-apNO3' + 0.81*HO2 @4.10E-12*EXP(180/TK)
R[AP_64] = 'OH-apNO3' + OH NO2 + pinald @1.5E-11 (7)
Table 2. Changes to Rate Constants from MCMv3.1
Reaction Rate was: Rate changed to:
R[AP_19] 2.60E-13*EXP(1250/TK) 2.65E-13*EXP(1300/TK) R[AP_27] 4.10E-12*EXP(180/TK); 7.15E-12*EXP(290/TK)
R[AP_64] Did not exist 1.5E-11
Table 3. Changes to Rate Constants from the IUPAC: Subcommittee for Gas Kinetic Data Evaluation
Reaction Rate was: Rate changed to:
R[AP_3] 3.50E-13*EXP(818/TK) 1.2E-12*EXP(490/TK)
R[AP_23] 9.1E-11 3.9E-11
R[AP_26] 5.39E-14 2.0E-14
Adjustments were also made to the particle-phase portion UNC’s α-pinene oxidation mechanism. Part8 and part9, two new particle-phase products, were added. Part8 is the partitioning product of ‘pre-tri’, the new pinonic acid oxidation product with thee carboxylic acid groups. Part9 is the partitioning product of the α-pinene di-nitrate, called ‘OH-apN2O6’ in this mechanism, which was produced in R[AP_4], shown in Equation 7 above.
Besides the addition of these two reactions, changes were made to the partitioning constants for all particle-phase products. This includes both kon, the rate of partitioning to the
particle phase, and koff, which is the rate of partitioning back to the gas phase. These were
18
calculate the vapor pressure and change in entropy of the reaction, or ∆S. Partitioning rate constants were also calculated for the two new particle-phase products.
One significant change from the original mechanism is the inclusion of temperature-dependant rate constants for partitioning to the particle phase. Kp, the ratio of partitioning
onto and off of the particle phase was calculated using the molecular weight, temperature, and estimated vapor pressure of the species at that temperature, as described above. koff was
calculated using the temperature and estimated vapor pressure of each species as described in Equations 4 and 5. For the calculation of kon, a different koff was determined for each
temperature and multiplied by its corresponding Kp. β is the ratio of Boltzmann’s constant to
Planck’s constant, and is only dependant only these two constants and temperature. Since the ratio is much larger than temperature, there was not a significant difference in β over the temperature range, and an average β was used for koff. In the original mechanism only koff
was temperature-dependent. Even from calculating kon at different temperatures, it was clear
that there was temperature dependence to partitioning onto the particle phase. However, there is no direct calculation to determine a temperature-dependant kon. To work around this,
temperature was plotted against the rate constant, and an exponential curve was fit to the plot. This exponential equation became the new temperature-dependant rate constant for kon.
19
Table 4. Partitioning Constants for all Particle-Phase Species
kon koff
part 2.198E-4*EXP(-6568/TK) 6.2167E12*EXP(-10142/TK) part1 2.66E-5*EXP(-6320/TK) 6.2167E12*EXP(-9392/TK) part2 1.889E-6*EXP(-5030/TK) 6.2167E12*EXP(-8693/TK) part3 5.91E-6*EXP(-6160/TK) 6.2167E12*EXP(-8886/TK) part4 1.259E-5*EXP(-6230/TK) 6.2167E12*EXP(-9095/TK) part5 3.309E-5*EXP(-3030/TK) 6.2167E12*EXP(-9507/TK) part6 5.353E-5*EXP(-6209/TK) 6.2167E12*EXP(-10200/TK) part7 2.904E-5*EXP(-5940/TK) 6.2167E12*EXP(-8455/TK) part8 1.245E-2*EXP(-7070/TK) 6.2167E12*EXP(-11564/TK) part9 3.737E-2*EXP(-7250/TK) 6.2167E12*EXP(-12039/TK)
Ultimately, since the method to calculate boiling points of each species is based on approximate values for each functional group, both β and Ea are just estimations. It should be
noted that experimental values for kon and koff can be one or two orders of magnitude higher
20 Chapter IV
RESULTS AND DISCUSSION
α-Pinene + )Ox Gas-Phase Mechanism Simulations and Comparisons
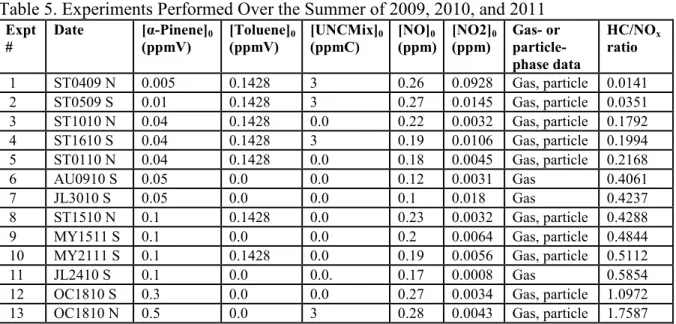
A total of thirteen experiments were modeled for testing the gas-phase α-pinene oxidation mechanism and included α-pinene alone or mixed with toluene and/or HCMix. All of the experiments are listed below in Table 5. Table 6 shows the initial conditions for two experiments from 1999 which were used to develop the original mechanism. Experiments included initial α-pinene concentrations ranging from 0.005 to 0.5 ppmV α-pinene, and initial NOx concentrations ranging from 0.1 to 0.3 ppmV. All experiments with toluene used 0.143
ppmV toluene as the initial concentration, and all experiments with HCMix started with 3 ppmC HCMix. The experiments in this study are split into three categories: 1) α-pinene and NOx only; α-pinene, 2) toluene, and NOx; and 3) α-pinene, toluene, HCMix, and NOx. The
experiments in both of these tables are ordered from lowest HC/NOx ratio to highest HC/NOx
ratio. The HC/NOx ratio is the ratio of initial concentration of α-pinene to initial mixing ratio
21
Table 5. Experiments Performed Over the Summer of 2009, 2010, and 2011
Expt #
Date [α-Pinene]0 (ppmV)
[Toluene]0 (ppmV)
[U)CMix]0 (ppmC)
[)O]0 (ppm)
[)O2]0 (ppm)
Gas- or particle- phase data
HC/)Ox ratio
1 ST0409 N 0.005 0.1428 3 0.26 0.0928 Gas, particle 0.0141
2 ST0509 S 0.01 0.1428 3 0.27 0.0145 Gas, particle 0.0351
3 ST1010 N 0.04 0.1428 0.0 0.22 0.0032 Gas, particle 0.1792
4 ST1610 S 0.04 0.1428 3 0.19 0.0106 Gas, particle 0.1994
5 ST0110 N 0.04 0.1428 0.0 0.18 0.0045 Gas, particle 0.2168
6 AU0910 S 0.05 0.0 0.0 0.12 0.0031 Gas 0.4061
7 JL3010 S 0.05 0.0 0.0 0.1 0.018 Gas 0.4237
8 ST1510 N 0.1 0.1428 0.0 0.23 0.0032 Gas, particle 0.4288
9 MY1511 S 0.1 0.0 0.0 0.2 0.0064 Gas, particle 0.4844
10 MY2111 S 0.1 0.1428 0.0 0.19 0.0056 Gas, particle 0.5112
11 JL2410 S 0.1 0.0 0.0. 0.17 0.0008 Gas 0.5854
12 OC1810 S 0.3 0.0 0.0 0.27 0.0034 Gas, particle 1.0972
13 OC1810 N 0.5 0.0 3 0.28 0.0043 Gas, particle 1.7587
Table 6. Two experiments performed in 1999 used for development of original mechanism
Expt #
Date [α-Pinene]0 (ppmV)
[Toluene]0 (ppmV)
[U)CMix]0 (ppmC)
[)O]0 (ppm)
[)O2]0 (ppm)
Gas- or particle-phase data
HC/)Ox ratio
14 OC3099 N 0.94 0.0 0.0 0.48 0.002 Gas, particle 1.9502
15 JN0999 N 0.98 0.0 0.0 0.43 0.002 Gas, particle 2.2685
The kinetics simulation package, MORPHO, was used to simulate these experiments with the updated mechanism, as well as with the original 2001 mechanism (Kamens et al., 2001). Ambient pressure was set to be equal to 1 atmosphere, or 101,325 Pascals. The output of each simulation included gas-phase concentrations of O3, NO, NO2, and HONO, among
others. Real-time temperature was also a variable output at each time step. The output of each model simulation can be plotted against time and compared to data from the smog chamber.
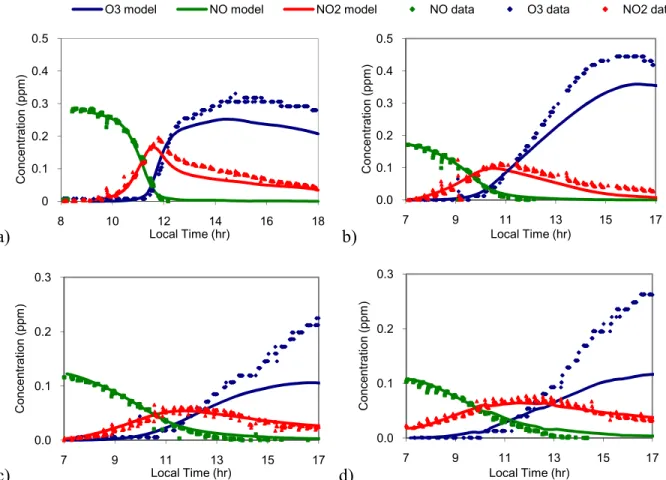
The plots in Figure 2, with α-pinene concentrations ranging from 0.05 to 0.3 ppmV, give an idea of how the new UNC mechanism performs with only initial concentrations of α-pinene and NOx. Comparing these figures, it seems that the model does a better job of
22
likely important to consider the initial HC/NOx ratio. The initial HC/NOx ratio is simply the
ratio of initial α-pinene concentration to initial NOx concentration. The experiments from
Figure 2b, Figure 2c, and Figure 2d all had HC/NOx ratios of approximately 0.5, while the
experiment from Figure 2a had a HC/NOx ratio of 1. This could be important, because the
experiments with a HC/NOx ratio of 0.5 underestimated O3 production by approximately
50%. The experiment with the HC/NOx ratio of 1 had a much closer estimation of maximum
O3 production, with the model estimating to about 80% of the data. The two experiments
(Kamens et al., 2001) that the original mechanism was based on both had HC/NOx ratios that
were greater than 1 (2.26 and 1.95). One reason for the difference in O3 production could be
due to unknown α-pinene and NO chemistry. A HC/NOx ratio of 0.5 means that the initial
concentration of NOx was twice as high as the initial concentration of α-pinene , while the
HC/NOx ratio of 1 means that initially NOx and α-pinene were present in equal
concentrations. Another reason for the difference in O3 production could be an issue in the
way which the model represents or deals with PAN chemistry. Differences in produced O3
levels due to the effect of HC/NOx ratios have been documented before, and a similar
discrepancy exists in models as well (Zhang et al., 2011). In this case, a difference in NO or NO2 chemistry, either not included in the model or not yet known, could explain the
difference in O3 production. Figure 3 shows similar plots for the same experiments, created
using the original 2001 mechanism. The average relative error in O3 production went from
33% using the original mechanism to 25% using the updated mechanism. The updated mechanism does well early in the experiment, around 11:00 am, when O3 is still rising. The
original mechanism predicts this increase in O3 happening more slowly. The updated
23
clear that both the modified and original UNC mechanisms grossly underestimate O3 as
initial experimental α-pinene concentrations are reduced from 0.3 to 0.05 ppmC. It may be important to note that chemiluminescence-based O3 monitors, like the one used for the
experiments in this study, can be affected by concentrations of water vapor (Kleindienst et al., 1993), which can cause a positive increase in detected ozone. Although neither of these mechanisms predicts O3 formation well, there does seem to be a difference between the two,
with the updated mechanism predicting an O3 formation that is on average 9% higher than
that using the original mechanism.
a) b)
c) d)
Figure 2. Model (lines) and data (points) gas-phase results of four α-pinene + NOx
experiments using the updated UNC mechanism. a) Experiment 12: 0.3ppm α-pinene + 0.3ppm NOx, b) Experiment 11: 0.1ppm α-pinene + 0.2ppm NOx, c) Experiment 6: 0.05ppm
α-pinene + 0.1ppm NOx, d) Experiment 7: 0.05ppm α-pinene + 0.1ppm NOx.
O3 model NO model NO2 model NO data O3 data NO2 data
0 0.1 0.2 0.3 0.4 0.5
8 10 12 14 16 18
C
o
n
c
e
n
tr
a
ti
o
n
(
p
p
m
)
Local Time (hr)
0.0 0.1 0.2 0.3 0.4 0.5
7 9 11 13 15 17
C
o
n
c
e
n
tr
a
ti
o
n
(
p
p
m
)
Local Time (hr)
0.0 0.1 0.2 0.3
7 9 11 13 15 17
C
o
n
c
e
n
tr
a
ti
o
n
(
p
p
m
)
Local Time (hr)
0.0 0.1 0.2 0.3
7 9 11 13 15 17
C
o
n
c
e
n
tr
a
ti
o
n
(
p
p
m
)
24
a) b)
c) d)
Figure 3. Model (lines) and data (points) gas-phase results of four α-pinene + NOx
experiments using the original 2001 mechanism. a) Experiment 12: 0.3ppm α-pinene + 0.3ppm NOx, b) Experiment 11: 0.1ppm α-pinene + 0.2ppm NOx, c) Experiment 6: 0.05ppm
α-pinene + 0.1ppm NOx, d) Experiment 7: 0.05ppm α-pinene + 0.1ppm NOx.
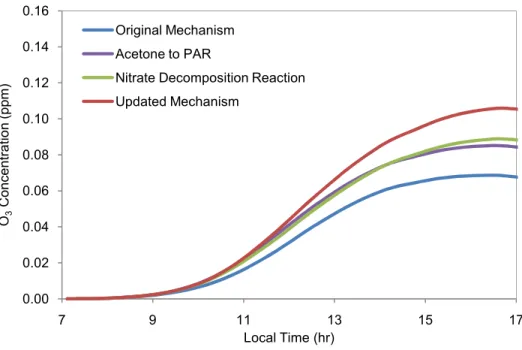
To determine the extent to which significant changes influenced O3 production, a
sensitivity analysis was performed. Each change was made to the original mechanism individually, and a time plot of O3 was produced to see the differences. The resulting O3
curves for the two significant changes, along with the O3 predictions of the original and final
mechanisms, are plotted for one experiment below in Figure 4. This image shows that the change of acetone to PAR components and the addition of the organic nitrate decomposition reaction account for almost all of the increase in O3 production from the original mechanism.
These were the two modifications that caused the most significant changes in O3 production.
O3 model NO model NO2 model NO data O3 data NO2 data
0 0.1 0.2 0.3 0.4 0.5
8 10 12 14 16 18
C
o
n
c
e
n
tr
a
ti
o
n
(
p
p
m
)
Local Time (hr)
0 0.1 0.2 0.3 0.4 0.5
7 9 11 13 15 17
C
o
n
c
e
n
tr
a
ti
o
n
(
p
p
m
)
Local Time (hr)
0 0.1 0.2 0.3
7 9 11 13 15 17
C
o
n
c
e
n
tr
a
ti
o
n
(
p
p
m
)
Local Time (hr)
0 0.1 0.2 0.3
7 9 11 13 15 17
C
o
n
c
e
n
tr
a
ti
o
n
(
p
p
m
)
25
Figure 4. Sensitivity comparison of two major changes to mechanism for Experiment 6: the change from acetone to PAR and the addition of the nitrate decomposition reaction
Table 7. Sensitivity analysis: maximum O3 with significant changes for Experiment 6 Change in Mechanism Maximum O3 (ppm)
Original mechanism 0.0687 Acetone to 3 PAR 0.0852 Addition of nitrate
decomposition reaction
0.0888 Updated mechanism 0.106
Ultimately, the only way to produce O3 is through photolysis and reaction of NO2,
HO2, and RO2s. RO2 stoichiometric values cannot be changed, since a carbon balance needs
to exist in each reaction. NO2 can only be produced in a reaction which involves a
nitrogen-containing compound. Stoichiometric coefficients for NO2 cannot be changed unless there is
an imbalance in nitrogen. Stoichiometric coefficients for HO2 in a number of reactions were
increased, and in some cases doubled or tripled, but this had little to no effect. Changes in products cannot be made just to increase O3 production if they do not preserve a chemical
0.00 0.02 0.04 0.06 0.08 0.10 0.12 0.14 0.16
7 9 11 13 15 17
O3
C
o
n
c
e
n
tr
a
ti
o
n
(
p
p
m
)
Local Time (hr) Original Mechanism
Acetone to PAR
Nitrate Decomposition Reaction
26
balance and if there is no data to suggest that the change might actually be occurring. This limits the number and types of changes that can be made.
The 2001 mechanism (Kamens et al., 2001) was originally based on two experiments from 1999, in which the initial α-pinene concentrations were just under 1 ppmV. Initial NOx
concentrations were between 0.4 ppm and 0.5 ppm. This 2001 mechanism reasonably modeled gas-phase chemistry from these 1999 experiments, but did slightly over predict O3.
Plots of the 1999 experiments and the model simulation produced by the updated mechanism (in MORPHO) can be found in Appendix C. Although the updated model comes close to what the 2001 version of the model, with another simulation package called PKSS, produced (Kamens et al., 2001), the initial concentrations of α-pinene in both these experiments are much higher than the experiments used in this work. From this, it is possible to conclude that the model from 2001 was built using high initial concentrations of α-pinene, and works best at those high concentrations. This mechanism, however, does not accurately predict O3
production at lower α-pinene concentrations.
Simulations of α-Pinene with Toluene and HCMix
Figure 5 shows simulations of experiments which fall into two categories: α-pinene + toluene + NOx (Experiment 5, Figure 5a), and α-pinene + toluene + HCMix + NOx
(Experiment 4, Figure 5b). From this figure, it can be seen that the mechanism predicts NO to NO2 conversion fairly well, as both NO and NO2 mechanism estimations fit NO and NO2
experimental data. However, for experiments without initial injections of HCMix, the production of O3 is almost always under predicted. On average, for experiments with toluene
27
mechanism with HCMix present has been shown to accurately predict O3 formation in the
presence of the hydrocarbon mix, it is likely that the discrepancy in O3 produced is due to
inaccuracies in the α-pinene mechanism (Kamens et al., 2011). In general, the mechanism performs well with α-pinene and toluene, and the best with α-pinene and both toluene and HCMix. It is likely that the mechanism fits experiments that include HCMix because of the high concentration of HCMix compared to both toluene and α-pinene. In this situation, the chemistry of HCMix and its products would dominate that of toluene and α-pinene. It is possible that the production of more RO2 radicals from HCMix would compete with RO2
radicals produced from a-pinene for reactions with NO, leading the experiment to act more like one in which the HC/NOx ratio is higher. Overall, the maximum O3 simulation error for
the UNC model for all experiments is between -54% and 25%. The only simulation with a positive relative error is OC1810N, which started with the highest initial α-pinene concentration in this study, and also included HCMix.
a) b)
Figure 5. Model and data gas-phase results of experiments with α-pinene and toluene or HCMix using the updated UNC mechanism. a) Experiment 5: 0.04ppmV α-pinene + 0.1429ppmV toluene + 0.2ppm NOx, b) Experiment 4: 0.04ppmV α-pinene + 0.1429ppmV
toluene + 3ppmC HCMix + 0.2ppm NOx
O3 model NO model NO2 model NO data O3 data NO2 data
0.0 0.1 0.2 0.3 0.4 0.5 0.6
7 9 11 13 15 17
C
o
n
c
e
n
tr
a
ti
o
n
(
p
p
m
)
Local Time (hr)
0.0 0.2 0.4 0.6 0.8 1.0
7 12 17
C
o
n
c
e
n
tr
a
ti
o
n
(
p
p
m
)
28
Inter-comparison of Common Mechanisms
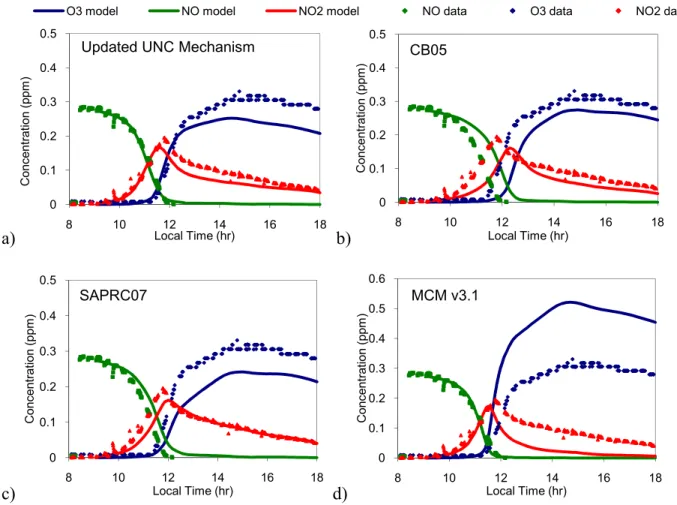
The gas-phase portion of the UNC mechanism was compared with other commonly used mechanisms, including MCMv3.1, SAPRC07, and CB05. Time concentration profiles of O3, NO, and NO2 were generated for each experiment. The gas-phase concentration
profiles from all four mechanisms for Experiment 12 are shown in Figure 6. Similar plots for each experiment were used to compare three factors: maximum O3, NO-NO2 crossover time,
and the O3 slope. Examples of the comparisons are shown below in Figure 7. As Figure 7a
shows, the UNC mechanism did a reasonable job of predicting maximum O3 production. It
does, however, under predict O3 for most experiments, as do CB05 and SAPRC07;
MCMv3.1 was the only mechanism that over predicted O3. The median of the relative errors
was smallest for the UNC mechanism, at -25.6%. As CB05, SAPRC07, and MCMv3.1 do not represent particle-phase chemistry, these mechanisms did not account for ozone deposition onto particles. Ultimately, this decreases O3 loss, which makes the mechanism
appear as if it produces more O3. This process, however, is represented in the UNC
29
a) b)
c) d)
Figure 6. Gas-phase model performances for Experiment 12 using a) updated UNC mechanism, b) CB05, c) SAPRC07, and d) MCMv3.1
O3 model NO model NO2 model NO data O3 data NO2 data
0 0.1 0.2 0.3 0.4 0.5
8 10 12 14 16 18
C
o
n
c
e
n
tr
a
ti
o
n
(
p
p
m
)
Local Time (hr)
Updated UNC Mechanism
0 0.1 0.2 0.3 0.4 0.5
8 10 12 14 16 18
C
o
n
c
e
n
tr
a
ti
o
n
(
p
p
m
)
Local Time (hr)
CB05
0 0.1 0.2 0.3 0.4 0.5
8 10 12 14 16 18
C
o
n
c
e
n
tr
a
ti
o
n
(
p
p
m
)
Local Time (hr)
SAPRC07
0 0.1 0.2 0.3 0.4 0.5 0.6
8 10 12 14 16 18
C
o
n
c
e
n
tr
a
ti
o
n
(
p
p
m
)
Local Time (hr)
30
a)
b)
c)
Figure 7. Relative errors of UNC mechanism and 3 other commonly used mechanisms. Relative errors for individual experiments (green) and mean relative errors (black) for a) maximum O3 measurements b) NO-NO2 crossover time, c) O3 slope.
-100% -80% -60% -40% -20% 0% 20% 40% 60% 80% 100%
M
a
x
im
u
m
O
3
R
e
la
ti
v
e
E
rr
o
r
UNC CB05 SAPRC07 MCMv3.1
-25% -20% -15% -10% -5% 0% 5% 10% 15% 20% 25%
C
ro
s
s
o
v
e
r
T
im
e
R
e
la
ti
v
e
E
rr
o
r
UNC CB05 SAPRC07 MCMv3.1
-300% -200% -100% 0% 100% 200% 300%
O3
S
lo
p
e
R
e
la
ti
v
e
E
rr
o
r
31
The UNC mechanism performs better for the NO-NO2 crossover and O3 slope metrics
than the other mechanisms as well. The NO-NO2 crossover time gives an idea of how fast the
conversion of NO to NO2 is occurring, which gives an overall idea for the speed of the
mechanism. For NO-NO2, a positive relative error means that the model crossover time is
later than the data, and a negative relative error means that the model time is earlier than the data. The median values for the UNC mechanism are closest to zero for crossover time. This is expected, since all initial HONO concentrations were set to the level that was optimal for the UNC mechanism. There were a few cases for which the UNC mechanism had too fast of a conversion of NO to NO2, which is seen by the negative relative errors in Figure 7b. For
those simulations in which the NO-NO2 crossover time was occurring to quickly, HONO had
already been reduced to an initial concentration of zero. The O3 slope metric is the slope of
the initial rise in O3. From Figure 7c, MCMv3.1 is estimating the rate of O3 production to be
too high, while the other three mechanisms perform similarly predicting the rise is O3 a little
more slowly.
In general, it seems as if the UNC mechanism and MCMv3.1 do the best job out of the four mechanisms of predicting O3 production and representing NO to NO2 chemistry. The
UNC mechanism performed best for the simulations including HCMix. On the other hand, MCMv3.1, best predicted maximum O3 in those experiments, which had only α-pinene and
32
Particle-Phase Mechanism Comparison
All experiments except for numbers 6, 7, and 11 had particle-phase data available through an SMPS system, and particle production was modeled with the UNC mechanism. In all figures, the model output value of total suspended particulates (TSP) is equal to the sum of individual particle-phase products (called ‘part’ through ‘part7’, includes ‘part8’ and ‘part9’ for updated mechanism), along with seed (initial background seed) and seed1 (oligomer products). In all simulations, background aerosol was represented in the model as an initial injection of seed, allowing for a surface for initial partitioning. This initial value was adjusted to match the background seed concentration from DMA data. The original UNC mechanism (Kamens et al., 2001), as shown in Figure 8 for the simulations OC1810N and OC1810S, did not fit data at lower α-pinene concentrations. Although the original 2001 UNC mechanism estimated SOA production accurately 1999 experiments (Kamens et al., 2001), it underestimated the total amount of SOA produced by the experiments performed more recently, all of which had lower concentrations of α-pinene. Figures 9 and 10, below, show how the updated UNC mechanism fit particle-phase data. In all cases, initial seed was between 3.5 µg/m3 and 35 µg/m3.
The experiments OC1810N and OC1810S were modeled using the original mechanism, and as shown in Figure 8, the original mechanism failed to capture the trend of the data. The updated mechanism, shown in Figure 9, did a better job at capturing this and fitting α-pinene + NOx data. In Figure 9b, the updated mechanism actually overestimates O3
33
greater when initial NOx concentrations are high compared to hydrocarbons, or when the
HC/NOx ratio is low. This means that it fits most of the experiments in this data set, but could
overestimate SOA production in scenarios where PAN, and NOx chemistry in general, is
working under different conditions. Figure 10 shows that the updated UNC model also fits particle phase data well for a variety of conditions. The scales for each plot in this figure have been adjusted to fit the data. The immediate initial jump in SOA growth in the model is due to water uptake on background seed particles in the toluene mechanism. The evaporation of this particle-phase water as the temperature rises in the morning is depicted in the data as the drop in TSP, and this is captured by the model. Additionally, in most cases, the model captured the particle loss in the evenings which is likely due to particle losses to the walls. The increase in TSP in the Figure 8, modeled using the original mechanism, is unintentional and thought to be an error in how the solver sums this particular value. Ideally, the value of TSP should decrease after reaching the maximum value. TSP is properly depicted in Figure 9. A solver error also is the cause of the bump in estimated TSP in Figure 10b.
a) b)
Figure 8. Model (lines) and data (points) particle-phase results using the original 2001 mechanism for a) Experiment 13: 5ppmC α-pinene + 3ppmC HCMix + 0.3ppm NOx and b)
Experiment 12: 3ppmC α-pinene + 0.3ppm NOx.
Model TSP SMPS Data
0 200 400 600 800 1000 1200 1400 1600
8 10 12 14 16 18
T
S
P
(
µ
g
/m
3
)
Local Time (hr)
0 100 200 300 400 500 600
8 10 12 14 16 18
T
S
P
(
µ
g
/m
3
)
34
a) b)
Figure 9. Model (lines) and data (points) particle-phase results using the updated UNC mechanism for: a) Experiment 13: 5ppmC α-pinene + 3ppmC HCMix + 0.3ppm NOx and b)
Experiment 12: 3ppmC α-pinene + 0.3ppm NOx
a) b)
c)
Figure 10. Model (lines) and data (points) particle-phase results of experiments with different initial conditions using the updated UNC mechanism for a) Experiment 9: 0.1ppmV α-pinene + 0.2ppm NOx, b) Experiment 5: 0.04ppmV α-pinene + 0.1429ppmV toluene + 0.2ppm NOx,
c) Experiment 4: 0.04ppmV α-pinene + 0.1429ppmV toluene + 3ppmC HCMix + 0.2ppm NOx
Model TSP SMPS Data
0 400 800 1200 1600 2000
8 10 12 14 16 18
T
S
P
(
u
g
/m
3
)
Local Time (hr)
0 200 400 600 800
8 10 12 14 16 18
T
S
P
(
u
g
/m
3
)
Local Time (hr)
Model TSP SMPS Data
0 5 10 15 20 25 30
8 10 12 14 16 18
T
S
P
(
u
g
/m
3
)
Local Time (hr)
0 10 20 30 40 50 60
7 9 11 13 15 17
T
S
P
(
u
g
/m
3
)
Local Time (hr)
0 20 40 60 80 100 120
8 10 12 14 16 18
T
S
P
(
u
g
/m
3
)
35
The updated UNC mechanism was also used to model the SOA produced from the experiments from 1999, with the general result of over predicting SOA production. The results of these two simulations can be seen in Appendix C. It is possible that SOA is over estimated for these experiments because of a discrepancy with the way the model works. The high concentration of hydrocarbons compared to NOx means that RO2 chemistry will
predominate, leading to the production of more SOA as expected. For the cases in this data set, the chemistry of NOx and RO2 is more predominant than that of RO2 cross reactions.
These scenarios are different for different HC/NOx ratios and this could be a reason why each
model only fits a certain data set.
Simulation of α-pinene Particle-Phase Products
36
Figure 11. GC/MS TIC for Experiment 13 Filter 2 with pinonic acid, pinic acid, pinonaldehyde, and oxypinonaldehyde peaks labeled.
a) b)
Figure 12. Data (symbols) and model estimations (lines) of particle phase pinonic acid from aerosol filter samples for a) Experiment 13 and b) Experiment 12.
The results for these experiments are shown in Figure 12. Each point represents the mass concentration from the filter. For both filters, average mass concentration of pinonic acid was set to the midpoint of the time period during which the filters were pulled. As these are average times, and aerosol concentration changed quickly over both time periods, there may be errors associated with the point in time at which each measurement was assigned.
0.00 0.02 0.04 0.06 0.08 0.10 0.12
9 11 13 15 17
m
g
/m
3
Time (hr)
Model Pinonic Acid Filter Pinonic Acid
0.00 0.01 0.02 0.03
9 11 13 15 17
m
g
/m
3
Time (hr)
Model Pinonic Acid Filter Pinonic Acid
Pinonaldehyde
Pinic Acid Oxypinonaldehyde
37
Error bars for the measurements of mass concentration for each filter also have associated errors, shown by the error bars. The percent error is a combination of the following: error in the sample pump volume used for obtaining the filter sample (±10%, 2 standard deviations), error in the balance used to measure filter masses (±1%), error in the GC/MS, determined from the error in pinoinc acid standards (±0.26%). The reasonable closeness of the filter data to the model, with associated errors, lends some validity to the updated particle-phase model; however, more filter samples from different time points are needed to fully evaluate the performance of the particle-phase model output.
Although standards were not available for other significant α-pinene oxidation products, relative retention times based on previous work (Jaoui et al,. 2001) could be determined in relation to the pinonic acid peak in that work. Relative retention times, or the ratio between two peaks, will be approximately the same for every chromatogram. Retention times are dependent upon volatility, so relative times of elution will be the same for each chromatogram. Using these relative retention times, elution times for a few other products could be calculated, based on the known elution time for the pinonic acid peak. Using this method, and their respective mass spectra, the following peaks were identified: pinic acid, pinonaldehyde, and oxypinonaldehyde. While we cannot determine average concentrations for these species, it is significant to know with certainty that each of these species were also produced. This at least allows some confidence in knowing that these products were actually produced and in amounts relatively close to what the model suggests.
38
next highest product created. Pinald-PAN is the peroxyacyl nitrate product produced from α-pinene photo-oxidation. These compounds are very similar to peroxyacetyl nitrate (PAN), in that they are a reservoir for NO2, and at high temperatures will dissociate into an RO2 radical
and NO2. This is a significantly higher amount of pinald-PAN produced than the 1999
experiments (Kamens et al., 2001). The change in pinald-PAN production is due to adjusting the exponential portion of partitioning rates in the mechanism. This value was changed by less than 10%. It is difficult to determine whether or not the model estimations are accurate since PANs will decompose to an RO2 and NO2 at high temperatures. The GC has an FID
and the GC-MS has an EI source, both of which exceed the temperature at which PAN-like products start to dissociate, making it difficult to determine real-time concentrations of these compounds. Every experiment modeled in this work showed the same trend of having high production of PAN-like species, this does not hold only for experiments with high HC/NOx
ratios.
Figure 13. Prediction of particle-phase products from Experiment 13.
0 50 100 150 200 250 300 350 400 450 500
9 11 13 15 17
C
o
n
c
e
n
tr
a
ti
o
n
(
µ
g
/m
3
)
Time (hr) part
part1
part2
part3
part4
part5
part6
part7
part8
39
To determine the effect that these changed partitioning rates had on pinald-PAN and total SOA production, rates of partitioning to and from the particle phase were both adjusted until SOA production for the 1999 experiments was much closer to total mass as determined by filters. The same mechanism with adjusted partitioning rates was used to model a few α-pinene + NOx experiments, and while pinald-PAN production was decreased, SOA had
decreased more than expected. Additionally, more gas-phase pinald-PAN means there will be more NO2 available, since pinald-PAN will decompose over the course of the afternoon
when temperatures are high enough. The additional available NO2 will increase O3
production throughout this period of time. While these partitioning rates meant that model SOA had a closer fit to 1999 SOA data, the model was over predicting O3 even more. The
1999 experiments modeled with the updated mechanism were already over predicting O3.
This shows that there may be different PAN and, indirectly, NO2 chemistry between the two
cases. There may a HC/NOx influence on α-pinene atmospheric chemistry, in that different
chemistry dominates when there is an excess of NOx or NOx is limiting, which is consistent
40 Chapter V
SUMMARY AND CONCLUSION
In this paper, an updated version of UNC’s α-pinene photooxidation model is presented. Changes to the mechanism include the inclusion of newly discovered α-pinene products and updated rate constants. Partitioning from gas to the particle phase was also updated, and partitioning for the new gas-phase products was included. To evaluate this model, a series of 13 outdoor chamber experiments were performed over three summers for experimental data. A number of these experiments include toluene, an important anthropogenically created VOC, and HCMix, a mix of common hydrocarbons. The purpose of including both toluene and HCMix was to simulate α-pinene chemistry in an urban environment, an issue which is becoming of greater importance, and to investigate SOA formation from α-pinene in the environment of another SOA forming hydrocarbon. In the case where toluene was also introduced initially to the chamber, the recently published toluene gas and particle-phase mechanism from Kamens et al. (2011) was used to simulate products. This mechanism includes both and particle-phase products. Important gas-phase species include O3, NO, and NO2. α-Pinene particle-phase products are split up into 9
species, and are combined, along with background seed aerosol and oligomer products, to give the value of TSP. When toluene was also an initial hydrocarbon, particle-phase products from the toluene mechanism were also included in TSP.
The mechanism simulates O3 production and NO-NO2 conversion fairly well. In cases
41
mechanism predicts only 50% of O3 production. This shows that there may be a difference in
RO2 chemistry when NO and NO2 are in excess. In the presence of HCMix, the mechanism
does very well, only under predicting ozone by 4.7%, on average. The accuracy of this mechanism within the hydrocarbon mixture suggests that it may be have potential uses in simulating complicated atmospheric chemistry. However, it is possible that RO2 cross
reactions dominate in the presence of HCMix, because of its high concentration compared to both toluene and α-pinene. The RO2 chemistry of HCMix is not described in as much detail
as that of toluene and α-pinene, because HCMix components were inputted in CB05 terminology, which includes limited RO2 chemistry.
An inter-comparison of the gas-phase mechanism was performed with three other common atmospheric chemistry mechanisms, CB05, SAPRC07, and MCMv3.1. For each of the four mechanisms, three metrics were used to determine accuracy: maximum O3, NO-NO2
crossover time, and O3 slope. Overall, the UNC Mechanism performed the best for this set of
experiments. In general, MCMv3.1 overproduced O3, had too fast of an NO-NO2 crossover
time, and estimated the O3 production as increasing too quickly. SAPRC07 and CB05 both
under predicted O3 production even more than the UNC mechanism, and converted NO to
NO2 slower than the UNC mechanism.
It seems possible that the UNC mechanism (as well as CB05 and SAPRC07) is missing a few crucial reactions involving NO and NO2. When initial NOx concentrations
were high compared to initial α-pinene concentrations (a low HC/NOx ratio), the mechanism
did a poorer job predicting maximum O3 production. As the HC/NOx ratio increased, the