SPATIO-TEMPORAL FRAMEWORK FOR
INTEGRATIVE ANALYSIS
OF
ZEBRAFISH DEVELOPMENTAL STUDIES
This work was carried out under a grant from N.W.O. BioMolecular Informatics research program (BMI)
Spatio-Temporal Framework for Integrative Analysis of Zebrafish developmental studies Mounia Belmamoune.
Thesis Leiden University
SPATIO-TEMPORAL FRAMEWORK FOR
INTEGRATIVE ANALYSIS
OF
ZEBRAFISH DEVELOPMENTAL STUDIES
PROEFSCHRIFT
Ter verkrijgen van de graad van Doctor aan de Universiteit Leiden, op gezag van de Rector Magnificus Prof. mr. P.F. van der Heijden,
volgens besluit van het College voor Promoties te verdedigen op dinsdag 17 november 2009
klokke 15.00 uur
door Mounia Belmamoune
PROMOTIE COMMISSIE
Promotor
Prof. Dr. J. N. Kok
Co-promotor
Dr. Ir. F.J. Verbeek
Overige leden
Prof. Dr. H.P. Spaink Prof. Dr. T. Bäck Prof. Dr. G. Rozenberg
7
Table of Content
Chapter 1
1.1 Introduction...10
1.2 The Zebrafish Spatio-Temporal Framework...14
1.2.1 ZEBRAFISH AS A MODEL ORGANISM... 14
1.2.2 DEVELOPMENTAL ANATOMY ONTOLOGY OF ZEBRAFISH... 15
1.2.3 THE 3D ATLAS OF ZEBRAFISH... 15
1.2.4 THE GENE EXPRESSION DATA... 16
1.3 Outline of the thesis ...17
Chapter 2 Abstract...22
2.1 Introduction...24
2.2 Methods...28
2.2.1 CONCEPTUALIZATION... 29
2.2.2 RELATIONSHIPS SPECIFICATION... 30
2.2.3 KNOWLEDGE ACQUISITION... 33
2.2.4 FORMAL DESCRIPTION... 34
2.3 Implementation...37
2.3.1 STANDALONE PRESENTATION OF DAOZ ... 39
2.3.2 INTEGRATION WITH OTHER RESOURCES... 41
2.4 Conclusion and Discussion ...41
2.5 Future work ...43
Chapter 3 Abstract...46
3.1 Introduction...47
3.2 3D Models Acquisition ...51
3.2.1 IMAGING METHODOLOGY... 51
3.2.2 NORMAL RESOLUTION... 52
3.2.3 HIGH RESOLUTION... 52
3.3 3D Models Annotation ...52
3.3.1 GRAPHICAL ANNOTATION... 55
3.3.2 TEXTUAL ANNOTATION... 55
3.4 3D models Pre-processing and Management ...56
3.5 Data Delivery: An interface for the Atlas database ...57
3.6 Results and Discussion...61
3.7 Future work ...64
Chapter 4 Abstract...66
4.1 Introduction...67
4.2 Material and Methods...72
4.2.1 PATTERN ANNOTATION... 72
4.2.2 SYSTEM ADMINISTRATION... 75
4.4 Results...78
4.5 Conclusion and Discussion ...82
Chapter 5 Abstract...86
5.1 Introduction...87
5.2 3D-VisQus Usability ...90
5.3 Users Analysis and System evaluation ...96
5.4 Conclusions and future work ...97
Chapter 6 Abstract... 100
6.1 Introduction... 101
6.2 Methods... 102
6.4 Results... 106
6.5 Conclusions and future work ... 112
Chapter 7 7.1 General overview ... 116
7.2 The Developmental Anatomy Ontology of Zebrafish... 116
7.3 The 3D Digital Atlas of Zebrafish ... 117
7.4 The Gene Expression Management System... 118
7.5 The 3D Visual Query System... 120
7.6 The GEMS: a mining tool for spatio-temporal patterns... 120
7.7 General conclusions ... 122
References ... 125
Samenvatting... 133
Publications ... 139
Presentations at International Events ... 141
9
CHAPTER 1
1.1 Introduction
The specific result of vertebrate embryonic development is the progression of structures over time, from a first apparition during the developmental process to mature structures (complex organs). Throughout such developmental process genes are expressed in complex and constantly changing anatomical patterns. For anatomists, it is critical to understand how such anatomical structures function, how they change to complex shapes and which genes are involved in such changing patterns. Bioinformatics is the science that focuses on the development and application of computational methods to organize, integrate, and analyze biological-related data to facilitate the workflow for biologists. In this context we developed a spatio-temporal framework for developmental studies. A spatio-temporal reference framework of standard anatomical information and patterns of genes expression is an important tool for any experimental organism in which form and function are of interest for developmental biology. The study of anatomy is an essentially three-dimensional (3D) attempt. Therefore, to increase the value of such spatio-temporal framework, data should describe the complex relationship between tissues in three-dimensional (3D) format.
The aim of the research described in this thesis is to establish an integrative 3D spatio-temporal framework with standard anatomical information (3D digital atlas) and gene expression information (3D in situ patterns of marker genes) for developing zebrafish embryo; this framework has to be designed in such a way to be transposed to other model systems.
11
(or structure) is annotated with a graphical contour (graphical annotation). This graphical annotation enables to detect the 3D outline of the annotated structures. Furthermore, to each structure in the 3D atlas an anatomical name is assigned (textual annotation) (cf. chapter 3).
The process of gene expression refers to the event that transfers the information content of the gene into the production of a functional product, usually a protein. To be valuable for developmental studies, a gene expression information resource should be documented by its temporal (when) and spatial (where) information. The experimental conditions (how) must also be part of the documentation process for an accurate interpretation of experimental observations. We followed this workflow to manage zebrafish 3D patterns of gene expression in the Gene Expression Management System (GEMS, cf. chapter 4). We established the GEMS that contains gene expression patterns organized and published to be readily accessed. Efforts are also ongoing in other model systems yielding to a large selection of gene expression databases such as MEPD (Henrich et al, 2005) for medaka and ZFIN (Zebrafish Information Network; http://zfin.org) for zebrafish. In the work presented here, we focused on 3D patterns of gene expression of zebrafish. This data is 3D with a spatio-temporal characteristic that provides the relation between gene expression (at a molecular level) and tissue differentiation (at an anatomical level). Such 3D representation of gene expression patterns gives molecular definitions for developmental components.
presentation according to the user’s needs. Furthermore, the 3D format of the patterns enables a detailed visualization and analysis of the spatial information of the expression patterns. For valuable framework, the challenge is to map gene expression data into the atlas. A key element will be a standard anatomical nomenclature for data description in both the 3D atlas and in situ gene expression data.
Bioinformatics has successfully demonstrated new approaches by computationally integrating various data sets such as by using standard descriptions, e.g. ontologies to annotate collected data. Data integration is defined as the process that combines data residing at different database systems and providing users with a unified view of these data (Lenzerini, 2005). Data integration has proven to be an effective strategy to extract biological meaning from heterogeneous data sets in both developmental research and other fields. In our research we applied this principle of data integration and we developed the Developmental Anatomy Ontology of Zebrafish (DAOZ, cf. chapter 2). The DAOZ is a key component of our information systems. It is a dictionary of anatomical terms derived from the staging series of (kimmel et al, 1993). Terms from the DAOZ are assigned to anatomical domains in the 3D atlas and are used by the GEMS as the standard nomenclature for data annotation and retrieval. This assignment represents the critical link between the atlas and the gene expression database (cf. chapter 5). The anatomical terms in the DAOZ are modeled hierarchically in different degrees of granularity. This data modeling enables complex queries to be readily performed for an intuitive data access and analysis.
13
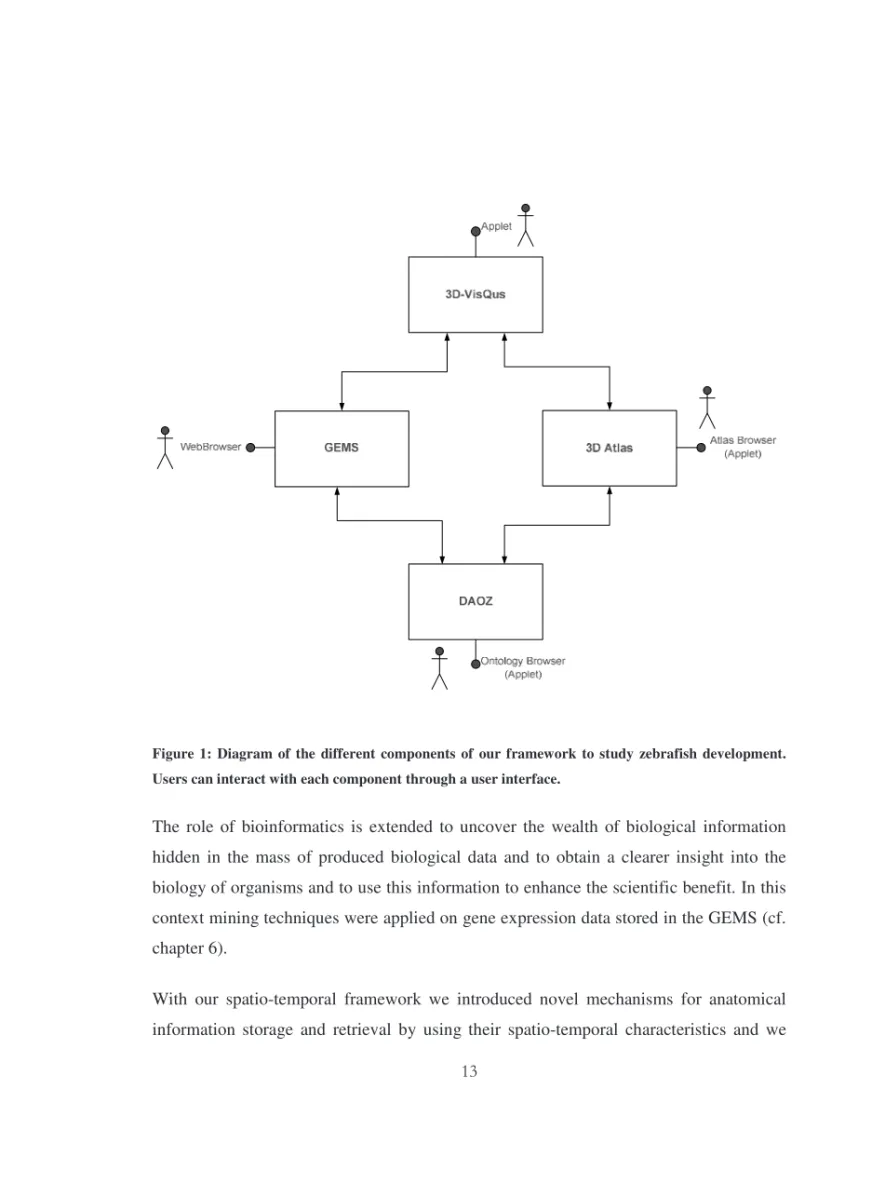
Figure 1: Diagram of the different components of our framework to study zebrafish development.
Users can interact with each component through a user interface.
The role of bioinformatics is extended to uncover the wealth of biological information hidden in the mass of produced biological data and to obtain a clearer insight into the biology of organisms and to use this information to enhance the scientific benefit. In this context mining techniques were applied on gene expression data stored in the GEMS (cf. chapter 6).
make these mechanisms available to the research community in the form of novel bioinformatics tools. These tools, database systems, enable patterns of gene expression to be analyzed within a spatial and temporal context consistent with the spatial and temporal developmental concept of the organism. These resources should be seen as a tool for the developmental research community to put gene expression data into the proper biological and analytical context, so that the developmental dilemma can successively be understood.
1.2 The Zebrafish Spatio-Temporal Framework
In this part we will present the zebrafish model organism and the different components of our spatio-temporal framework for the embryonic development of zebrafish.
1.2.1. Zebrafish as a model organism
15
1.2.2 Developmental Anatomy Ontology of Zebrafish
All along of our research was the principle of data integration applied. An aspect of integration is to make databases integrated. This integration can be achieved if data in different databases are annotated with a common terminology. Ontological concepts are usually applied to provide such common terminology for data annotation in a structured way. These concepts enable therefore information sharing among different information systems.
The Developmental Anatomy Ontology of Zebrafish (DAOZ) is the anatomical ontology that we developed on behave of our project. The anatomy is modelled hierarchically from body region to organ to structure in order to fit with the different degrees of abstraction in data capture and analysis. To the anatomical and temporal concepts we introduced new concepts of spatial and functional characteristics. In addition, we used different relationships to link DAOZ concepts with each other, i.e. aggregation, composition and association relationships. These relationships provide the opportunity for more complex queries to be performed. The anatomical terminology of the DAOZ is the same as this used inside the zebrafish community. Therefore, data annotated with concept from the DAOZ ontology can be linked to each other and to other resources and more importantly to the ZFIN resources.
1.2.3 The 3D atlas of zebrafish
3D model is the result of a 3D reconstruction from serial sections, i.e. 2D section images. Each section image is segmented in anatomical structures that are annotated graphically and semantically.
Users can access the atlas 3D models through a web-application. This application provides a portal interface to access complex anatomical data of the 3D atlas. Users can query the 3D atlas database without a prior knowledge of the exact anatomical terms. 3D models are, on the fly, assembled and presented according to the user requested queries.
1.2.4 The gene expression data
17
1.3 Outline of the thesis
The work presented in this thesis is based on a number of publications in scientific journals and international conferences. Here is an overview of the chapters discussed in this thesis and their related publications.
Chapter 2 describes the Developmental Anatomy Ontology of Zebrafish. This ontology contains anatomical description of the zebrafish over time. In this chapter we will discover how the anatomical concepts have been organized as an ontology. We will also shed light on how this ontology has been translated into a database to facilitate its presentation but more importantly to facilitate its task for annotation. This ontology was initially presented in:
• Y. Bei, M. Belmamoune and F. J. Verbeek, Ontology and image semantics in multimodal imaging: submission and retrieval, Proc. of SPIE Internet Imaging VII, Vol. 6061, 60610C1 C12, 2006.
A complete description of the ontology was published in:
• M. Belmamoune and F.J. Verbeek. Developmental Anatomy Ontology of Zebrafish: an Integrative semantic framework. Journal of Integrative Bioinformatics, 4(3):65, 2007.
In Chapter 3 the 3D digital atlas of zebrafish development is presented. This chapter is partially published in:
Verbeek, M.J. Vervoordeldonk, F.J. Vonk, F. Witte, H. Yuan and M.K. Richardson. Zebrafish development and regeneration: new tools for biomedical research. Int. J. Dev. Biol. (2009) 53: 835-850.
An advanced description of the 3D digital atlas of zebrafish development is presented in:
• M. Belmamoune, L. Bertens, D. Potikanond, R. v.d. Velde and F. J. Verbeek. The 3D digital atlas of zebrafish: 3D models visualization through the Internet. (Submitted, 2009).
In Chapter 4 we will present the Gene Expression Management System (GEMS). During embryonic development of the zebrafish, patterns of gene expression of marker genes are visualized from, but not restricted to, in situ hybridization experiments in combination with Confocal Laser Scanner Microscopy (CLSM). In this chapter we provide information about mechanisms of these patterns storage and retrieval. We will also give more details about the system design and implementation. The work presented here was initially published in:
• M. Belmamoune and F. J. Verbeek. Heterogeneous Information Systems: bridging the gap of time and space. Management and retrieval of spatio-temporal Gene Expression data. InSCit2006 (Ed. Vicente P. Guerrero-Bote), Volume I "Current Research in Information Sciences and Technologies. Multidisciplinary approaches to global information systems", pp 53-58, 2006.
The complete work has been published in:
19
We will present the 3D Visual query system (3D-VisQus) in Chapter 5. This system maps standard phenotype data in the 3D digital atlas of zebrafish with genotypic data in the Gene Expression Management System. The 3D-VisQus enables 3D models of the zebrafish embryo to be viewed, browsed and queried. From a visualized element in a 3D model, a user can send a visual query to the GEMS. Questions in the kind of how this system works and how it has been designed and implemented could be further answered in Chapter 5. This chapter is based on an early publication:
• M. Belmamoune, E. Lindoorn and F. J. Verbeek. 3D-VisQuS: A 3D Visual Query System integrating semantic and geometric models. InSCit2006 (Ed. Vicente P. Guerrero-Bote), Volume II "Current Research in Information Sciences and Technologies. Multidisciplinary approaches to global information systems", pp 401-405, 2006.
To further analyze gene expression data that are present in GEMS, mining workflows have been developed. We choose for association rules techniques to investigate the mining workflow services offered by the GEMS framework. Association rules techniques have been applied to uncover possible relations between genes. Association patterns are extracted from the GEMS database and could be directly integrated with each other for a primary comparison and analysis. The uniform annotation of the gene expression data with formal ontological metadata enables cross-reference with other resources. Therefore, cross-model system comparative studies and analysis of gene expression patterns is facilitated. For more details refer to Chapter 6. This chapter is based on the following paper:
21
CHAPTER 2
DEVELOPMENTAL ANATOMY ONTOLOGY OF
ZEBRAFISH: AN INTEGRATIVE SEMANTIC
FRAMEWORK
Based on:
M. Belmamoune and F.J. Verbeek. Developmental Anatomy Ontology of Zebrafish: an Integrative semantic framework.
Journal of Integrative Bioinformatics, 4(3):65, 2007.
Partially published in:
Y. Bei, M. Belmamoune and F. J. Verbeek Ontology and image semantics in multimodal imaging: submission and retrieval
Abstract
Integration of information is quintessential to make use of the wealth of bioinformatics resources. One aspect of integration is to make databases interoperable through well annotated information. With new databases one strives to store complementary information and such results in collections of heterogeneous information systems. Concepts in these databases need to be connected and ontologies typically are providing a common terminology to share information among different resources.
23
2.1 Introduction
In the life sciences, data integration is one of the most challenging problems that bioinformatics is facing. In extending on new research results researchers in the life sciences have to interpret many different types of information from a variety of biological resources. Unfortunately, this information is not easy to identify and access, one of the reasons can be attributed to the semantic heterogeneity and data formats used by the underlying systems.
In this chapter, we present our approach to take up the challenge of data integration. The key is to describe and manage biological concepts into an integrated framework, leading to improved cooperation and thereby increasing scientific benefit (Baldock and Burger, 2005). In our work, we focus on the integration of data associated with the zebrafish model organism. The zebrafish (Danio rerio) is an important model organism in developmental and molecular genetics in the context of fundamental as well as disease studies. In zebrafish, experiments have produced a considerable range and huge amount of data. This fact in itself has been acknowledged by the zebrafish community and a dedicated resource, i.e. Zebrafish Information Network (ZFIN; http://zfin.org), is developed and maintained.
In the past years we have studied zebrafish development and in support of our research we have developed two important information systems. The first system is the 3D atlas of zebrafish development (3D atlas, in short); a digital atlas consisting of virtual models of
25
The 3D atlas is the pivot in our work on developing a spatio-temporal framework for the zebrafish development; it serves as a reference for data submission and retrieval. A canonical number of developmental stages of the zebrafish are completely described as volumetric models in which every volume element is attributed to an anatomical structure. The atlas is built from serial sections portraying standard histology (Verbeek, et al, 2000 and 2002).
The GEMS is a database system for storage and retrieval of 3D spatio-temporal gene expression patterns in zebrafish including mechanisms for linking and mining. Detailed knowledge of both spatial and temporal expression patterns of genes is an important step towards analysis and understanding of complex networks governing changes during embryonic development (Meuleman et al, 2006). In our case, spatio-temporal gene expression patterns are generated through Fluorescent In Situ Hybridization (FISH) and whole-mount imaging (Welten et al, 2006) using the confocal laser scanning microscope (CLSM) resulting in 3D images.
we developed the Developmental Anatomy Ontology of the Zebrafish (DAOZ), a task-oriented ontology for annotation, retrieval and integration.
In life sciences quite a few ontologies have been developed in the model organism community. In parallel to these, the gene ontology (GO; http://www.geneontology.org/), supporting the annotation of attributes of gene products, was developed. Many of these ontologies are available from the Open Biological Ontologies resource (OBO; http://obo.sourceforge.net/) including comprehensive developmental and anatomical ontologies for many different model organisms as “Drosophila”, “Arabidopsis thaliana”, “Mouse” as well as an ontology for zebrafish development; i.e., the Zebrafish Anatomy Ontology (ZAO) (Sprague et al, 2006).
Our approach for handling developmental anatomy of zebrafish does not derogate the ZAO. It rather extends the ZAO with new some concepts and relationships. The DAOZ aims to provide conventions and a commonly accepted structured set of terms for annotating our research data; i.e., 3D images of in situ gene expression patterns. The DAOZ concepts and relationships have to supplement our 3D images with a structured annotation which is quintessential for data retrieval and mining. As a result, these annotations will enable additional comprehensive analysis of gene expression patterns during development.
27
In the context of our work, the classes and relationships that the ZAO encapsulates are judged not sufficient to facilitate annotation, reasoning and analysis of our 3D images. The ZAO concepts and relationships limit the options for describing the inter- and intra-relationships of anatomical structures. This limitation of concepts and properties limits their use for annotation and comparative anatomical analyses. To that end, the original vocabulary has been adapted to our requirements and enriched with additional concepts and relationships. The new concepts and relationships are intended to enable descriptions of the anatomical structures in accordance with their spatial location and functional system. These concepts and their associated relations will help to structure the annotations and in that manner enabling to analyze the gene expression patterns in larger units. This is especially useful for reasoning with and mining of the data.
Similar to other ontologies, the DAOZ consists of concepts and a set of relationships. The DAOZ is organized as a directed acyclic graph (DAG);such is required to find unique concepts paths and to prevent self referencing. The nodes in the graph represent concepts and the edges joining the nodes represent relationships. Combining these relationships facilitates knowledge extraction and presentation. An important reason for using the DAOZ in annotation, apart from the consistency in the terminology for integration, is the structure in the concepts and the relations between the concepts. The relationships are intended to support retrieval of information and allow interpreting several gene expression patterns. Combining relationships also allows interpreting several gene expression patterns and obtaining information on co-localization and co-expression of genes within a common spatio-temporal framework. In this manner it can be possible to disclose “new” relations between genes.
schema with additional top level concepts i.e. functional system and spatial location aspects. The concepts functional system and spatial location provide these supplementary levels of abstraction extending the data semantic and subsequently encapsulating its functional and spatial conceptual model. These concepts enable to structure anatomical terms in units using a functional system and spatial location. Searching in the ontology for concepts to annotate data is, therefore, facilitated. The annotated images are structured in the same way as their ontological metadata. This structure enables to process the 3D images in larger units which is considered useful in reasoning and mining. To manage and use the DAOZ in a context of integration, we designed and built an ontology database. In this chapter, this database is further referred to as DAOZ. It was considered necessary to facilitate data annotation in both the 3D atlas and GEMS. Our task-oriented ontology enables interoperability and data sharing between our information system databases while cross-referencing to the ZAO is provided. Consequently, DAOZ permits integration of different information in the context of the embryonic development of the zebrafish, facilitating data analysis and knowledge extraction for presentation. The DAOZ is accessible through a user-friendly java applet.
The remaining part of this chapter is structured as follows: section 2 contains a detailed description of the adapted methods to develop the DAOZ. In section 3 conclusions and discussions are presented. Finally, section 4 describes our future work.
2.2 Methods
29
In this section we will describe the framework for the development of DAOZ, including conceptualization of the ontological model, relationships specification, knowledge acquisition, formal description and the subsequent choices of implementation, presentation and integration tools.
2.2.1 Conceptualization
The conceptualization phase involves identification of the key concepts in the ontology. First, we considered the anatomical structures as extracted from the staging series as our primary concepts. Second, we use temporal concepts i.e. development stages, to define anatomical terms within a range of developmental stages. For our research, however, we required an ontology that embodies more information about anatomical structures at varying degrees of granularity. Different levels of granularity enable organization of anatomical structures in units. Such organization permits integration of concepts and the objects that they describe at various levels of resolution. For this purpose, each of the anatomical terms is being evaluated and a number of paths to a certain term have been conceptualized. Two additional concepts were specified. First, specialization of functional system concepts that describe anatomical structures in relation to their functionality; e.g. ‘eye’ is described as a member of a functional system: ‘the visual system’. Second, the spatial location has been conceptualized to organize anatomical structures within a common spatial framework. This conceptualization describes the location of each anatomical domain; e.g. ‘eye’ could be described by its location in the head region. These two concepts enable to capture function and location of an anatomical structure and, as such, provide extra levels of representation for both anatomical structures as well as for our annotated images.
2.2.2 Relationships specification
We start by two hierarchical relations that were specified to describe the relationships between the various DAOZ concepts: generalization, i.e., ‘is_a’ relationship and aggregation, i.e., ‘part_of’ relationships (Patrick et al, 2006). The is_a relation specifies a generalization hierarchy between a child and its parent; e.g. ‘somite 5’is_a ‘stage of development’. With this relation a child term is linked to a broader concept. The is_a
relationship is characterized by the fact that each child term has a transitive relationship with its parents and children, that is, properties are inherited from parents to children downstream the hierarchy, but separate properties attributed to a child term are not propagated upstream the hierarchy.
31
In order to describe anatomical structures with properties associated with spatial location, functional system and temporal conceps, we specified four associative relationships: i.e., the located_at, belongs_to, starts_development_at and ends_development_at
relationships. These relationships are used to describe an anatomical term with its spatial location, functional system and developmental stages respectively. We defined each anatomical structure within a range of the appropriate developmental stages. To that end, temporal relations like starts_development_at and ends_development_at have been defined to specify time-point at which an anatomical structure appears and disappears from the process of development, respectively. Additionally, we exploit these temporal relationships to code the chronological lineage of anatomical structures during development. An anatomical structure may have several anatomical parents during its lifespan (cf. Figure 1) and therefore we coded the chronological lineage progress of each anatomical structure during its occurrence. Consequently, each anatomical term has been linked to a stage of development when it appears the first time as well as each time when its parent changes. Tracking the chronological changes over time allows following the lineage path of anatomical structures. Moreover, it enables additional reasoning about anatomical structures as well as the objects they describe.
The part_of relationship links two anatomical structures with each other; it attributes a specific spatial description at a fine level of granularity. We introduced the located_at
relationship to associate anatomical terms with a spatial description at a gross level of granularity. As such each anatomical structure is associated with a spatial location concept allowing for divide and conquest strategies. For example, specifically ‘retina’ is
e.g. ‘brain’ belongs_to ‘the central nervous system’ and ‘the central nervous system’ is
part_of’ ‘the nervous system’ then ‘brain’ belongs_to ‘the nervous system’ too.
The associative relationships have been specified in order to describe properties associated with various anatomical concepts. Furthermore, the aggregation (part_of), generalization (is_a) and the associatives relationships are binary relationships that imply irreflexivity i.e. no term has a relationship with itself; and asymmetry i.e. if ‘retina’ is
part_of ‘optic vesicle’ then ‘optic vesicle’ is not part_of ‘retina’ (cf. 2.4.2), this corresponds to a DAG.
The aggregation, generalization as well as the associative relationships aims to capture the form and the dynamic development of an anatomical structure in addition to its location and functional system.
33
presumptive brain
presumptive neural plate ectoderm
ectoderm presumptive brain
presumptive central nervous system
.
.
Figure 1: At ‘75% epiboly’ is the presumptive brain part of the ectoderm, while at stage ‘1 somite’ it
becomes part of the presumptive central nervous system.
2.2.3 Knowledge acquisition
We start by the anatomical and temporal concepts as well as their relationships. The anatomical structures and stages of development nomenclature were extracted from the staging series. Information describing anatomical structures by their relationship part_of,
2.2.4 Formal description
To give a more precise description of the ontology semantics, we define the concept of order (cf. 2.4.1). The concept of order is used to specify how to line up the ontology elements. Furthermore, we use 9 axioms to formalize the current representation of the DAOZ. These axioms are required as rules to check for the consistency of the ontology upon changes; as such these rules can be integrated in automated agents for ontology update (cf. 2.5).
The DAOZ consists of concepts and relationships that are organized as a DAG structure (cf. axioms 1; figure 2). In the DAG, nodes (concepts; cf. axiom 2) are linked by directed edges (relationships; cf. axiom 3). All relations imply asymmetry (cf. axioms 4) and irreflexibilty (cf. axiom 5). The part_of and is_a relationships are defined to link only attributes of the same concept type (cf. axioms 6) which means that two different attributes of different concept types could never be linked by a relationship like aggregation (part_of) or generalization (is_a). The part_of relationship has been modified to include time arguments in its usage to link anatomical structures concepts. (cf. axiom 7).
In a DAG each term could be linked to several parents. Therefore, each anatomical structure could be linked to other concept types thereby having more than one occurrence in the hierarchy. Anatomical structures could be associated to spatial locations, functional systems and developmental stages using the located_at, belongs_to,
starts_development_at and ends_development_at relations; respectively (cf axiom 8, 9).
Definition for order in ontology
35
2. ∀d1, d2, d3∈ S, if d1< d2 and d2 < d3, then d1 < d3(< is transitive).
Axioms underlying DAOZ
1. DAOZ is an ontology having a DAG structure.
2. A DAG G consists of two components: G = SN, SE with SN isthe set of nodes of
G and SE its set of edges (SE⊆SN×SN), such that for no node n∈ SN, there are edges in SE forming a path from n to n.
3. SN consists of four mutually disjoint subsets: SN = SA,ST,SL, SFs. Here SA is the set of anatomical term concepts, ST is the set of temporal concepts a.k.a. developmental stages, SL is the set of spatial locations and SFs is the set of functional systems.
4. SE consists of 6 types of edges a.k.a. relationships, where SE = is_a ∪part_of ∪ belongs_to ∪ starts_development_at∪ends_development_at∪ located_at.
a. ∀n1, n2∈ SN and e∈ SE if n1 e n2, then never n2 e n1. This means that
all relations imply asymmetry. For example: if ‘optic vesicle’ is
part_of ‘eye’ then never ‘eye’ is part_of ‘optic vesicle’
b. ∀n∈ SN and e ∈ SE thennever ne n.This means that all relations imply irreflexibility such that no concept has a relationship with itself. 5. ∀n1, n2 ∈ SN1 with SN1 = SA,ST,SL or SFs (n1 and n2 are two concepts of the
same subset) if n1 en2 with e∈ SE then e ∈ part_of ∨e ∈ is_a.
This means that the part_of and is_a are the only relationships linking two concepts of the same type (implying that an ordering between these exists). Consider two functional system concepts: the nervous system and the central nervous system; they only should be linked by the part_of relation such that ‘the central nervous system’ is part_of ‘nervous system’.
6. ∀n1, n2 ∈ SA, if n1 e n2and e∈ SE ∧e ∈ part_of then∃t ∈ ST such that n1 e’ t
If there is a part_of relation between two anatomical structures we need to incorporate the time constraint since parenthood of anatomical structure may change over time during development.
7. Let SN1; SN2 be SA,ST,SL or SFs such that SN1 ≠SN2.∀n1 ∈ SN1 if ∃n2∈ SN2
such that n1 e n2, where e∈ SE ∧e ∉ part_of’∧ e ∉ is_a.
This implies that the aggregation (part_of) and generalization (is_a) relations do not link concept types with other concept types. Thus an anatomical term can be linked to another concept type using only one of the associative relationships. For example, the only relation that links ‘head’ (a spatial location concept) and ‘eye’ (an anatomical structure) is the located_at relationship.
8. ∀n1 ∈ ST, SL or SFs and n2 ∈ SA, ¬∃ e∈ SE such that n1 en2.
Any anatomical term concept can be linked to another concept type using one of the associative relations. But there is no relation that links both concepts the other way around. The relations (edges) are always directed. For example we have ‘eye’ is
37
Figure 2: The diencephalon hierarchical organization to show the DAG structure of the anatomy
ontology. This structure is inherited by the annotated images, e.g. top left: msxb gene expression
pattern in a 24 hours post fertilization (hpf) zebrafish embryo, 2D projection of a 3D CLSM image.
3D model from the atlas (lower left: 2D view; lower right: 3D view of a 48 hpf. zebrafish embryo).
2.3 Implementation
could be easily linked to other systems and should enable complex queries to be performed to facilitate data extraction for annotation. The ontology format also should provide sufficient flexibility to permit regular updating without a need to modify the hierarchy. We therefore concluded that the anatomy ontology should be stored directly in a database, i.e. the DAOZ database.
The design of the DAOZ as DAG with a set of concepts and binary irreflexive relationships was translated to a database (cf. Figure 3). For each concept type and relationship separate tables have been designed and we assigned to each concept a unique identifier. The DAOZ database is currently implemented using the MySQL database management system.
39
An ontology is never complete as knowledge progresses continuously. The organization of the DAOZ ontological concepts into a database enables updating without altering the ontology hierarchy. The actual anatomical structures of ZFIN are subject to a constant update by a consortium of researchers. We are aware that the DAOZ as well has to be validated constantly against the ZFIN nomenclature in order to improve its comprehensibility and accuracy. To this end, we developed a number of agents to maintain and update the DAOZ on the fly.
Figure 3: The entity-relationship diagram illustrates the logical structure of the DAOZ database.
2.3.1 Standalone presentation of DAOZ
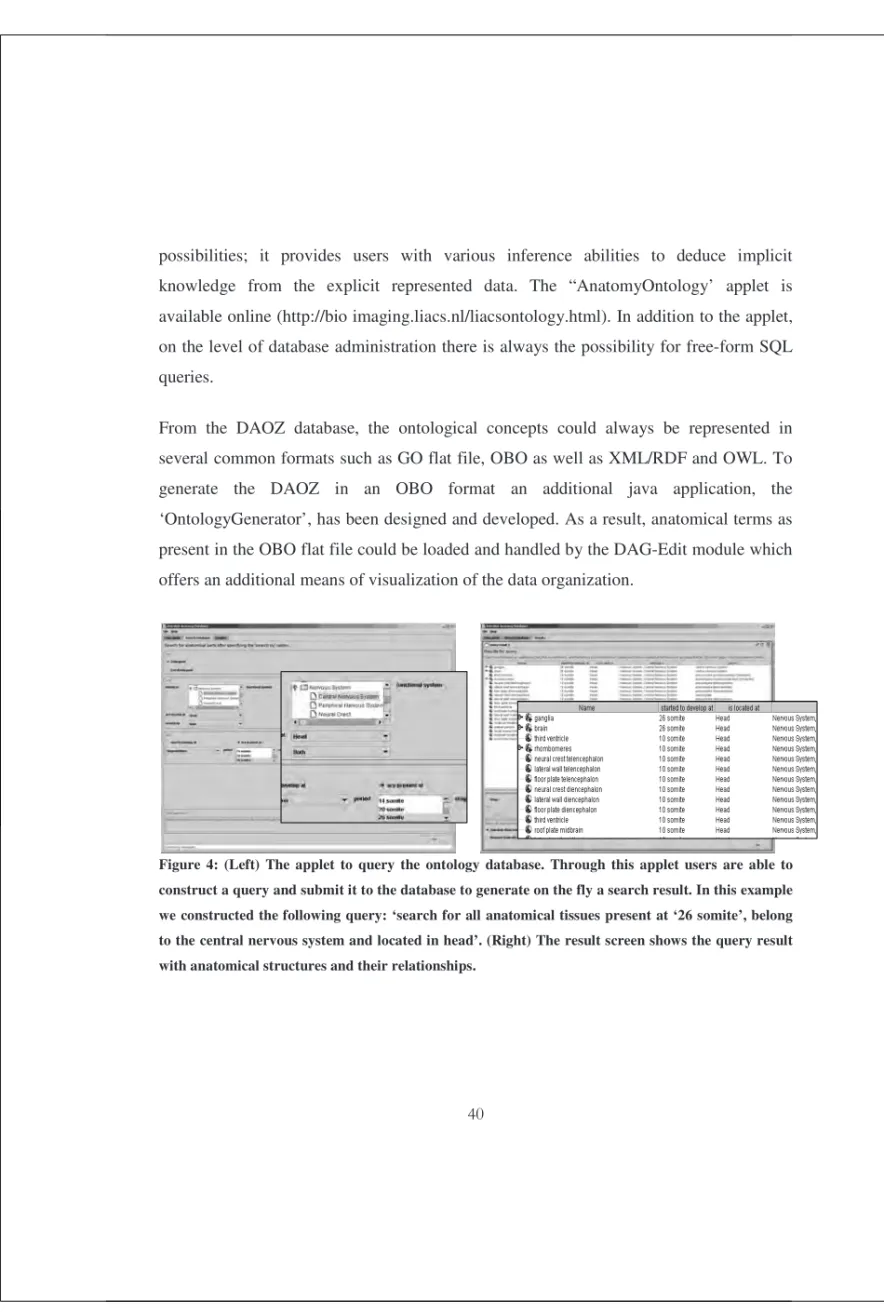
possibilities; it provides users with various inference abilities to deduce implicit knowledge from the explicit represented data. The “AnatomyOntology’ applet is available online (http://bio imaging.liacs.nl/liacsontology.html). In addition to the applet, on the level of database administration there is always the possibility for free-form SQL queries.
From the DAOZ database, the ontological concepts could always be represented in several common formats such as GO flat file, OBO as well as XML/RDF and OWL. To generate the DAOZ in an OBO format an additional java application, the ‘OntologyGenerator’, has been designed and developed. As a result, anatomical terms as present in the OBO flat file could be loaded and handled by the DAG-Edit module which offers an additional means of visualization of the data organization.
Figure 4: (Left) The applet to query the ontology database. Through this applet users are able to
construct a query and submit it to the database to generate on the fly a search result. In this example
we constructed the following query: ‘search for all anatomical tissues present at ‘26 somite’, belong
to the central nervous system and located in head’. (Right) The result screen shows the query result
41
2.3.2 Integration with other resources
The DAOZ terminology is used to annotate objects in both the 3D Atlas and the GEMS. Both databases can now be addressed with the same unique concepts and co-occurrence and co-expression of genes can be readily extracted from the databases. Another important requirement for DAOZ is to establish interoperability with other biological resources; ZFIN in particular. Anatomical terms of the DAOZ are identical to those present in ZAO; the zebrafish community ontology (ZFIN). Therefore, an object annotated with DOAZ ontological concepts can be linked straightforwardly to ZFIN which is interconnected with other database resources such as GO and the National Center for Biotechnology Information (NCBI). This means that through ZFIN, objects in our databases are integrated with others. Integration with resources such as GO and NCBI, enables our data to be presented into a large integrated research network.
GO is developed by the gene ontology consortium, and is an evolving structured and standardized vocabulary of nearly 16,000 terms in the domain of biological function (Camon et al, 2004)). GO is widely used for annotation of entries in biological-databases and in biomedical research in general.
NCBI provides an integrated approach to the use of gene and protein sequence information, the scientific literature (MEDLINE), molecular structures, and related resources, in biomedicine. Cross-references of our information systems with, but not restricted to, GO and NCBI implies integration with a wealth of bioinformatics databases leading to an increase of scientific benefit of our data.
2.4 Conclusion and Discussion
ontology uses several concepts and relationships for anatomical structures description which attribute numerous levels of representation. Specification of concepts and relationships has been achieved in close collaboration with experts in the field of embryology and developmental biology. As a result, the ontology provides an approved specification of domain information representing consensual agreement on concepts and relationships. Moreover, our relationships have been formally defined in order to give them uniform definitions to improve ontological consistency and to approach a maximum consistency with other ontologies; the Relation Ontology (RO) (Smith et al, 2005) especially, as it provides additional tools for relation consistency.
43
on co-localization and co-expression of genes. This feature is very important for reasoning and mining in such data.
The DAOZ provides a common semantic framework for gene expression and phenotype annotation thus providing an integrative framework between these two types of data usually employed to study and analyze development. DAOZ improves integration and data sharing between our information systems and ZFIN as well as cross-references to other external resources, i.e. not species specific, such as GO and NCBI.
2.5 Future work
An ontology provides the conceptual framework that is used to capture knowledge in a specific domain. DAOZ concepts enable anatomical terms representation at different level of abstraction with a complex data structure. The anatomical structures are queried through a pre-defined query interface: the “AnantomyOntlogy” browser applet. This applet offers a 2D representation of the hierarchical data structure of the DAOZ. Allowing possibility of free queries as well as enabling better visualization and understanding of the ontology components and their relationships, an new improved interface to the ontology database is the route to take. Currently, we are working on the release of an interface that supports free search and allows visualization of ontological concepts and their relationships using 3D visualization. This interface is a java applet that offers a dynamic interaction with the ontology in a 3D space which will give users new insights in ontological data.
45
CHAPTER 3
THE 3D DIGITAL ATLAS OF ZEBRAFISH: AN
INTEGRATIVE TOOL FOR ZEBRAFISH ANATOMY
Based on:
M. Belmamoune, L. Bertens, D. Potikanond, R. v.d. Velde and F. J. Verbeek. The 3D digital atlas of zebrafish: 3D models visualization through the Internet.
(Submitted, 2009)
Partially published in:
S.A. Brittijn, S.J. Duivesteijn, M. Belmamoune, L. F.M. Bertens, W.B., J.D. de Bruijn, D.L. Champagne, E. Cuppen, G. Flik, C.M. Vandenbroucke-Grauls, R.A.J. Janssen, I.M.L. de Jong, E.R. de Kloet, A. Kros, A.H. Meijer, J.R. Metz, A.M. van der Sar, M.J.M.
Schaaf, S. Schulte-Merker, H.P. Spaink, P.P. Tak, F. J. Verbeek, M.J. Vervoordeldonk,
F.J. Vonk, F. Witte, H. Yuan and M.K. Richardson. Zebrafish development and regeneration: new tools for biomedical research.
Abstract
47
3.1 Introduction
DAOZ and reorganized in an object oriented database. Through internet tools users are able to interact with the Atlas database and perform queries against the 3D models. A 3D Atlas model is an entity that through these internet tools could be accessed and browsed as a whole as well as through its instances. For example users could view a 3D model of 36 hours post fertilization (hpf) as a whole or in sub-structures by composing a search query such as: “select all anatomical structures from a 36 hpf embryo that belong to the central nervous system and located in head”.
Zebrafish (Danio rerio) has emerged as a useful model system to study vertebrate development. The zebrafish model system has the considerable advantage of holding complex developmental systems not present in other model invertebrates such as C. elegans and Drosophila (Lieschke, 2001). Prior to our 3D digital Atlas, no detailed 3D anatomical reference for the early zebrafish embryo was available. The stages of zebrafish development have been intensively studied over the last decades, and an embryological staging series (Kimmel et al, 1995) has been provided including key events in embryo development. However, a detailed 3D documentation of zebrafish development describing the whole anatomy of the embryo was not available. Previous detailed descriptive studies of zebrafish development were presented in 2D or limited to a particular functional system (Isogai et al, 2001).A holistic understanding of the anatomy of an organism is critical to dissecting the development and function of different organs and tissues in space and time.
49
anatomical structures and at high resolution. Moreover, this 3D framework should be ready for interoperability with other resources for an improved developmental study. The 3D models of our digital Atlas are the result of 3D reconstruction from serial physical sections (Verbeek et al, 1998; Brune et al, 1999; Weninger et al, 2002). Each anatomical domain in a 2D section is outlined by a closed contour and annotated by a standard nomenclature. With this imaging method we get high quality models providing detailed view of the anatomical structures in the plan of section images. This technique is preferred over other non-destructive methods such as OPT and MRI. The most obvious advantage of using histology is the high level of detail which can be achieved. Furthermore it enables the use of staining methods, thereby enhancing the contrast between tissue types, which makes images annotation (next section) easier. This process of 3D models generation might be qualified as time-consuming however each embryo, i.e. 3D model could be considered as a standard model for developmental biology and therefore justifies the amount of effort involved in its production.
The effectiveness of any model organism is restricted by the availability of accurate anatomical information for that model organism. With the 3D Atlas we strive to broaden the understanding of the biological development of the zebrafish and provide stakeholders with information on the scope of the size and shape of anatomical domains so as to enable an anatomical structure to be compared with its well described presumed “standard”. For zebrafish developmental studies gene expression patterns are produced at different stages of development. To understand this wealth of molecular data the 3D Atlas serves as a spatial and temporal mapping system for gene expression data submission and retrieval.
staging series of the early work of kimmel et al. For each of these developmental stages an acquisition database was produced. 3D models, i.e. 3D images in this database were graphically and semantically annotated. The graphical annotation is realized by means of closed contours around anatomical domains while the semantic annotation is given by conveying to each anatomical domain its presumed anatomical name.
The 3D Atlas is intended to be used as a standard framework to understand development of the zebrafish embryo. Development is a spatial and temporal event; therefore the 3D models of the Atlas need a spatio-temporal description. The spatial, temporal as well as function information in the 3D models is provided from the DAOZ (cf. chapter 2). At present, biological research information is preferred in a digital computer readable form so that this information can be shared and linked to other digital resources. This is in particular important for anatomical Atlases of model systems. We have, therefore made our 3D digital Atlas available through internet. Atlas images and annotations are organized in a database system. Furthermore, we developed a web-application, i.e. ZFAtlasServer (http://bio-maging.liacs.nl/ZFAtlasServer) that enables users to render 3D models on the fly. More importantly it allows users to search in a 3D model for specific instances or anatomical entities that are subsequently displayed on the fly, in 2D and 3D formats.
51
3.2 3D Models Acquisition
Here we present the model’s acquisition. So far we produced a number of embryos along the time axis at the following developmental stages 24, 36, 48 and 72 hpf (staging was based on Kimmel et al., 1995). The models presented here are acquired on normal and high resolutions.
3.2.1 Imaging methodology
3.2.2 Normal Resolution
The images of normal resolution were acquired using standard camera output. The whole process of producing an initial set of section images at standard resolution for the 3D modelling was very well documented in a database. This documentation is required for high resolution acquisition (as described in the next section). After processing, all section images were stored in Portable Network Graphics format (PNG;
http://www.w3.org/Graphics/PNG/).
3.2.3 High Resolution
At high resolution models histology could be seen in more details than at normal resolution. The XY position and angle φ of the camera during standard resolution acquisition has been stored in the acquisition database for each section image and were used to obtain a second set of images at a higher magnification. High resolution series were produced for the developmental stages of 36 and 72 hpf embryos. In the high resolution series each image was constructed from multiple tiles. An overlap of 32 pixels between the tiles was used to be able to assemble the tiles into a complete image section after acquisition. The obtained tiles were combined into image sections and preprocessed using the methods described in Verbeek and Boon, 2002. The images acquisition was accomplished using the normal resolution image stacks. The image stack was annotated and visualized in the same way as at normal resolution.
3.3 3D Models Annotation
53
Furthermore, we assigned an anatomical name to each domain. This anatomical nomenclature is extracted from the DAOZ database.
Figure 1: (Above) shows a section image that has been segmented in multiple anatomical domains
(closed contours) and to each anatomical domain a color and an anatomical name are assigned, these
are given in the form of an anatomical concepts list. (Below) illustrates the 3D contour model; it is the
55
The 3D Atlas consists, therefore, of two parts; one is a textual description of the anatomical structures and the other is a graphical annotation realized by segmenting each section image into multiple domains. The first part is stored in an object oriented database while the second part is stored on the server file system. Both parts are accessible through the internet for 3D models visualization.
3.3.1 Graphical annotation
To enable a wide range of users to understand what anatomical information is present in a section image a graphical annotation is required. This form of annotation indicates a domain in the image (area or volume) in which an anatomical concept is observed. In each of the section images anatomical structures were traced using a WACOM LCD tablet (PL series, WACOM, Europe). To that end, each anatomical structure was specifically named and attributed a color label.
3.3.2 Textual annotation
the Atlas. They are able to search in a 3D model for detailed information (instances) using coarse anatomical entities. Anatomical entities in an Atlas 3D model are described at multiple levels of granularity which enables their identity to remain maintained through time. This makes of the 3D digital Atlas a stronger and more persistent data integration framework where anatomical structures and attributes traverse multiple levels.
3.4 3D models Pre-processing and Management
For reasons of flexibility, we choose XML to be the native format of our data. As XML is involved in the whole processing pipe, it is relatively easy to add entries and/or attributes to the XML files without having to rewrite all software. This scalability feature is indispensable for a project which is subject to adaptation and update so as new insights are added to constantly improve the quality of the data. The Atlas data comes from two resources; one being the image acquisition software and the other being the TDR-3Dbase software package (Verbeek et al, 2002). Using the TDR-3Dbase 3D reconstruction from serial sections is realized and for each 3D model an XML file is generated.
57
3.5 Data Delivery: An interface for the Atlas database
R
e
q
u
e
s
t
R
es
p
o
n
s
e
Figure 2: The user-server architecture of the web application: ZFAtlasBrowser.
59
an XML file with all required elements as entries to the images set and their textual and graphical annotations. This XML file is passed to the java applet application. Through the applet, a volume rendering of the retrieved anatomical domains is prompted to the user (cf. Figure 3). The user is able to navigate through the data in 2D or 3D.
We have generated two versions of 3D models: at normal and high resolutions. Users can choose to query and browse the normal resolution models before selecting a higher resolution copy to examine in more detail. In this way, the volume data can be easily browsed in an intuitive manner on the wide range of operating systems and internet connections used by researchers. The ZFAtlasServer includes the following features: 1 Display a whole 3D model
2 Search in a 3D model for specific anatomical structures 3 Display the search results
4 Display 2D section images
5 Display contours present in each section image 6 List of anatomical structures nomenclature 7 Graphical legend of the anatomical structures 8 Tabs for 2D and 3D visualizations
9 Select/deselect anatomical structures options
Figure 3: (Left, above) the first screen where users could directly start the java applet to view a
complete 3D model. (Right, above) The query interface is where users are able to compose a search
query using entities from the DAOZ ontology. (Left, below) A whole 3D model of a 36 hpf embryo.
(Right, below) A 3D sub-model (the central nervous system in the head region) of the 36 hpf embryo;
it is the result of the following query: “Select all structures present in the 36 hpf embryo, belong to
the central nervous system and located at in head”.
61
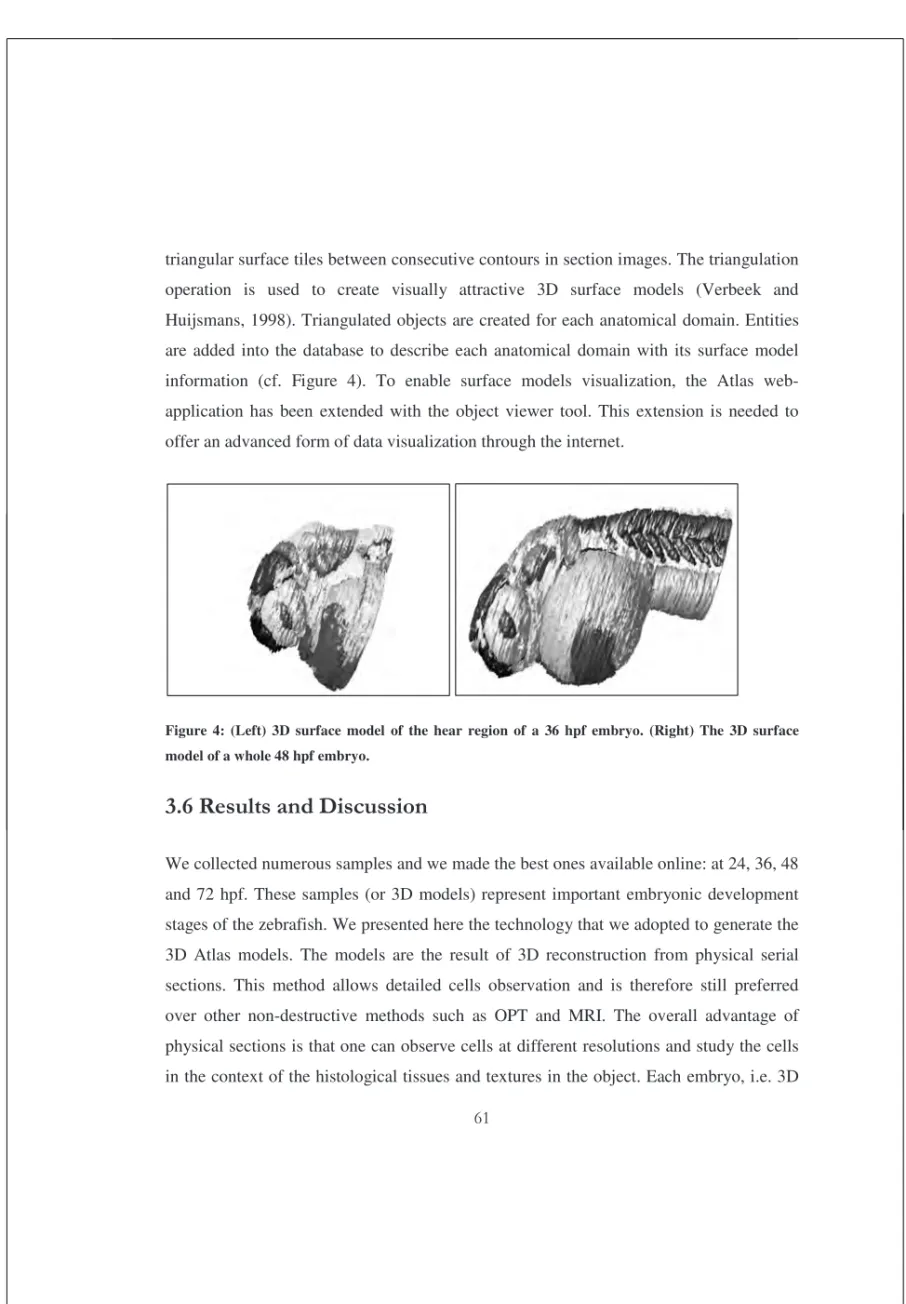
triangular surface tiles between consecutive contours in section images. The triangulation operation is used to create visually attractive 3D surface models (Verbeek and Huijsmans, 1998). Triangulated objects are created for each anatomical domain. Entities are added into the database to describe each anatomical domain with its surface model information (cf. Figure 4). To enable surface models visualization, the Atlas web-application has been extended with the object viewer tool. This extension is needed to offer an advanced form of data visualization through the internet.
Figure 4: (Left) 3D surface model of the hear region of a 36 hpf embryo. (Right) The 3D surface
model of a whole 48 hpf embryo.
3.6 Results and Discussion
model generated with this powerful method could be used as a standard by the scientific community.
Section images of a 3D model are annotated both textually and graphically. Textual annotation helps to understand what is in the image while it does not help to indicate where in the image a certain concept is observed. Words help to trace images, not domains in the images. Sometimes the annotation is very obvious; in other cases a graphic clue is added to help to locate a concept in an image. The simplest form of a graphic aid is to add an arrow or a line pointing to an area in which a concept is observed. This is not unambiguous in all cases. It can be easily implemented by using Scalable Vector Graphics (SVG; http://www.w3.org/Graphics/SVG/) which provides XML structures to do this. A more precise way of using a graphic aid is to apply a true graphical annotation by indicating in an image a domain, i.e. a group of pixels with similar characteristic. In our case, we segmented each section image by drawing closed contours around anatomical structures sharing similar anatomical functionality. Coordinates of each contour element (or graphical annotation) are saved as part of the annotation in a contour file.
63
The DAOZ anatomical structures nomenclature is the same as this known and used inside the zebrafish research community. DAOZ concepts enable the 3D Atlas data to be integrated with other resources such as ZFIN; objects in the Atlas could be integrated with others resources which enable our data to be presented into a large integrated research network. Anatomical domains are annotated with continuous entities such as functional systems and stages of development which means that they preserve their identity over time even when lower level anatomical nomenclature are changed. This feature facilitates Atlas data access and integration to other model systems.
Annotated models are organized in an object oriented database, i.e. the Atlas database. This database includes information of each 3D model. This information is related to a model anatomical structures nomenclatures, graphical annotation as well as pointers to their set of section images. A query interface has been setup to access objects in this database. From this interface, straightforward queries could be performed using ontological characteristics of the anatomical structures. Users are not required to have a deep knowledge of the anatomy to interact with the Atlas. Therefore, we trust that a wide range of users can made use of our 3D Atlas.
When a search query is sent to the database an XML file of the query model is generated containing query results. The XML file is used as an input for the applet application. This application enables models visualization and manipulation on the fly. In addition, a model could be freely manipulated, such as structures could be isolated to be studied individually or in the context of their neighbors.
have developed and employed to acquire, manage and present the data have been successfully applicable to many other model systems and anatomical structures (De Jong et al, 2005; Welten et al, 2005 and Bertens et al, in preparation).
3.7 Future work
65
CHAPTER 4
DATA INTEGRATION FOR SPATIO-TEMPORAL
PATTERNS OF GENE EXPRESSION OF
ZEBRAFISH DEVELOPMENT: THE GEMS
DATABASE
Based on:
M. Belmamoune and F. J. Verbeek Data Integration for Spatio-Temporal Patterns of Gene Expression of Zebrafish
development: the GEMS database. Journal of Integrative BioInformatics, 5(2):92, 2008.
Partially published in:
M. Belmamoune and F. J. Verbeek. Heterogeneous Information Systems: bridging the gap of time and space. Management
and retrieval of spatio-temporal Gene Expression data. InSCit2006 (Ed. Vicente P. Guerrero-Bote), Volume I "Current Research in Information Sciences and Technologies. Multidisciplinary approaches to global information systems",
Abstract
The Gene Expression Management System (GEMS) is a database system for patterns of gene expression. These patterns result from systematic whole-mount fluorescent in situ
67
4.1 Introduction
Patterns of gene expression are studied in all major animal model systems in a systematic manner and the data resulting from gene expression studies are stored into a range of model organism databases. The major databases are FlyBase (Grumbling et al, 2006) for
Drosophila, MEPD (Henrich et al, 2005) for medaka, GXD (Smith et al, 2007) and EMAGE (Christiansen et al, 2006) for mouse and ZFIN (http://zfin.org) for zebrafish. In our work we focus on patterns of gene expression resulting from developmental processes involving both molecular (transcription) and morphological (genotype) data. This data clearly have a spatio-temporal signature.
In this chapter we present the design and implementation of a repository for patterns of gene expression in zebrafish derived from 3D images, i.e. the Gene Expression Management System (GEMS; http://bio-imaging.liacs.nl/gems/). This system aims to be an integrative database for spatio-temporal patterns of gene expression with other bio-molecular databases, crucially important for an efficient use and exchange of gene expression resources. For zebrafish a central repository for true 3D patterns of gene expression is needed. We therefore investigated integration of 3D patterns of gene expression with bimolecular databases; first to link image information with genomic information and second to study interoperability between genomics model systems. Zebrafish is an important model organism used in molecular genetics and developmental biology; it serves as a model for understanding normal vertebrate development as well as dissecting the mechanisms underlying human diseases. As a vertebrate model, zebrafish has many advantages: small size, ease of culture and transparent embryos. Moreover, many aspects of vertebrate development can be compared with zebrafish.
specifically improved and adapted a FISH-protocol for the imaging of whole mount zebrafish embryos using the Confocal Laser Scanner Microscope (CLSM): i.e. ZebraFISH (Welten et al, 2006). Each CLSM image is a 3D multi-channel image taken from a whole mount specimen containing the outline of the embryo and the pattern of gene expression in separate channels. However, the patterns of gene expression are not restricted to the zebraFISH protocol. It is the intention to accommodate different kinds of protocols so that patterns of gene expression can either be the result of FISH, or transgenic lines (GFP-like) or immunohistochemisty (product related). With respect to 3D CLSM images resulting from zebraFISH, the GEMS repository realizes storage, retrieval and mining of these patterns of gene expression, in coherence with their spatial and temporal characteristics. For this particular domain the GEMS aims complementing the comprehensive Zebrafish Information Network (ZFIN; http://zfin.org) as a platform integrating zebrafish 3D spatio-temporal patterns of gene expression. Data annotation is a crucial aspect of the GEMS and this is accomplished through the integration of two domain ontologies: the Developmental Anatomy Ontology of Zebrafish (DAOZ; http://bio- imaging.liacs.nl/liacsontology.html) and the Gene Ontology (GO; http://geneontology.org).
69
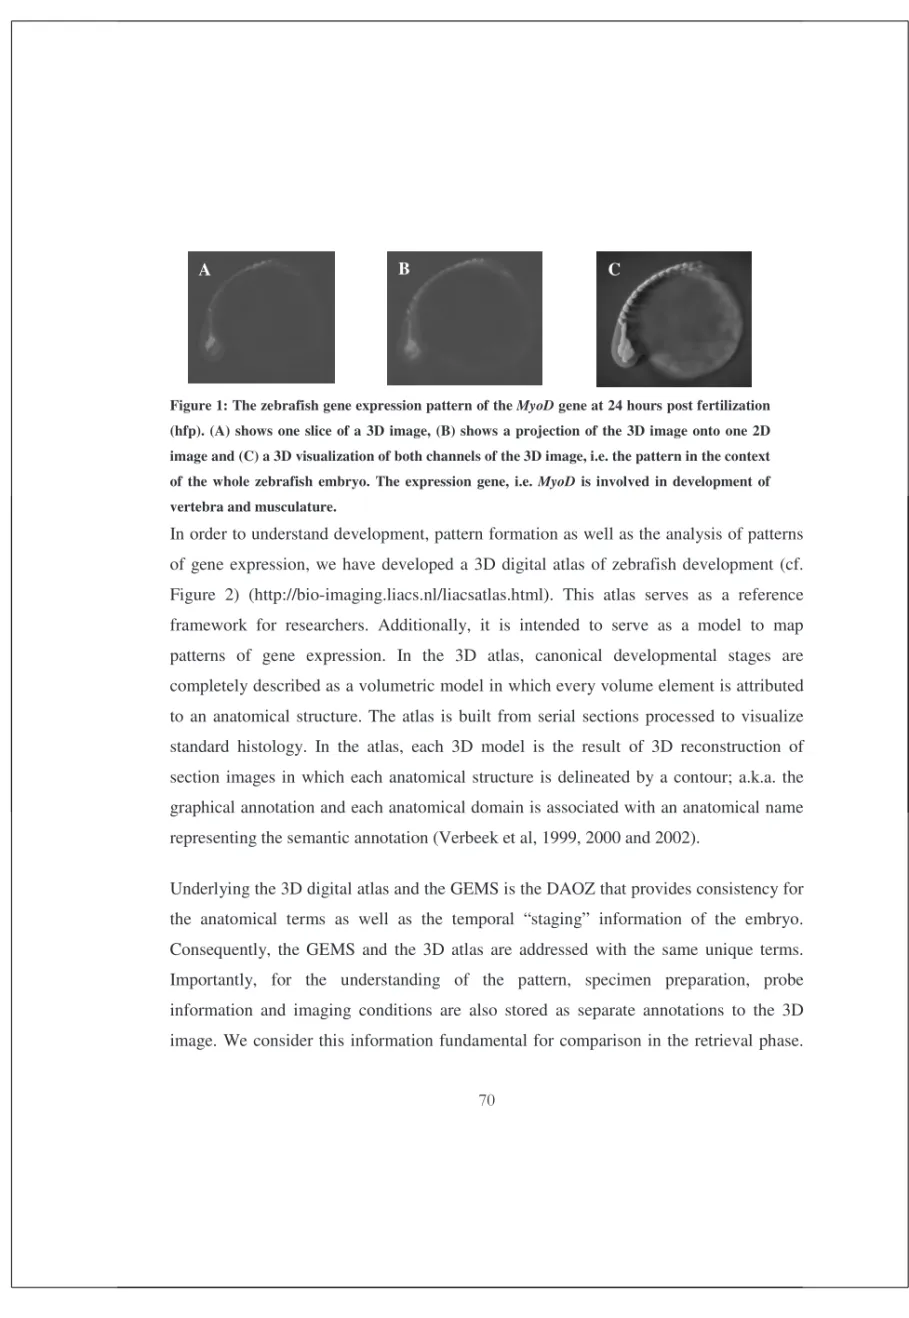
spatial profile. In multi-cellular organisms such as the zebrafish, gene expression influences and/or directs the developmental status of a cell or group of cells. Whole-specimen microarray analysis can therefore not fully document the spatio-temporal relations. Whole mount in situ hybridization can be used to obtain such information. 2D images are most commonly used and easier to acquire, using standard in situ
hybridization. However, this may not be sufficient in describing complex phenomena as development. 3D images are used to obtain a comprehensive description of the spatio-temporal relations and have the additional advantage that internal anatomy can included in the visualization. For a range of marker genes zebraFISH in situ’s have been done and the resulting 3D images (cf. Figure 1) are stored in the GEMS database. The 3D patterns of gene expression are available as “raw” image data and in some cases also 3D graphical models (Welten et al, submitted) are extracted from the 3D images and are made available.