REAL-TIME ANALYSIS OF AGGREGATE NETWORK TRAFFIC FOR ANOMALY DETECTION
A Dissertation by
SEONG SOO KIM
Submitted to the Office of Graduate Studies of Texas A&M University
in partial fulfillment of the requirements for the degree of DOCTOR OF PHILOSOPHY
May 2005
REAL-TIME ANALYSIS OF AGGREGATE NETWORK TRAFFIC FOR ANOMALY DETECTION
A Dissertation by
SEONG SOO KIM
Submitted to Texas A&M University in partial fulfillment of the requirements
for the degree of DOCTOR OF PHILOSOPHY Approved as to style and content by:
A. L. Narasimha Reddy (Chair of Committee)
Riccardo Bettati
(Member) Don R. Halverson (Member)
Michael S. Pilant (Member)
Chanan Singh
(Head of Department)
May 2005
ABSTRACT
Real-time Analysis of Aggregate Network Traffic for Anomaly Detection. (May 2005) Seong Soo Kim, B.S., Yonsei University;
M.S., Yonsei University
Chair of Advisory Committee: Dr. A. L. Narasimha Reddy
The frequent and large-scale network attacks have led to an increased need for developing techniques for analyzing network traffic. If efficient analysis tools were available, it could become possible to detect the attacks, anomalies and to appropriately take action to contain the attacks before they have had time to propagate across the network.
In this dissertation, we suggest a technique for traffic anomaly detection based on analyzing the correlation of destination IP addresses and distribution of image-based signal in postmortem and real-time, by passively monitoring packet headers of traffic. This address correlation data are transformed using discrete wavelet transform for effective detection of anomalies through statistical analysis. Results from trace-driven evaluation suggest that the proposed approach could provide an effective means of detecting anomalies close to the source. We present a multidimensional indicator using the correlation of port numbers as a means of detecting anomalies.
We also present a network measurement approach that can simultaneously detect, identify and visualize attacks and anomalous traffic in real-time. We propose to represent samples of network packet header data as frames or images. With such a formulation, a series of samples can be seen as a sequence of frames or video. This
enables techniques from image processing and video compression such as DCT to be applied to the packet header data to reveal interesting properties of traffic. We show that “scene change analysis” can reveal sudden changes in traffic behavior or anomalies. We show that “motion prediction” techniques can be employed to understand the patterns of some of the attacks. We show that it may be feasible to represent multiple pieces of data as different colors of an image enabling a uniform treatment of multidimensional packet header data.
Measurement-based techniques for analyzing network traffic treat traffic volume and traffic header data as signals or images in order to make the analysis feasible. In this dissertation, we propose an approach based on the classical Neyman-Pearson Test employed in signal detection theory to evaluate these different strategies. We use both of analytical models and trace-driven experiments for comparing the performance of different strategies. Our evaluations on real traces reveal differences in the effectiveness of different traffic header data as potential signals for traffic analysis in terms of their detection rates and false alarm rates. Our results show that address distributions and number of flows are better signals than traffic volume for anomaly detection. Our results also show that sometimes statistical techniques can be more effective than the NP-test when the attack patterns change over time.
DEDICATION
This dissertation is gratefully dedicated to
My Wife, Eun Kyung Jun My Children, Minjeong and Taewoo
and My Parents, Jung Nam Kim and Geum Ja Yun
ACKNOWLEDGMENTS
I would like to express my deepest gratitude to Dr. Reddy for his advice and support throughout this research. I am greatly indebted to my advisor for the invaluable guidance and encouragement which he has provided me through my study. He is always open to new ideas and I really appreciate the freedom he gave me while working on my research. This research could not have been possible without his brillant ideas. I owe much for his unending help to do the research and for his finacial support during my graduate study.
I would like to express my sincere appreciation to Dr. Halverson who was willing to provide me the valuable statistical advice for this study. I thank the committee members, Dr. Bettati and Dr. Pilant for serving as committee members and for helping me through my final steps. Special thanks are given to Dr. Vannucci for her guidance in the field of Wavelet Analysis.
Most of all, I am grateful to my wife, Eun Kyung Jun, for her encouragement and patience over the past three and half years. I also thank my children, Minjeong and Taewoo, for giving me smiles and the will of life.
This research was supported in part by the National Science Foundation, Texas Higher Education Board, Texas Information Technology and Telecommunications Taskforce and Intel Corp.
TABLE OF CONTENTS
Page
ABSTRACT ...iii
DEDICATION ... v
ACKNOWLEDGMENTS... vi
TABLE OF CONTENTS ...vii
LIST OF FIGURES...xii
LIST OF TABLES ... xvi
CHAPTER I INTRODUCTION... 1
A. Motivation ... 1
B. Previous Research ... 5
C. Contributions and Outline ... 8
II AGGREGATED TRAFFIC SYSTEM ... 10
A. Traffic Analysis at the Source... 10
B. General Mechanism of the Detector... 13
C. Approach ... 14
1. Simulated Attacks ... 16
D. Data Structure for Computing Signal... 18
III ADDRESS CORRELATION SIGNAL-BASED ANOMALY DETCTION... 24
A. Discrete Wavelet Transform (DWT)... 24
1. Data Transform ... 24
CHAPTER Page
3. Timescale Selection ... 27
B. Statistical Analysis ... 27
1. Detection Mechanism ... 27
2. Selective Reconstruction in DWT... 29
3. Thresholds Setting Through Statistical Analysis ... 30
a. Statistical Consideration of Threshold: Wide-sense Stationary ... 32
C. Detection in Postmortem Analysis ... 34
1. Detection of Anomalies Using the Real Attack Traces ... 34
2. Detection of Anomalies Using the Simulated Attack Traces ... 36
3. Effect of DWT... 38
D. Detection in Real-time Analysis ... 39
1. Individual Reconstruction in DWT... 39
a. Thresholds Setting Through Statistical Analysis ... 39
2. Detection of Anomalies Using the Real Attack Traces ... 40
3. Detection of Anomalies Using the Simulated Attack Traces ... 42
E. Multidimensional Indicators... 44
1. Analysis of Network Traffic by Port Numbers ... 44
2. Number of Flows ... 45
3. Comprehensive Traffic Analysis... 46
4. Attack Volume ... 48
F. Summary... 50
IV TRAFFICIMAGE-BASEDANOMALYDETECTION... 51
A. Network Traffic as Image ... 51
1. Network Traffic... 51
2. Visual Representaion ... 52
CHAPTER Page
1. Sampling Rates ... 55
2. Discrete Cosine Transform (DCT)... 57
a. Validity of Intra-frame DCT ... 58
b. Inter-frame Differential Coding ... 59
c. Effect of Sampling Rates on DCT Coefficients ... 61
C. Visual Modeling Network Traffic as Images ... 62
1. Visual Patterns in Normal Network Traffic ... 62
2. Visual Patterns in Semi-random Targeted Attacks ... 64
3. Visual Patterns in Random Targeted Attacks ... 65
4. Visual Patterns in Complicated Attacks... 66
5. Flow-based Visual Representation... 68
6. Multidimensional Visualization... 69
a. Visual Patterns in Port Number Domain... 71
D. Anomaly Detection Using Scene Change Analysis ... 73
1. Threshold Setting Through Statistical Analysis... 73
a. Real-time Analysis ... 73
b. Postmortem Analysis ... 74
c. Thresholds Setting... 77
2. Anomaly Detection ... 77
3. Attack Estimation Using Motion Prediction... 78
4. Processing and Memory Complexity... 80
E. Identification... 82
1. Identification of Attackers and Victims in Byte-segment Level of IP Address... 82
2. Identification of Attackers’ and Victims’ Entire IP Address... 84
F. Comparison with IDS ... 86
CHAPTER Page
2. Overall Results of Snort and NetViewer... 86
3. Comparison of Snort and NetViewer... 88
G. Summary ... 90
V EVALUATIONOFDIFFERENTPACKETHEADERDATAASSIGNALS FORANOMALYDETECTION... 92
A. Traffic Signals... 93 1. Scalar Signals... 94 a. Byte Counting ... 94 b. Packet Counting ... 94 c. Flow Counting... 95 2. Vector Signals ... 96 a. Protocol Composition... 96 b. Image-based Signals ... 97 B. Evaluation Methodology ... 98
1. Type I and II Errors... 98
2. Likelihood Ratio ... 99
3. Statistical Analysis Based on 3σ... 99
C. NP Test ... 100
1. PDF of H0 and H1... 100
2. Bayes’ Likelihood Ratio Test ... 104
a. Effect of Threshold (η) in NP Test ... 106
3. Expected True and False Positive Rates ... 108
4. Application for Traffic Signals in NP Test ... 109
D. Evaluation of Signals ... 112
1. Byte Counting and Packet Counting... 112
2. Flow Counting... 114
CHAPTER Page
E. Evaluation of Image-based Signals ... 116
1. Packet Distribution in Address Domain... 116
2. Flow Distribution in Address Domain ... 117
3. Packet Distribution in Port Domain ... 119
4. Multidimensional Signal ... 120
F. Analytical Results ... 121
1. Sensitivity of Signals to Thresholds... 121
2. Real-time and Postmortem Analysis... 122
3. General Discussion of Results ... 123
4. Consideration Using Other Traces... 124
5. Effect of Exponentially Weighted Moving Average ... 126
6. Sensitivity of Signals to Attack Volume... 128
G. Tool Development... 130
1. Frame of NetViewer... 131
2. Future Version of NetViewer... 132
H. Summary ... 133
VI CONCLUSIONSANDFUTUREWORK ... 134
REFERENCES... 138
APPENDIX ... 146
LIST OF FIGURES
FIGURE Page
1 The various filtering points ... 11
2 The block diagram of our detector ... 13
3 The autocorrelation function of the correlation coefficient signal (Fig. 5(a)) over 2 days ... 18
4 The data structure for computing weighted correlation ... 20
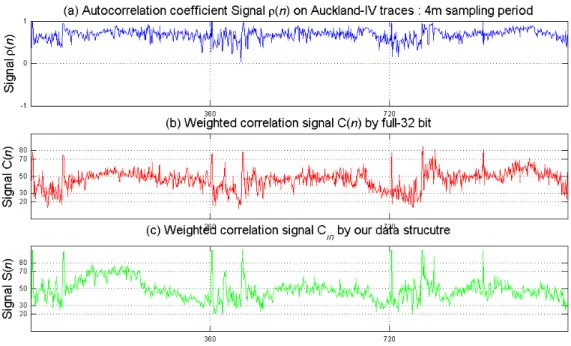
5 Comparison among signals of autocorrelation coefficient, full 32-bit correlation and our data structure... 22
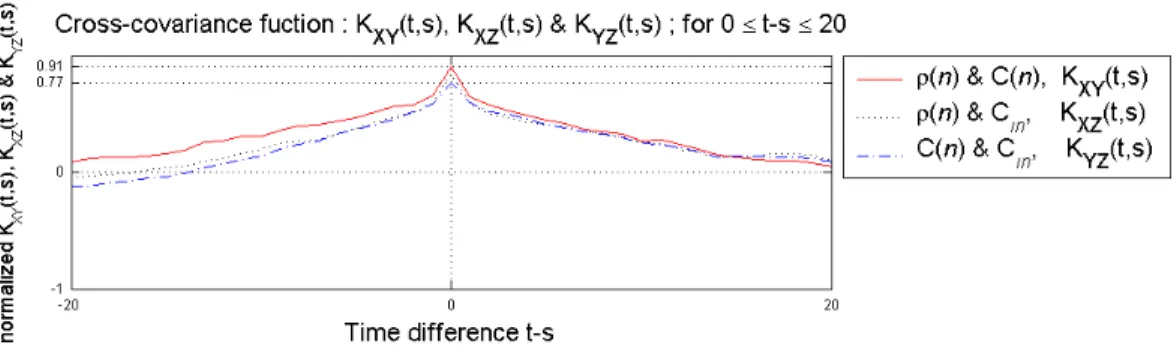
6 The cross-covariance functions show that the random variables of three kinds of signals are to be correlated ... 23
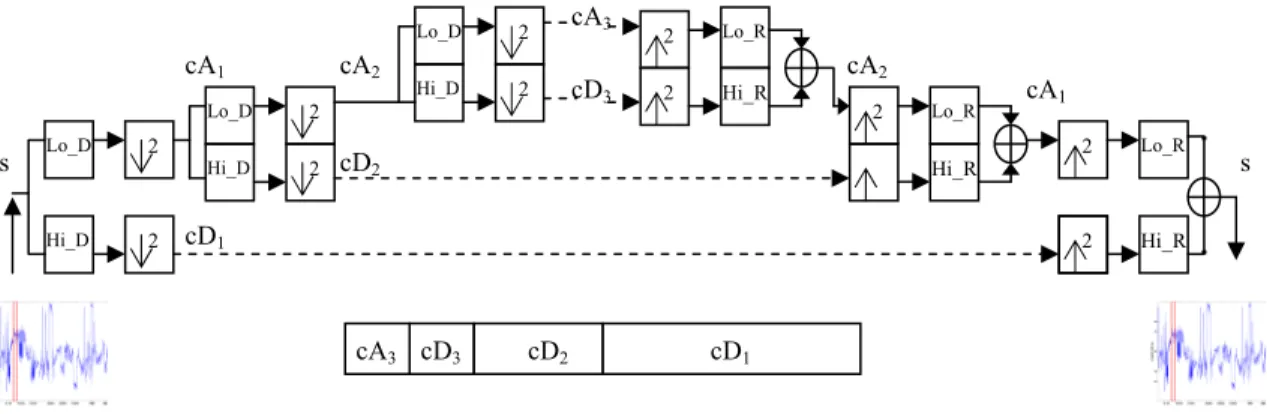
7 A multilevel two-band wavelet decomposition and reconstruction ... 25
8 The timing diagram in detection mechanism ... 28
9 The distribution of the ambient traces without attacks ... 31
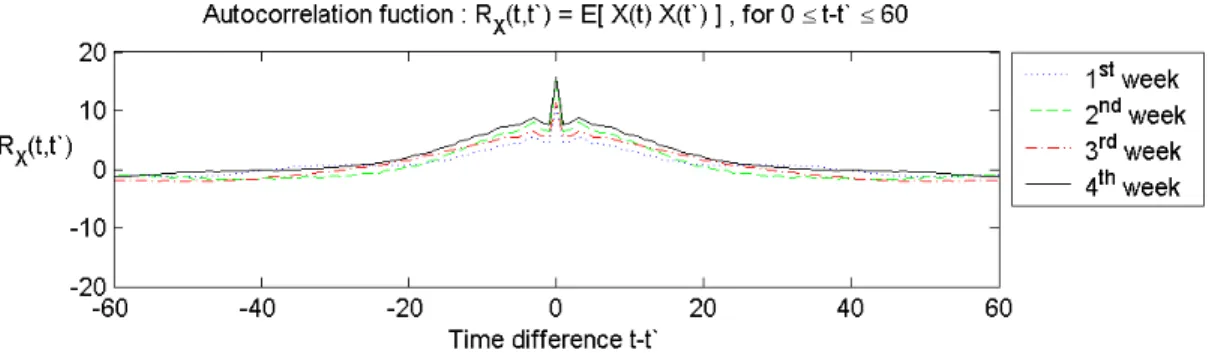
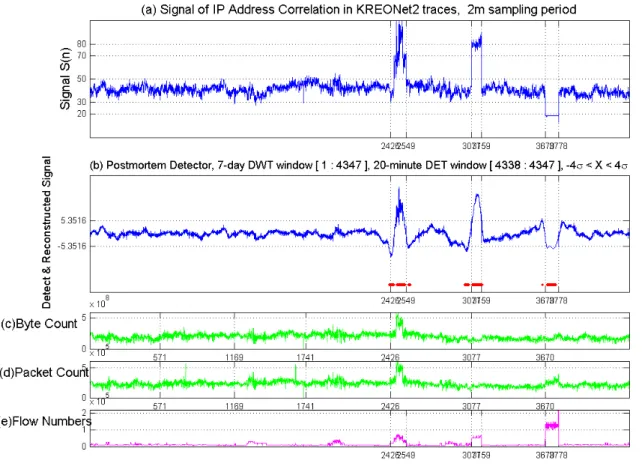
10 The autocorrelation function of wavelet transformed signal in the sample paths. 33 11 IP address-based detection results using KREONet2 real attack traces in postmortem... 35
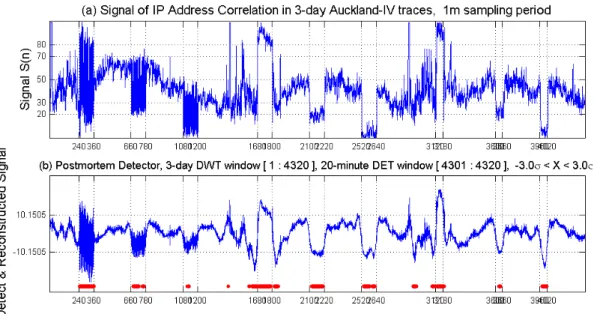
12 IP address-based detection results using USC real attack traces in postmortem 36 13 IP address-based detection results using simulated attack traces in postmortem 37 14 Address-based detection results using real attack traces in real-time ... 41
FIGURE Page
15 Address-based detection results using simulated attack traces in real-time... 42
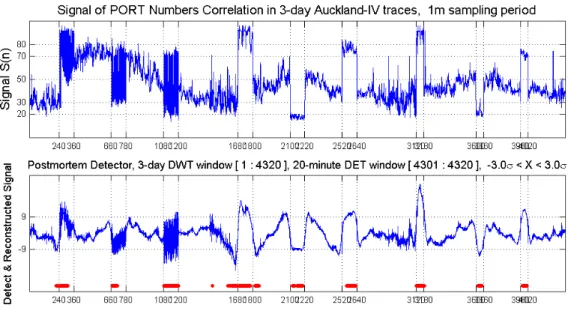
16 Port numbers-based detection results in postmortem... 44
17 Cross-correlation function of IP address (X), port numbers (Y) and number of flows (Z) ... 46
18 The multidimensional detection results using IP address and port numbers ... 47
19 The visualization of network traffic signal in IP address... 54
20 The relationship between MSE and sampling rates ... 56
21 The relationship between sampling rates and nature of the traffic ... 57
22 The relationship between intra-frame MSE and DCT coefficients... 60
23 The relationship between DCT coefficients and sampling rates in normalized intra-frame MSE... 61
24 Visual measurement of normal network traffic... 63
25 Visual measurement of semi-random typed attack ... 64
26 Visual measurement of (horizontal) random styled attack... 65
27 Visual measurement of (vertical) random styled attack... 65
28 Visual measurement of complicated network attack... 67
29 Visual measurement of the flow-based network traffic ... 68
FIGURE Page
31 Port-based visual measurement ... 72
32 The results from trace-driven evaluation for detecting attacks in real-time ... 74
33 The trace-driven evaluation results from address-based image signal in destination address for detecting attacks... 75
34 Illustrative procedures show potential attack estimation using motion prediction... 79
35 The detection report for the Fig. 25 of anomaly identification ... 83
36 The flowchart in concatenation of identification ... 85
37 Snort report during 24 hours, April 28 through 29, 2004 ... 87
38 NetViewer detection for April 28 through 29, 2004 ... 88
39 The identification report on Apr 29, 2004, 05:01:00 by NetViewer... 89
40 The relation of byte count and paket count of flows... 95
41 Illustration of PDF and true/false positive rates... 102
42 The relationship between thresholds (η) and measurements criteria ... 107
43 Normality of address-based signals in real-time mode ... 109
44 Trace-driven detection results in scalar signals... 112
45 Detection results based on protocol composition... 114
FIGURE Page
47 The relationship between performance and forgetting factor ... 126
48 The relationship between performance and attack volume ... 127
49 The running example of NetViewer... 130
LIST OF TABLES
TABLE Page
1 Address Persistence in Successive Periods ... 12
2 The Descriptions of Five Attacks in KREONet2 Traces ... 15
3 The Nine Kinds of Simulated Attacks... 16
4 The Statistical Measures in the Sample Paths... 33
5 The Detectionability of the IP Correlation Signal and the DWT Signal... 38
6 The Relation between Latencies and Confidence Levels in Nine Kinds of Attacks in Real-time Mode ... 43
7 The Detectionability of the Various Mixture Ratios of Auckland-IV Traces in Postmortem Mode ... 49
8 The Detection Latency of the Various Mixture Ratios of Auckland-IV Traces in Real-time Mode... 49
9 Results of Scalar Signals ... 113
10 Results of Protocol Composition Signals... 115
11 Results of Address-based Signals ... 116
12 Results of Flow-based Signals ... 118
13 Results of Port-based Signals... 119
TABLE Page
15 Port-based Measurement Results of Campus (TAMU) Traces... 124
16 Results of Multidimensional Signals of Campus (TAMU) Traces ... 124
17 Address-based Measurement Results of ISP (USC) Traces... 125
18 Results of Multidimensional Signals of ISP (USC) Traces ... 125
19 The Detection Latency of the Various Mixture Ratios of Simulated Attacks in Real-time Mode... 128
CHAPTER I INTRODUCTION
Malicious network traffic, such as DoS (denial of service) floods, worms and other malicious codes, has become a common threat for communication on the Internet. Currently, there are many well-known automated self-propagating codes that can be classified as DoS, DDoS (distributed denial of service), and DRDoS (distributed reflection denial of service) attacks. Compound attacks consisting of more than one strategy, self-modifying worms, and encryption-based worms are likely to increase this threat further in the future [1]. A number of recent studies have pointed to the need for fast detection of such worms for any effective mechanisms for thwarting such traffic [2]. The frequent and increasing attacks on computer network infrastructure have led to an increased need for developing techniques for analyzing and monitoring network traffic. Network traffic monitoring and analysis tools are being employed to counter this threat. If efficient analysis and visual tools were available, it could become possible to detect the spread of such malicious traffic in real-time, and to appropriately take action to contain the attacks before they have had much time to propagate across the network. In this dissertation, we study the possibilities of traffic-analysis based visual mechanism for attack detection and identification.
A. Motivation
The motivation for this work came from a need to reduce the likelihood that an attacker may hijack the AD (administrative domain) machines to stage an attack on a third party. By report of Incident Response Team in 1998, 97% of the attacked sites never knew about the attacks [3]. An AD like a campus may want to prevent such use of
its machines for preventing attacks, limiting misuse of its machines and possibly limiting the liability from such attacks. With this aim, we focus on analyzing network traffic at the edge of an AD. In particular, we study the utility of observing packet header data of traffic at the network edge, such as source/destination addresses, port numbers, in order to detect attacks/anomalies originating from the AD.
Detecting anomalies/attacks close to the source allows us to limit the potential damage close to the attacking machines. Traffic monitoring close to the source may enable the network administrator quicker identification of potential anomalies and may allow better control of AD’s resources. Attack propagation could be slowed through early detection of attacks.
Traditionally, Intrusion detection system (IDS) tools that rely upon operating system logs, process behaviors and firewall logs have been employed to monitor the network traffic. IDS tools monitor network and host traffic to filter the packets that belong to attacks with known behavior patterns. However, the frequent appearance of novel attacks compromises such analysis making true detection of unknown malicious traffic difficult. Measurement-based IDS tools and network traffic analysis have recently started attracting attention as a potential complementary approach [4], [5], [6], [7]. In this dissertation, we focus our attention on measurement-based approaches to anomaly detection.
As a methodological approach towards this aim of studying and classifying traffic on the network based on usage and protocols, a number of tools such as FlowScan [7], Cisco’s FlowAnalyzer, and AutoFocus [6], are used as traffic analyzers. Some of these tools provide real-time reporting capability, but much of the analysis is done off-line. These tools have been effectively utilized for traffic engineering and postmortem anomaly detection. However, rigorous real-time analysis is needed for detecting and identifying the anomalies so that mitigation action can be taken as promptly as possible.
Some of these tools are based on the volume of traffic such as byte counts and packet counts. When links are congested, it is possible to always observe a fully utilized link without gaining further information about possible changes in network traffic. For example, traffic volume in terms of byte counts or packet counts could be employed to detect flood attacks which consume significant amount of network bandwidth. However, sophisticated low-rate attacks [8] and replacement attacks, which do not give rise to noticeable variance in traffic volume, can be undetected when network measurement tools analyze the traffic based on traffic volume signals. Similarly, when links are not sufficiently provisioned, normal traffic volumes may reach the capacity of the links most of the time. In such cases, attack traffic may not induce significant overshoot in traffic volume (merely replacing existing normal traffic) and hence may make traffic volume signal ineffective in detecting attacks.
Most current monitoring/policing tools that employ flow level analysis. Link speeds are increasing and the traffic analysis tools need to scale with the link speeds. The tools that collect and process flow data may not scale to high-speed links as they focus on individual flow behavior.
Our approach tries to look at aggregate packet header data in order to improve scalability. Our work here brings techniques from image processing and video analysis to visualization and real-time analysis of traffic patterns.
Our approach to detecting anomalies envisions two kinds of detection mechanisms: postmortem and real-time modes. A postmortem analysis may exploit many hours of traffic data as a single data set, employing more rigorous, resource-demanding techniques for analyzing traffic. Such an analysis may be useful for traffic engineering purposes, analysis of resource usage, understanding peak demand etc. Real-time analysis would concentrate on analyzing a small window of traffic data with a view to provide a quick and possibly dirty warning of impending/ongoing traffic anomalies. Real-time
analysis may rely on less sophisticated analysis because of the resource demands and imminence of attacks.
Previous work has shown that a postmortem analysis of traffic volume (in bytes) can reveal changes in traffic patterns [4], [9], [10]. In this dissertation, we also study the effectiveness of such analysis in real-time analysis of traffic data. Real-time analysis may enable us to provide means of online detection of anomalies while they are in progress. Real-time analysis may employ smaller amounts of data in order to keep such analysis simple and efficient. At the same time, the data cannot be so small that meaningful statistical conclusions cannot be drawn. Data smoothing techniques can be employed to overcome such difficulties. However, real-time analysis may also require that any indications of attacks or anomalies be provided with short latencies. This tension between robustness and latency of anomaly detection makes real-time analysis more challenging.
Our approach passively monitors packet headers of network traffic at regular intervals, and generates signals/images of this packet header data. These signals/images are analyzed to find whether any abnormalities are observed in the traffic. Recent studies have shown that the traffic can have strong patterns of behavior over several timescales [4], and our work will show the possibility of analysis of WSS (wide-sense stationary) property in network traffic [5]. Recent work in [11] has shown that Gaussian approximation could work well for aggregated traffic. Self-propagating and automated malicious codes perturb normal network traffic patterns in general. By observing the traffic and correlating it to the previous normal states of traffic, it may be possible to see whether the current traffic is behaving in a similar/correlated manner. The network traffic could look different because of flash crowds, changing access patterns, infrastructure problems such as router failures, and DoS attacks. In case of anomalous traffic such as flash crowds and DoS attacks, the usage pattern of network may be
changed and peculiarities could be represented in the generated signals/images. When anomalies are detected, further analysis can characterize the anomalies by their nature into several categories (random attack, targeted attack, multi-source attack, portscan attack etc.) and help in mitigating the attacks. Our approach relies on analyzing packet header data in order to provide indications of possible abnormalities in the traffic.
B. Previous Research
When there are insufficient resources (like bandwidth) under a large network load, we need to know which flow is receiving more than its fair share of service for detecting DoS attacks staged by few flows. The RED (random early detection) can be interpreted as a statistical method of using random selection to act selectively on high rate flows without keeping per-flow state information even though it is not effective on the non-responsive traffic. [12]. SACRED, LRU (least recent used)-RED, and LRU-FQ employ partial state to enhance the success of detecting large flows, which find a non-responsive UDP flow by monitoring flows above certain policy driven rate [13], [14], [15]. SRED (stabilized RED) shows that the misbehaving UDP sources can be identified by comparing with a zombie list [16].
Many approaches have been studied to detect, prevent and mitigate the malicious activities. For example, rule-based approaches, such as IDS (intrusion detection system), try to match the established rules to the potential DoS attack from external incoming traffic near the victims. To cope with novel attacks, IDS is required to be updated with the latest rules [17], [18]. In contrast, some approaches proactively seek a method that suppresses the overflowing of traffic at the source [19]. Controls based on rate limits [20] have been adopted for reducing the monopolistic consumption of available bandwidth to diminish the effects of attacks, either at the source or destination [19], [21], [22]. The most apparent symptoms of bandwidth attack may be sensed through
monitoring bit rates [23] and packet counts of the traffic flow. Bandwidth accounting mechanisms have been suggested to identify and contain attacks [24], [25], [26], [27], [28]. Work in [27] making entries similar to the LRU cache by sampling, all subsequent packets belong to the entries are monitored. To reduce the false alarm error due to high sampling probability, it exploits parallel multistage filters combined with early removal, which require a large memory and may be not effective for aperiodic burst traffic. Packeteer [29] and others offer commercial products that can account traffic volume along multiple dimensions and allow policy-based rate control of bandwidth. Pushback mechanisms have been proposed to contain the detected attacks closer to the source [22], [26], [30]. Traceback techniques have been proposed to trace the source of DDoS attacks even when the source addresses may be spoofed by the attacker [31].
Recently statistical analysis of aggregate traffic data has been studied [4], [9], [10]. The work in [4], [9] have studied traffic volume as a signal for wavelet analysis and this earlier work have considerably motivated our current study here. The work in [10] has shown the application of wavelets to network traffic data. Our study builds on this earlier work and extends the statistical analysis of traffic data further. Fourier transforms have been applied to network traffic to study its periodicity [32].
Various forms of signatures have been traditionally utilized for representing the contents or identities. In digital information retrieval, the signature that is constructed by taking several hash values is applied for indexes representing words [33]. Traffic analysis signatures have been proposed for detecting anomalies. For example, disproportion of bi-directional flows can be used as a signature of anomalistic traffic [34]. The changing ratios (i.e., the rate of decrease) between the flow numbers of neighboring specific bit-prefix aggregate flows can be used for detecting peculiarities [35].
A number of popular monitoring tools such as FlowScan, Cisco’s FlowAnalyzer, and AutoFocus [6], are used as traffic analyzers. FlowSan is open source software to gather and analyze network flow data taken from NetFlow records of Cisco routers [7]. In the FlowScan, cflowd writes raw flow files that wait to be post-processed by flowscan for providing against heavy-traffic flows or flood-based DoS attacks. However, excessive backlog of flow files may make real-time analysis difficult. Using FlowScan, characterization of anomalous network traffic behavior can be described at the flow level [36].
Recently traffic volume metrics, such as byte counts and packet rates, have been analyzed using wavelets to detect anomalies in network traffic [4]. While earlier work analyzed traffic as a time series of a single variable, our work here also tries to analyze distributions over different domains of packet header data, particularly the address space and port number space [37]. Our work also brings the tools from image processing and video analysis to traffic analysis.
Sketch-based techniques are shown to perform close to that of per-flow methods for network traffic analysis [38]. The technique employs multiple hash functions on address to generate data for traffic analysis. To detect significant changes, it implements a time series forecasting model on top of such summaries, which may be not useful for movable attacks because it will miss estimations that do not appear again after they experience significant change. A bloom filter [39] is a method for representing a set of n elements in
m (≤ n) hash values to support membership queries. For each element, the bits at positions from independent hash functions are set to ‘1’, where a particular bit might be set to ‘1’ multiple times. Given a query for b, we check the bits at positions from hash values. If any of them is ‘0’, then certainly b is not in the set. Otherwise we conjecture that b is in the set although there is a certain false positive probability, which is a clear trade-off between m and the false positive rate. Recent work in [40] has similarly
employed 3 hash functions and LRU-like caching for extracting traffic attack patterns. While hashing techniques are general and powerful, (a) it is harder to identify the source or destination of attacks without additional work due to one-way functionality (b) randomization makes it harder to infer general trends or styles of attack as they happen. Our approach, though not as general, can be considered to employ four specific hash functions on the address space, while still allowing visualization of traffic patterns. The visualization part of the work in [40] has some similarities in visualization of network traffic (with significant differences in data representation and anomaly detection).
Much of the work reported here draws from the large body of work in wavelet analysis, image processing and video analysis. Various forms of approaches have been traditionally utilized for detecting scene changes in image processing. There are methods based on DC coefficients of the each transformed block in the image [41], color histogram differences [42], characteristic patterns in the standard deviation of pixel intensities for detection of fades [43], and color histogram of DC coefficients [44]. The existing methods have mainly been targeting the object in the center of camera focus, yet, the network image processing is necessary to consider the entire space due to uncertainty of attacks.
C. Contributions and Outline
The rest of the dissertation is organized as follows. In chapter II, we discuss our approach and generation of traffic signal. In chapter III, we describe the wavelet transform of the address correlation signal and the experimental results of the anomaly detection mechanism, in both postmortem and real-time. In chapter IV, we introduce the image-based modeling of network traffic and its statistical analysis. In chapter V, we introduce the various traffic signals that have been proposed for analysis and anomaly detection and comprehensively evaluate the effectiveness of these various signals. Our
analysis is based on a number of real world traces. Our analysis employs both statistical measures and measures based on classical NP (Neyman-Pearson) Test employed in signal detection theory. Chapter VI concludes our dissertation and provides directions for future work.
In this dissertation, we will report on our measurements conducted on real traces of traffic at four major networks. This dissertation will make the following significant contributions: (a) studying the feasibility of correlation of destination IP addresses through signal processing such as wavelet analysis, (b) employing packet header data as images for traffic visualization, (c) employing image processing and compression techniques for efficiently storing and processing such traffic data, (d) evaluates the effectiveness of such measures in detecting and identifying the attacks in real-time with very small latencies, (e) provides a comprehensive evaluation of effectiveness of a number of different signals derived from network traffic headers, (f) provides an approach based on classical NP Test for evaluating the effectiveness of network traffic signals and (g) shows that statistical techniques can be as effective or sometimes more effective than the NP Test because of changing attack patterns.
CHAPTER II
AGGREGATED TRAFFIC ANALYSIS
This chapter presents our approach and methodology, and discusses the use of data structure for computing traffic signals/images of packet header data.
A. Traffic Analysis at the Source
We focus on analyzing the traffic at a network’s edge. Traffic monitoring at a source network enables a detector to detect attacks early, to control hijacking of AD (administrative domain, e.g., campus) machines, and to limit the squandering of resources.
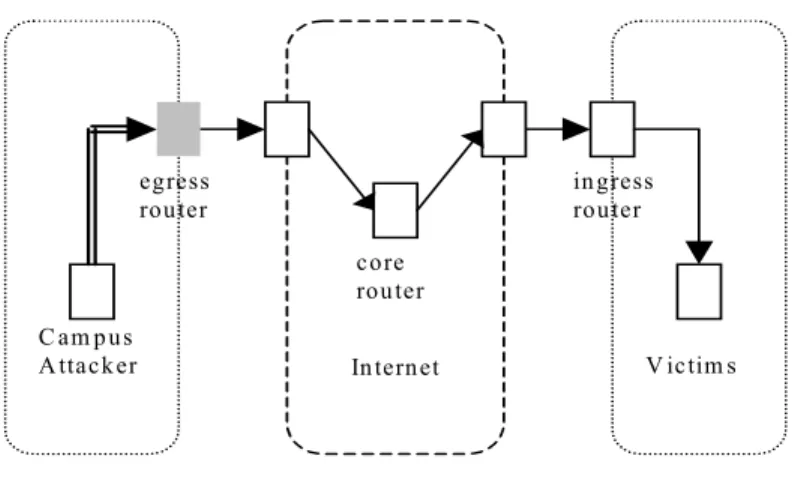
There are two kinds of filtering based on traffic controlling point. Ingress filtering protects the flow of traffic entering into an internal network under administrative control. Ingress filtering is typically performed through firewall or IDS rules to control inbound traffic originated from the public Internet. On the other hand, egress filtering controls the flow of traffic originating from the internal network. Thus, internal machines are typically the origin of this outbound traffic in view of an egress filter. As a result, the filtering is performed at the AD edge [45]. Fig. 1 conceptually illustrates the various filtering points for inspection of the network traffic. Outbound filtering has been advocated for limiting the possibility of address spoofing i.e., to make sure that source addresses correspond to the designated addresses for the AD. With such filtering in place, we can focus on destination addresses and port numbers of the outgoing traffic for analysis purposes.
Our approach is based on the following observations: the outbound traffic from an AD is likely to have a strong correlation with itself over time since the individual accesses have strong correlation over time. Recent studies have shown that the traffic
can have strong patterns of behavior over several timescales [4] and a time series of packet bytes per time slot are not independent but indeed rather strongly correlated [11]. For example, the traffic over a week looks very similar to the next week. Similarly, the traffic over a day exhibits a strong correlation across the next few days. It is possible to infer that some correlation exists on their weekly or daily consumption patterns. We hypothesize that the destination addresses will have a high degree of correlation for a number of reasons: (i) popular web sites, such as yahoo.com and google.com, are shown to receive a significant portion of the traffic, (ii) individual users are shown to access similar web sites over time due to their habits, and (iii) long-term flows, such as ftp download and video accesses, tend to correlate addresses over longer timescales. If this is the case, sudden changes in correlation of outgoing addresses can be used to detect anomalies in traffic behavior. For example, a denial of service attack on a single target machine will likely increase the correlation of addresses during the attack period. Similarly, a worm attack on many random addresses will likely decrease the correlation of addresses. This hypothesis (which needs to be verified) suggests that address correlation across samples could be a useful signal.
C am p us
A ttack er In ternet V ictim s egress rou ter in gress rou ter core rou ter
Fig. 1. The various filtering points.
This hypothesis is corroborated by the data shown in Table 1. The table shows the correlation of addresses across different times of day based on NZIX-II traces from NLANR (National Laboratory for Applied Network Research) [46]. The traces are sampled for 90 seconds every 3 hours and analyzed from three different viewpoints. The flows are defined by triple of destination address, destination port and protocol, and specially using 24-bit prefix destination IP address. The subject of investigation is the top 100 flows in packet counts instead of all of the flows. The packets of the top 100 flows occupy about 95% of all the packets. The first row named ‘adjacency’ shows the recurrence of destination addresses between adjacent 3-hour periods. For the 8-am column, a total of 44 addresses reappear from the previous 5-am instant. The second row titled ‘persistency’ explains the lasting continuance of addresses from the 2-am instant through the day. It is observed that 27 of the top 100 addresses persist from 2-am point to the top 100 addresses of 8-am instant. The last row titled ‘previous day’ illustrates the persistence of popular addresses in the same time points across two consecutive days. It is observed that 33 of the top 100 addresses remained the same in the 8-am instant across two different days. The correlation would be higher if we considered the traffic volume to these addresses.
TABLE 1
ADDRESS PERSISTENCE IN SUCCESSIVE PERIODS
Hit ratio (%) Sampling instances
2 am 5 am 8 am 11 am 2 pm 5 pm 8 pm 11 pm
adjacency 33 38 44 32 38 33 35 33
persistency 100 38 27 21 20 19 18 16
A second approach to using addresses as useful signals is based on the hypothesis that traffic (byte volume or packet volume or the number of flows) distributions over the address domain (source, destination or the two together) could be different during normal and attack periods. If this were the case, the anomalies can be detected by analyzing the traffic distributions over the underlying domain.
B. General Mechanism of the Detector
Our detection mechanisms can be explained in three major steps as shown in Fig. 2. Traffic is sampled at regular intervals to obtain a signal that can be analyzed through statistical techniques and compared to historical norms to detect anomalies.
The first step is a traffic parser, in which the address correlation/image signal is generated from packet header traces or NetFlow records as input. In this step, the network traffic is first filtered to produce a signal that can be analyzed. So far, we have discussed how correlation of destination addresses may be used as a potential signal. The particular signal that is employed may depend on the nature of the traffic. Fields in the packet header, such as addresses and port numbers, and traffic volume can be used as a signal. Packet header data, due to its discrete nature, poses interesting problems for analysis as discussed later. Sampling may be used to reduce the amount of data at this stage. The generations of address correlation and image signal are explained in chapter II and IV.
Fig. 2. The block diagram of our detector.
Network Traffic
Signal Generation & Data Filtering (Address Correlation & Image) Statistical or Signal Analysis (Wavelet Transform or DCT) Anomaly Detection & Identification (Thresholding) Detection Report
The second step involves data transformation for statistical analysis. In this dissertation, we employ Discrete Wavelet Transform (DWT) and Discrete Cosine Transform (DCT) to study the address and port number correlation and distribution over several timescales. Wavelet transforms have been employed to study the traffic volume earlier [4], [9], [10]. Unlike previous work, we selectively/individually reconstruct decomposed signal across specific timescales based on the nature of attacks. Our wavelet analysis of traffic signals is explained in chapter III and DCT approach is explained in chapter IV.
The final stage is detection and identification, in which attacks and anomalies are checked using thresholds. The analyzed information will be compared with historical thresholds of traffic to see whether the traffic’s characteristics are out of regular norms. Sudden changes in the analyzed signal are expected to indicate anomalies. This comparison will lead to some form of a detection signal that could be used to alert the network administrator of the potential anomalies in the network traffic. We report on our results employing correlation of destination addresses and distribution of image-based signal as traffic signals in chapter III and IV. In this dissertation, we identify the suspicious attackers/victims and estimate the movement of attack patterns using motion prediction algorithms as explained in chapter IV. The efficacy of these signals for anomaly detection is carefully evaluated in chapter V.
C. Approach
To verify the validity of our approach, we employ trace-driven evaluation of the developed techniques. We run our algorithm on four traces of network traffic.
First, we examine our method on traces from the University of Southern California, which contains real network attacks in the pcap header format. Additionally to inspect the performance of our detector on backbone links, we examine the mechanism on two
kinds of KREONet2 traces from July 21, 2003 to July 28, 2003, and from Oct. 12, 2003 to Oct. 26, 2003 which contain real worm attacks. Currently KREONET (Korea Research Environment Open NETwork) member institutions are over 230 organizations, which include 50 government research institutes, 72 universities, 15 industrial research laboratories, etc [47]. KREONet2 trace is a collection of NetFlow trace files generated by the router which is connecting KREONet2 and STAR TAP with the 155Mbps international ATM link. KREONet2 is also peering with Abilene using this link. Over tens of thousands of systems in Korea's universities and research institutes are using this link, and most of traffic from Abilene and STAR TAP bound for Korea's research institutes and universities is also using this link. In the 2nd traces employed, there are 5 major attacks as described in Table 2 and a few instantaneous probe attacks. It generates 4345 samples in case of 2-minute sampling period. Among the observations, the suspected activities reach to 782 times, which are judged by traffic engineering. Third, to compare our method with Snort (an IDS tool), we examine the mechanism on a live network in Texas A&M University (TAMU) campus.
Moreover, to evaluate the sensitivity of our detector’s performance over attacks of various configurations, we employ the packet traces from the NLANR (National Laboratory for Applied Network Research), which are later superimposed with
TABLE 2
THE DESCRIPTIONS OF FIVE ATTACKS IN KREONET2 TRACES
1 2 3 4 5 Duration 5.3 h 4.5 h 4.1 hours 12.3 h 3.6 h IP semi-random random a random semi-random random random
Protocol TCP UDP TCP/UDP TCP/UDP/ICMP UDP
Port #80 #1434 random/#1434 #80 / #1434 / #0 #1434
Size 48B 404B random/ 404B 48B / 404B/ 28B 404B
simulated virtual attacks [46]. We employ Auckland-IV traces for these experiments collected at the University of Auckland Internet access link for 45 days. These IP header traces are utilized in length from 3 days to several weeks. Outbound traffic in these traces transmitted about 5000 connections at the rate of 5Mbps and 1500 packets/second. These traces were anonymized, but preserved IP prefix relationships.
1. Simulated Attacks
Besides the actual attacks observed in the USC, KREONet2 and TAMU traces, we construct virtual attacks on the Auckland-IV traces. This allows us to test the proposed technique under different conditions. We consider nine kinds of combinational attacks as shown in Table 3. These attacks cover a diversity of behaviors and allow us to deterministically test the efficacy of proposed mechanisms. The particular behaviors of these attacks have been motivated by recent SQL Slammer [48] and Code Red attacks. These are classified by following criteria.
• Duration: The first 6 attacks continue to assail for 2 hours. The remaining 3 attacks last for 1 hour.
TABLE 3
THE NINE KINDS OF SIMULATED ATTACKS
1
(2, I, SD) (2, I, SR) 2 (2, I, R)3 (2, P, SD)4 (2, P, SR)5 (2, P, R)6 (1, P, SD) 7 (1, P, SR) 8 (1, P, R)9
Duration 2h 2h 2h 2h 2h 2h 1h 1h 1h
Persistency intermittence int. int. persistence per. per. per. per. per.
IP single destination semi- randoma random b single destination semi- random random single destination semi- random random
Protocol ICMP TCP UDP ICMP TCP UDP ICMP TCP UDP
Port #80 random #1434 #80 random #1434 #80 random #1434
Size random 4KB 404B random 4KB 404B random 4KB 404B
a. Code Red
• Persistency: The first 3 attacks send malicious packets for 3 minutes and pause for 3 minutes. Such pattern is repeated through the attack duration. While the filtering may mitigate the overhead of the attacker’s continuing scan traffic, a more sophisticated attacker might have stopped scanning. It may be possible to conceal attacker’s intentions through repeating attack and pause periods. So, it is intended to model intelligent and crafty attackers that attempt to dilute their trails. The other remnant attacks continue to assault throughout the attack period.
• IP address: The 1st attack among every 3 attacks targets for a single destination IP address. In a hypothetical situation, the attackers target a famous site such as the White House, CNN or Yahoo etc. This target may be really one host in case of 32-bit prefix, occasionally aggregated neighboring hosts in case of /x bit prefix. The 2nd attack style imitates from the IP address generation scheme of the notorious Code Red II worm. That is to say, a portion of addresses preserve the class-A and a partition of addresses preserve class-B for the infiltration efficiency. The 3rd type is randomly generated address that was used for the Code Red I and SQL Slammer worm.
• Protocol: The three major protocols, ICMP, TCP and UDP, are exploited in turn • Port: The 1st port among every 3 attacks is a representative #80 that stands for the
reserved ports for well-known services. The 2nd port targets for randomly generated destination ports. It is useful to detect port-scan that is used to probe a loosely defensive port. The 3rd port is a #1434 that acts for the ephemeral client ports, which was exploited in SQL Slammer worm
• Size: There are three different byte counts of packets. The three denominations are random size, 4KBytes and 404Bytes [45].
Our attacks can be described by a 3-tuple (duration, persistency and IP address). We superimpose these attacks on ambient traces.
The mixture ratios of attack traffic and normal traffic range from 1:2 to 1:10 in packet counts in our experiments. The detection performance is slightly affected by
mixture ratios. Replacement of normal traffic with attack traffic is easier to detect and hence not considered here.
D. Data Structure for Computing Signal
Our approach collects packet header data at an AD’s edge over a time period that is the sampling period. Individual fields in the packet header are then analyzed to observe anomalies in the traffic. Individual fields in the traffic header data take discrete values and show discontinuities in the sample space. For example, IP address space can span 232 possible addresses and addresses in a sample are likely to exhibit many discontinuities over this space making it harder to analyze the data over the address space. In order to overcome such discontinuities over a discrete space, we convert packet header data into a continuous signal through correlation/distribution of samples over successive samples.
To investigate the ensembles of a random process, a correlation coefficient which is a normalized measure of the strength of the linear relationship between random variables is usually employed [5], [49]. For each address, am, in the traffic, we count the number
Fig. 3. The autocorrelation function of the correlation coefficient signal (Fig. 5(a)) over 2 days. We could infer that the traffic has a close positive address correlation.
of packets, pmn, sent in the sampling instant, sn. We can define IP address correlation
coefficient signal in sampling point n as follows.
n n n n m mn n m mn n n mn m mn n s s p p p p p p p p p p n and in counts packet of s mean value the are and where , ) ( ) ( ) ( * ) ( ) ( 1 1 2 2 1 1 1 1 − − − − − − ∑ − ∑ − − ∑ − = ρ (2.1)
Fig. 5(a) shows the IP address correlation coefficient signal of the NLANR traces over 3 days by (2.1) which illustrates a close positive correlation between adjacent samples. Moreover, we analyze the similarity over time using autocorrelation function as shown in Fig. 3. If the level of aggregation in the number of flows and sampling duration is high such that spontaneous changes in the traffic get buried, we could assume that outbound traffic have a high degree of correlation over time.1 Recent work in [11] shows that traffic would likely exhibit such properties at the edges of ADs.
In this dissertation, we employ a simplified correlation/distribution of time-series for computational efficiency in practice without compromising performance. This weighted correlation signal generation phase for destination addresses is explained below. Similarly the image-based signal generation scheme is illustrated in chapter IV.
In order to compute full 32-bit address correlation signal, we consider two adjacent sampling instants. We define address correlation signal in sampling point n as
∑ ∑
= m pmn− pmn m pmn n
C( ) 1* / (2.2) If an address am spans the two sampling points n-1 and n, we will obtain a positive
contribution to C(n). A popular destination address am contributes more to C(n) than an
infrequently accessed destination, since we consider the number of packets being sent to the identical address.
In order to minimize storage and processing complexity, we employ a simple but powerful data structure. This data structure, which is named count, consists of 4 arrays
“count [4]”. Each array expresses one of the 4 fields in an IP address. Within each array,
we have byte-sized 256 locations, for a total of 4*256 bytes = 1024 bytes. A location
count [i][j][n] is used to record the packet count for the address j in ith field of the IP address in time interval n through scaling. This provides a concise description of the address instead of 232 locations that would be required to store the address occurrence
uniquely. We filter this signal by computing a correlation of the address in two success samples, i.e., by computing
3 , 2 , 1 , 0 , ] ][ ][ [ ] ][ ][ [ ] 1 ][ ][ [ ] 1 ][ ][ [ 255 0 255 0 255 0 = ∑ ∑ ∗ ∑ − − = = = = i n j i count n j i count n j i count n j i count C j j j in (2.3)
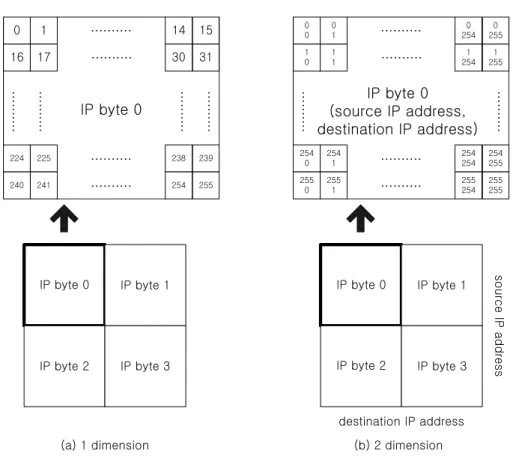
Fig. 4 depicts the data structure that consists of the 2-dimensional array count[i][j]. The 1st dimension array corresponds the 4 byte segments of the IP address (separated by a dot in the normal IP address representation), and is represented to be 4 rows in the data structure. The 2nd dimension indicates the 256 entries of each IP address byte segment, and is expressed as the 256 columns in each row.
We illustrate this data structure through an example. Suppose that only five flows exist, their destination IP addresses and packet counts are as follows.
0 64 128 192 255
2 3 2 10 1
10 2 3 1 2 1 2 12 3
2 1 10 2 3
IP of Flow1 = 165. 91. 212. 255, P1 = 3
IP of Flow2 = 64. 58. 179. 230, P2 = 2
IP of Flow3 = 216. 239. 51. 100, P3 = 1
IP of Flow4 = 211. 40. 179. 102, P4 = 10
IP of Flow5 = 203. 255. 98. 2, P5 = 2
All entries in the count arrays are initialized to zeros. The packet counts of each flow are recorded to the corresponding position of each IP address segment as shown in Fig. 4.
In order to compute the correlation signal at the end of sampling point n, we simply multiply normalized values in the same position between the two data structures of samples n-1 and n, then sum up the multiplied values in each byte segment separately. Consequently four correlation signals are calculated as C0n through C3n.
In general, such an approach of domain space reduction will reduce the domain space from 2n to (n/k)*2k, where k (= 8, above) is the basis for folding the domain space. The employment of this approximate representation of addresses allows us to reduce the computational and storage demands by a factor of 222.
In order to generate the address correlation signal S(n) at the end of sampling point n, we multiply each segment correlation Cin with scaling factors αi and generate S(n) as
1 , ) ( * ) ( 3 0 3 0 + ∑ = ∑ = = = i i i iCin B where A n S α α (2.4)
This data structure has following advantages.
• The running time of the signal generation diminishes from O(n) to O(lgn).
• It uses a constant, small amount of memory regardless of the number of packets or flows.
• It is possible to identify the target IP addresses using reversibility of the data structure even though our approach can be considered to employ four specific
hash functions on the address space. By assembling the highest valued position in each of the 4 fields, specific attack objectives can be drawn. In Fig. 4 of the above example, we can induce that 211.40.179.102 as target IP address of Flow4
when the positions of the highest value in each field are combined.
By properly choosing the scaling factors, we can obtain appropriate aggregation of address space. In this dissertation, we employ α0 = α1 = α2 = α3 =1/4. On the other hand,
we could employ different weights to give preferences to different portions of the address segments. For example, making C2n = C3n = 0 by setting α2 = α3 = 0, we only
consider /16 addresses.
Our approach could introduce errors when the addresses segments match even though addresses themselves don’t match. For example, if traffic consists of w1.x1.y1.z1
and w2.x2.y2.z2 in sample n-1 and w1.x1.y2.z1 and w2.x2.y1.z2 in sample n, even though the actual address correlation is zero, our method of computing address correlation results in a high correlation between these sampling instants.
Fig. 5. Comparison among signals of autocorrelation coefficient, full 32-bit correlation and our data structure.
In normal traffic without attacks, we compared the full-32 bit address correlation with the correlation signal generated by our approach. Fig. 5(b) and 5(c) show the weighted correlation signal computed with the full-32 bit address by (2.2) and our data structure by (2.3) and (2.4) with respect to Auckland-IV traces. From the figure, we see that the differences are negligible i.e., our approach does not add significant noise. From a statistical point of view, they have an approximately same mean (about 50) and degree of dispersion (standard deviation ≅ 12.4 ~ 12.6). Moreover, we examine the similarity of above signals with cross-correlation coefficient which is normalized measure of linear relationship strength between variables. Suppose X(t) is correlation coefficient r.v. (random variable) defined by (2.1), Y(t) is full 32-bit r.v. by (2.2) and Z(t) is weighted correlation r.v. by (2.3) and (2.4). From Fig. 6, their cross-correlation coefficients are ρXY(0) ≈ 0.91, ρXZ(0) ≈ 0.85 and ρYZ(0) ≈ 0.77, respectively.2 Based on these results,
we will employ signal of Fig. 5(c) for reducing the processing complexity in this dissertation.
2 Too small sample size might grow incorrect statistical measures.
Fig. 6. The cross-covariance functions show that the random variables of three kinds of signals are to be correlated.
Specially, correlation coefficients are the zeroth lag of the covariance functions. These covariance functions normalize the sequence so the auto-covariances at zero lag are identically 1.0.
CHAPTER III
ADDRESS CORRELATION SIGNAL-BASED ANOMALY DETECTION We propose a traffic anomaly detector, operated in postmortem and real-time, by passively monitoring packet headers of traffic. In this chapter, we suggest a technique for traffic anomaly detection based on analyzing correlation of destination IP addresses in outgoing traffic at an egress router. This address correlation data are transformed using discrete wavelet transform for effective detection of anomalies through statistical analysis. Results from trace-driven evaluation suggest that proposed approach could provide an effective means of detecting anomalies close to the source. We also present a multidimensional indicator using the correlation of port numbers as a means of detecting anomalies.
A. Discrete Wavelet Transform (DWT)
1. Data Transform
The generated signal can be, in general, analyzed by employing techniques such as FFT (Fast Fourier Transform) and wavelet transforms. The analysis carried out on the signal may exploit the statistical properties of the signal such as correlation over several timescales and its distribution properties. FFT of traffic arrivals may reveal inherent flow level information through frequency analysis. Wavelet transform of traffic traces has been employed in [4], [9]. We employ wavelet transforms, in this chapter, for analyzing the traffic signal.
Wavelet techniques are one of the most up-to-date modeling tools to exploit both non-stationary and long-range dependence [50], [51], [52], [53] and to analyze the properties of data series [54], [55]. In real situations, we encounter signals which are
characterized by abrupt changes and it becomes essential to relate to the occurrence of an event in time. Since wavelet analysis can reveal scaling properties of the temporal and frequency dynamics simultaneously unlike Fourier Transform used in [32], we compute a wavelet transform of the generated address correlation signal over several sampling points. Through signal can be detected in certain timescales and in certain positions of the timescales, we can induce the frequency and temporal components simultaneously.
Wavelet Transform plays a similar role as if a matched filter is employed to synchronize known signal and maximize SNR (Signal-to-Noise Ratio) from received noisy signal in communication system.
2. Discrete Wavelet Transform
We provide a brief overview of DWT (Discrete Wavelet Transform) in order to make our scheme clearer. DWT consists of decomposition (or analysis) and reconstruction (or synthesis). Fig. 7 illustrates a multilevel one-dimensional wavelet analysis using specific wavelet decomposition filters (Lo_D and Hi_D are the low-pass (or scaling) and high-pass (or wavelet) decomposition filters) and the reconstruction of the original signal [56].
s s cA3 Lo_D Hi_D 2 2 cD1 cA1 Lo_D Hi_D 2 2 Lo_D Hi_D 2 2 cD2 cA2 cD3 Lo_R Hi_R 2 Lo_R Hi_R 2 Lo_R Hi_R 2 2 2 cD3 cA3 cD2 cD1
Fig. 7. A multilevel two-band wavelet decomposition and reconstruction. cA2
For decomposition, starting from a signal s, the first level of the transform decomposes s into two sets of coefficients, namely approximation (or scaling) coefficients cA1, and detail (or wavelet) coefficients cD1. The input s is convolved with
the low-pass filter Lo_D to yield the approximation coefficients. The detail coefficients are obtained by convolving s with the high-pass filter Hi_D. This procedure is followed by down sampling by 2. Suppose that the length of each filter is equal to N. If T =
length(s), the each convolved signal is of length T + N - 1 and the coefficients cA1 and
cD1 are of length L = floor((T+N-1)/2). The second level decomposes the approximation
coefficient cA1 into two sets of coefficients using the same method, substituting s by cA1,
and producing cA2 and cD2, and so forth. At level j, the wavelet analysis of the signal s
has the following coefficients, [cAj, cDj, cDj-1, cDj-2, ... , cD2, cD1].
Detail coefficients, cDj,t and approximation coefficients, cAj,t at level j are obtained
as follows. s filter nd low-pas igh-pass a are the h D Lo and D Hi where, cA D Lo cA cA D Hi cD cA D Lo cA cA D Hi cD s D Lo cA s D Hi cD N n j t n T t j N n j t n T t j N n t n T t N n t n T t N n t n T t N n t n T t ) _ ( ) _ ( ) _ ( , ) _ ( ... ) _ ( , ) _ ( ) _ ( , ) _ ( 1 0 1,2 1 mod , 1 0 1,2 1 mod , 1 0 1,2 1 mod , 2 1 0 1,2 1 mod , 2 1 0 2 1 mod , 1 1 0 2 1 mod , 1 ∑ = ∑ = ∑ = ∑ = ∑ = ∑ = − = − +− − = − +− − = +− − = +− − = +− − = +− (3.1)
For reconstruction, starting from two sets of coefficients at level j, that is the approximation coefficients cAj and detail coefficients cDj, the inverse DWT synthesizes cAj-1, up-samples by inserting zeros and convolves the up-sampled result with the reconstruction filters Lo_R and Hi_R. Let L be the length of cA and cD, and N be the length of the filters Lo_R and Hi_R, then length(s) = 2*L-N+2. For a discrete signal of length T, DWT can consist of log2T levels at most.
3. Timescale Selection
We iterate analysis level up to 8, which depends on the number of samples, in case of the postmortem analysis, so our final analysis coefficients are [cA8, cD8, cD7, cD6, cD5, cD4, cD3, cD2, cD1]. We specify a daubechies-6 two-band filter. If we use all coefficients for reconstruction, we would restore the original weighted correlation signal. Due to the decimating operator, at level j, we have T/2j-sized coefficients. That is, the filtered signal is down-sampled by 2 at each level of the analysis procedure; the signal of each level has an effect that sampling interval extends 2 times. Consequently it means that the wavelet transform identifies the changes in the signal over several timescales. When we use t minutes as sampling interval, the time range at level j spans t*2j minutes. For instance, when we use 1-minute sampling interval, the cD1 equals to 1*21 = 2 minute interval, the cD2 equals 1*22 = 4 minute interval and so on. These time ranges can independently sample and restore frequency components of 1/t*2j+1 by the Nyquist sampling theorem.
B. Statistical Analysis
1. Detection Mechanism
The reconstructed signal is used for detecting anomalies. The postmortem analysis and detectors can rely on data sets over long periods of time. However, real-time detection requires that the analysis and the detection mechanism rely on small data sets in order to keep such online analysis feasible. As explained earlier, smaller data sets raise the possibility of many false alarms. Larger data sets may increase the latency of detection even when online analysis of such data sets is feasible. We took the following
moving window approach to accommodate faster detection while reducing the false alarms.
At each sampling instance, we construct the correlation signal S(n). We consider p
samples, S(n-p+1), S(n-p+2),…, S(n-1) and S(n) for the computation of DWT at the sampling point n. We call p, the analysis (DWT) window. And we consider q (≤p)
samples, S(n-q+1), S(n-q+2),…, S(n-1), and S(n) for anomaly detection. We call q, the
detection (DET) window. To reduce false alarms due to instant noise, we use a majority
over the detection window to detect anomalies. If q/2 or more of the samples in the detection window are above the anomaly threshold, we consider that an anomaly is detected at the sampling point n. This majority detector requires that traffic exhibit anomalous behavior over several sampling points (at least q/2 in a window of q samples) for a successful detection. When q is large, we can keep false alarms low. However, larger q also increases latency of anomaly detection since such a majority function
D W mW mW (1-m)W T where,
D is the attack duration in wavelet signal
W is detection (DET) window size (=qt, t is sampling interval)
T is maximum indication time
m is the majority factor for decision (typically, 1/2)
delays the attack detection for at least q/2 sampling periods. As a result, attacks smaller than q/2 sampling periods are likely to be not detected. We illustrate these timing observations in Fig. 8 and (3.2).
D + W < T | D -W | ) D/W (1, min < 0 for )W, 2 -(1 + D = T W D ≤ ≤ ≥ m m m (3.2)
Based on Fig. 8, the detectable attack duration time is the half of the detection widow width at least when m is ½. Detection indication signal, T, expands from mW to D+(1-m)W. According to selected m value, the period of T is changeable between |W-D| and W+D. And the latency of detection is mW. The empirical results, however, show the variable latency depending on the attack strength and threshold level.
2. Selective Reconstruction in DWT
We simulate two classes of attacks based on persistence, namely the first 3 attacks are ON/OFF styled attacks and remaining six attacks are persistent attacks. Our postmortem analysis allows the administrator to choose the timescales over which attacks/anomalies detection is desired. The network operator can analyze the traffic successively at different sampling times or choose to analyze the traffic at multiple timescales at the same time. Because of the time-scaled decomposition of the wavelets we are able to detect changes in the behavior of the network traffic that may appear at some resolution but go un-noticed at others.
The first three attacks described in (*,I,*) have an ON/OFF timing of 3 minutes. This signal could be effectively detected by only the 1st coefficient of the DWT in case of 1-minute sampling period. If the network administrator concentrates over 30-1-minute duration attack signal, he/she can select a higher-level coefficient (for example, cD5), for detecting designated attacks instead of cD1.
The last six attacks expressed in (*,P,*) are persistent attacks. Attacks last for 1 hour at a minimum. It means that we could choose the cD5, cD6 and cD7 levels among all the coefficients for reconstruction that are equivalent to 32 minutes, 1 hour 4 minutes and 2 hour 8 minutes respectively, in the case of 1-minute sampling interval.
Our approach lets the network operator select the reconstructed levels over which the anomalies need to be analyzed. Our approach allows the administrator flexibility to analyze the anomalies at multiple timescales simultaneously. To demonstrate the feasibility of our composite approach, we focus on the evaluation of our scheme over the nine types of attacks discussed earlier. In order to detect these attacks, we extract only the 1st, 5th, 6th and 7th levels in decomposition and reconstruct the signal based only on coefficients at these levels.
3. Thresholds Setting Through Statistical Analysis
We develop a theoretical basis for deriving thresholds for anomaly detection. When a random variable X(t) possesses mean µ and variance σ2, we can express Chebyshev’s inequality in terms of the number of standard deviations from the mean:
k k
X
P( − µ ≥ σ)≤ 1 2 (3.3)
The Chebyshev inequality can suggest the lower bound of confidence level, however, the inequality does not take into account the actual distribution and therefore it is often rather loose. If we assume that the reconstructed signal has a normal distribution, we can design suitable analysis and detection techniques to detect anomalies with high confidence while reducing the false acceptances. Study in [11] has shown that Gaussian approximation should work well for aggregated traffic if the level of aggregation in the number of traffic sources and observed time scales is high enough such that individual
sources are swallowed due to Central Limit Theorem. Our data sets satisfy the necessary criterion for the minimal level of such an approximation.
To verify our methodology, we select only some levels of the DWT decomposition of the ambient trace free of attacks and reconstruct the signal based on those levels. We then look at some statistical properties. Fig. 9(d) shows the histogram of the reconstructed signal of the ambient Auckland-IV traces in postmortem mode. The postmortem transformed data without attacks have mean 0 and standard deviation 3.38 as shown in Fig. 9(b). We verify normality of the Fri/Sun data in Table 4 through the Lilliefors test for goodness of fit to a normal distribution with unspecified mean and variance [56]. The postmortem transformed data have a normal distribution at 5% significance level, namely X~N(0, 3.382). The original weighted correlation data fail to Fig. 9. The distribution of the ambient traces without attacks.
(a) and (c) are distribution before wavelet transform, (b) and (d) are distribution after wavelet transform.
![Fig. 4 depicts the data structure that consists of the 2-dimensional array count[i][j]](https://thumb-us.123doks.com/thumbv2/123dok_us/9085586.2400432/37.918.273.689.156.293/fig-depicts-data-structure-consists-dimensional-array-count.webp)