Abstract—In this work, the trans-esterification between palm
kernel oil (PKO) and ethanol was investigated in order to produce a petroleum-free fuel for jet-engine. The combined effect of temperature, catalyst concentration, reaction time, and molar ratio of reactants to fatty acid ethyl ester (FAEE) production were optimized using the response surface methodology (RSM). The optimum condition to produce 97.6% of ethyl esters was obtained at 48 oC, 120 min reaction time, molar ratio 9:1 and catalyst concentration 1 wt%. The FAEE mixture was then fractionated to obtain only medium chain FAEE which possessed the bio-jet fuel characteristics. The properties of the bio-jet met the standard ASTM and EN biofuels in term of ethyl esters content. Finally, the fuel combustion was tested by using a small scale jet engine with lower emission of CO, NO2, HC compared to conventional kerosene.
Index Terms—Bio-jet fuel, palm kernel oil, fatty acid ethyl
ester, gas turbine engine.
I. INTRODUCTION
The large fluctuation in the price of fuels, the increasing in environmental concern along with the need to reduce greenhouse gas emissions were major impulses to the development of alternative renewably clean fuels [1]. While biodiesel is used worldwide as a renewable replacement of diesel fuel, no comparable replacement is available for jet engine fuel (kerosene) at sufficient volume. Bio-jet is an alternative, renewable fuel used for gas turbine engine which the main focus is not only in air traffic, but also in power. Modern gas turbines burn the fuel at very high temperatures and can reach very high speeds with a high stability and short start-up time. Small variations of gas turbines have been used in hybrid vehicles, the company Jaguar, to charge the battery of the electric motor, and so the usage was significantly increased. Several studies indicated that the synthetic alcohols, synthetic hydrocarbons from sugars and hydrogen could be possibly used as gas turbine alternative fuels. Biomass-based biofuel production represents a pivotal approach to face high energy prices and potential depletion of fossil fuels, to reduce greenhouse gas emissions and to enhance a sustainable economy.
Aviation liquid fuels can be derived from different materials by different methods [2]. The production of bio-jet based on trans-esterification process has not been reported so far. In the trans-esterification, a triglyceride reacts with an alcohol in the presence of strong acid or base, and thereby
Manuscript received November 13, 2016; revised April 7, 2017. The authors are with Suranaree University of Technology, Thailand (e-mail: [email protected], [email protected]).
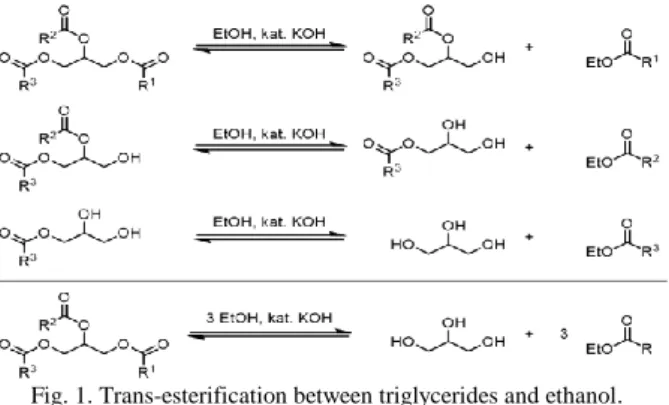
produces a mixture of fatty acid alkyl esters and glycerol [3]. Fatty acid alkyl esters are the newest form of energy that have been attracted attention. The overall process is a sequence of three consecutive and reversible reactions (Fig. 1). The stoichiometric reaction requires 1 mol of a triglyceride and 3 mol of the alcohol. However, an excess of alcohol is used to increase the yields of ethyl ester and to allow its phase separation from the glycerol (undesired product). Ethanol was used instead of methanol, since ethanol was produced from agricultural renewable resources, and had lower human toxicity than methanol. In addition, ethanol is preferable to methanol not only due to its much higher dissolving power oils but also the lower cloud and pour points of the formed FAEE than the methyl esters [4]. The base-catalyzed transesterification of vegetable oils proceeds faster than the acid-catalyzed reaction [5]. It has been reported that the most desirable FAEE properties were obtained using KOH as the catalyst in many studies [6], [7]. On the other hand, palm kernel oil (PKO) was used as material in this study. Oil palm is the highest vegetable oil production in Thailand, followed by coconut oil and soybean oil. PKO is oil obtained from the kernel of the palm fruit, its production within Thailand in 2012 is approximately 0.64 million tons per year and still increased by the year. Fatty acid mostly in PKO are including several types from C8-C20 [8].
Fig. 1.Trans-esterification between triglycerides and ethanol.
Moreover, trans-esterification process was affected by various operating parameters. The reaction temperature, catalyst concentration, ethanol to oil molar ratio and reaction time are the main parameters that influence on the FAEE yield [9], [10]. Thus, the trans-esterification reaction was designed and optimized using Response surface methodology (RSM). RSM is a set of mathematical and statistical methods for modeling and problem analysis which its advantage is the reducing number of experimental runs required to generate sufficient information for acceptable results. Then, the fractional distillation for FAEEs production was applied to produce bio-jet fuel. Fractional distillation is the most
Development of Bio-Jet Fuel Production Using Palm Kernel
Oil and Ethanol
common form of separation technology used in petroleum refiner, natural gas processing, etc [11]. Furthermore, the fractional distillation based on the trans-esterification process for the bio-jet fuel has not been reported so far.
In this work, a new feasible development of bio-jet production using PKO as a substrate was studied including the optimization parameters for the conversion of FAEEs from trans-esterification reaction, the fractionation distillation of FAEE leads to the physicochemical properties of bio-jet fuel to meet the conventional jet fuel standard, and the engine testing coupled with the emission determination. Fuel characterization results for the produced PKO bio-jet through the ASTM and EN standard fuel tests are reported.
II. PROCEDURE A. Materials
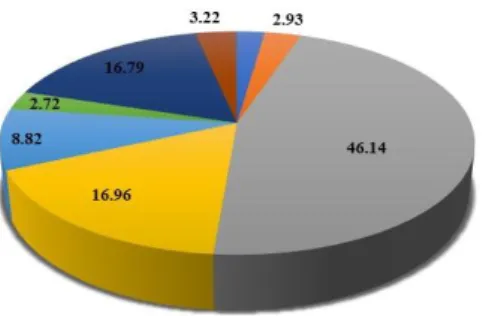
Palm kernel oil was purchased from the Chumporn palm oil industry, Thailand. The fatty acids concentration of PKO was specified using Gas Chromatography (Agilent GC, 7890A, USA) (Fig. 2). Ethanol (99.5%) was produced from the Biotechnology’s laboratory, Suranaree University of Technology, Thailand. Gas turbine engine PST, J800R was obtained from PST jet, Thailand (Fig. 3). Potassium hydroxide (KOH) were purchased from Sigma (Singapore).
Fig. 2.Fatty acid contents in PKO.
Fig. 3.Gas turbine engine.
B. Trans-esterification Experiment
The trans-esterification reactions were carried out in 250
mL flask reactor, provided with a thermostat, mechanical stirring. The reactor was preheated to 75 oC to eliminate moisture, and then 100 g of PKO was added. When the reactor reached the temperature set-up for each reaction, the ethanol and the catalyst were added, in the amounts established for each experiment and stirring system was kept constant at 280 rpm. Each mixture was vigorously stirred and recorded for the required reaction time. After the reaction finished, the excess of ethanol was distilled off under vacuum. Since ethanol distributes favorably in the aqueous phase, the more residual ethanol in the reactor, the more difficult phase separation is formed [12]. The trans-esterification product was transferred to stand in a separating funnel for glycerol separation. The glycerol layer separated from the ester layer within an hour (Fig. 4) After separation of the two layers, crude FAEE was washed several times with hot distilled water (50 oC) in separation funnel until neutral pH. Finally, the water present was eliminated by heating at 115 oC. The purified FAEE were then analyzed via standard EN14103 using Gas Chromatography (GC). An Agilent Technology GC 7890A /MSD 5975C with an Agilent 7693A automated liquid sampler was configured at the following conditions. The column was HP-INNOWAX, 50 m x 0.2 mm id x 0.4 µm, column flow rate of 0.6 mL.min-1and helium as the carrier gas. The initial oven temperature was 40 oC (hold for 2 min) with a programming rate of 14 oC /min to 140 oC(hold for 2 min) then 6 oC /min to 290 oC (hold for 9 min). The maximum temperature was 310 oC and run time of 45.143 minutes. The FAEE samples were identified and then the peak areas were utilized to quantify the FAEE content. The fatty acid ethyl ester content in each experiment was calculated via the following equation:
%FAEE=(∑A)-AEI)/ AEI × (CEI × VEI)/W×100 (1) Which, FAEE content has unit in %wt, ∑A is total peak area of ester (g), AEI is peak of ethyl heptadecanoate (internal standard), CEI is concentration of ethyl heptadecanoate solution (mg/ml), VEI is the volume of ethyl heptadecanoate (ml), and W is the weight in milligram of sample.
Fig. 4. Settling stages for separation of FAEE and glycerol.
C. Experimental Design and Optimization Process
experiments. The code and uncoded levels of the independent variables were shown in Table I.
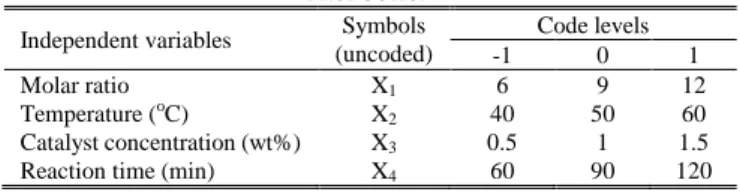
TABLE I: EXPERIMENTAL LEVEL OF INDEPENDENT VARIEABLES FOR FAEE PRODUCTION
Independent variables (uncoded) Symbols Code levels
-1 0 1
Molar ratio X1 6 9 12
Temperature (oC) X2 40 50 60
Catalyst concentration (wt%) X3 0.5 1 1.5
Reaction time (min) X4 60 90 120
The behavior of the system discussed was described by a quadratic equation, Eq. (2), which follows Ref. [13], [14]. A multiple regression data analysis was carried out with the statistical package (Stat Soft Inc., Tulsa, Okla., USA). The optimum values of selected variables were obtained by solving the regression equation and also by analyzing the response surface contour plots:
(2) where Y is the predicted FAEE yield; βo, βj, βij and βjj are
constant model coefficients; xi and xj are the coded
independent variables or factors; ε is random error.
To determine the effect of treatment, data were analyzed using one-way analysis of variance (ANOVA) repeated measures. Response surface plots was developed using the fitted quadratic polynomial equation obtained from regression analysis, holding two of the independent variables at constant value corresponding to the stationary point and changing the other two variables. P-values of less than 0.05 were regarded as significant.
TABLE II: BOILING POINT OF FAEES
Organic acids Source Boiling point (C)
Caprylic acid (C8:0) Triglyceride 207 Capric acid (C10:0) Triglyceride 245 Lauric acid (C12:0) Triglyceride 259 Myristic acid
(C14:0) Triglyceride 265
Palmitic acid
(C16:0) Triglyceride 303
Stearic acid (C18:0) Triglyceride 215 (15 mmHg) Oleic acid (C18:1) Triglyceride 218 (15 mmHg) Linoleic acid
(C18:2) Triglyceride 224 (17 mmHg)
D. Fractional Distillation Process
Due to the different boiling point of each FAEE in PKO, fractional distillation was used to produce bio-jet fuel by separating the lower boiling point C8-C14 FAEEs from the mixture (Table II.). Experiment of fractional distillation process for bio-jet production was carried out as following Fig. 5. Mixture of purified FAEE was put into reactor, which was covered by the first jacket. It was filled up by thermal oil, and connected to the oil bath, which was set up at 165 oC. Vacuum pump was controlled at 25 mbar with the pressure indicator. When the reactor was at 165 oC, C8-C14 FAEE in the mixture were become a vapor and went to the top of the reactor which was connected to the fractional column. The second jacket applied at fractional column was controlled the temperature of the column. The fraction column was set up at
131 oC using that jacket, this due to if the components had higher boiling point such as C20 FAEE, was not be able to fractionate, and was maintained in the reactor. The vapor was condensed using Condenser (Kontes, USA). The temperature for the condenser was maintained at -4 oC using Cooler (Chiller, Thailand). Reactor was stirred by motor coupled with the controller at 800 rpm. The higher value of stirrer speed was done for mixing well of the mixture and reduce the time for heating up. In order to reducing the losses of the distillated FAEE C8-C14 and extended longer life for the vacuum pump, the cold trap -30 oC was included in the system to trap all of the loosen product. The distillated FAEE C8-C14 was then determined using GC-MS and was used for further analytical method for fuel properties.
Fig. 5.Fractional distillation laboratory system.
E. Engine Testing and Fuel Properties
The properties of C8-C14 FAEE or bio-jet fuel was analyzed according to the EN and ASTM standard by Scientific Equipment Center Prince of Songkla University, Thailand.
Different properties of the distillated FAEE C8-C14 or bio-jet were determined: density at 15 oC (ASTM D1298), kinetic viscosity at 40oC (ASTM D445), carbon residue (ASTM D4530), flash point (ASTM D93), cloud point (ASTM D2500), pour point (ASTM D97), acid number (ASTM D664), copper corrosion (ASTM D130), content of phosphorus, calcium, magnesium by ICP-OES, sulfated ash (ASTM D874), total contaminant (ASTM D5452), iodine value (EN 14111), sulfur content (XRF), oxidation stability at 100 C (EN 15751), mono, di- and triglyceride content (EN 14105), free and total glycerin (EN 14105). Energy density of the product was measured using Bomb calorimeter. Moreover, the performance of gas turbine engine was carried out using FAEE C8-C14 (bio-jet). The concentration of CO, CO2, NO2 and hydrocarbon (HC) from the exhausted gas from the engine was measured using Testo 350 Portable Emission Analyzer.
III. RESULTS AND DISCUSSION
A. Optimization of Faee from Trans-Esterification- Fitting the Model and Evaluation
As mentioned above, RSM was used to optimize trans-esterification reaction from evaluation the interaction
2
0 1 j j i j ij j i 1 jj j
k k
Y X X X X
j j
factors, experiments were performed at varying physical parameters by Central Composite Designs (CCD). The empirical model was constructed from experimental data and the significant of each variable term in the model was analyzed through p and F – value. The reliability of fitted models was determined by analysis of regression coefficient including F-value, p-value, R2, adjR2, predicted R2, and %C.V., respectively (Table III). Experimental yield was analyzed to get a regression model. The predicted values of FAEE were calculated using the regression model and compared with the experimental values.
TABLE III: REGRESSION ANALYSIS [ANOVA] Sources of
variation
Sum of squares
F- value
P- value R
2 Adj
R2 C.V.
% Model 3360.45 7.13 0.001 0.941 0.901 7.51 Residual 370.09
Total 3730.54
The model F-value of 7.13 was implied that this model is significant. There was only a 0.12% chance that an F-value could occur due to noise. Values of probability p-value was shown less than 0.0500, indicated that this model terms are significant. The lack of fit F-value of 12.86 implies the lack of fit is not significant relative to the pure error. Non-significant lack of fit is good since the model is required to be fitted. This fit of the model was checked with the coefficient of determination R2. The large value of coefficients of the multiple determination (R2= 0.941) reveals that the model adequately represents the experimental results.
TABLE IV: F-VALUE AND P-VALUE, REGRESSION COEFFICIENT OF THE PREDICTED MODEL FOR EACH VARIABLES
Factors FAEE
(%) Sources
Standard
error F-value P-value
0 88.42 Model 2.30 7.13 0.0012
Linear
1 4.99 X1 1.37 19.46 0.0010
2 2.30 X2 1.37 2.83 0.1207
3 6.74 X3 1.37 24.29 0.0005
4 6.03 X4 1.37 13.30 0.0038
Interaction
1 2 -1.30 X1 X2 1.45 0.81 0.3874 1 3 -1.15 X1 X3 1.45 0.62 0.4460 1 4 -0.48 X1 X4 1.45 0.11 0.7443 2 3 0.82 X2 X3 1.45 0.32 0.5854 2 4 1.40 X2 X4 1.45 0.93 0.3555 3 4 -0.91 X3 X4 1.45 0.39 0.5442 Quadratic
12 -10.48 X12 3.62 8.35 0.0147
22 -6.45 X22 3.62 3.17 0.1027
32 -1.70 X32 3.62 0.22 0.6489
42 2.52 X42 3.62 0.48 0.5015
The effect of the variables as linear, quadratic or interaction coefficients on the response was tested for significance by ANOVA. The p–value lower than 0.05 indicated the dependent variables were significantly difference at 95% confident interval. It means that, the variation of the data around the fit model was small and the predicted models fitted the experimental data sufficiently. The mark of the regression coefficient specified trends effect to the dependent variables as positively and negatively. Evaluations of independent
parameter in fitted model for each dependent variable were determined. According to Table IV, three factors including molar ratio (X1), catalyst concentration (X3), and retention time (X4) affected to FAEE production. Catalyst concentration and molar ratio of ethanol to oil are the most significant variables for FAEE production, in which catalyst concentration has strongly effect on ethyl esters production. Increasing in catalyst concentration accelerates the speed of the trans-esterification reaction. The same results were reported by [15], [16] in the optimization of FAEE conversion from waste canola oil and used frying oil, respectively. Temperature is not significant effect to ethyl esters, noted that, the chosen optimum conditions took into the consideration temperature which are important in defining the operational cost of bio-jet fuel. Moreover, the C.V. resulted at 7.51% indicating that FAEE in this model were in acceptable range since a model can be considered logically reproducible if the C.V. is less than 10% [17]. The point predictions of the models were completed (Table V). All of experimental values of FAEE concentration were in a range of 95% confident interval. As a result, the empirical model of FAEE production were extremely confident and suitable for application.
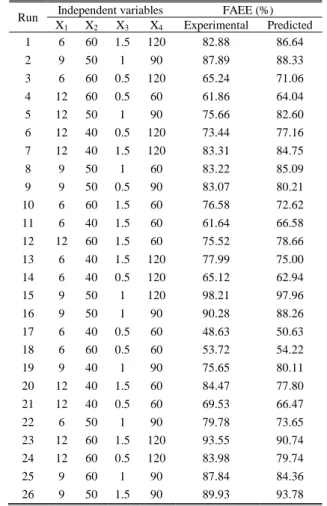
TABLE V: CCD ARRANGEMENT OF CODED LEVEL OF VARIABLES IN THE RSM DESIGN
Run Independent variables FAEE (%) X1 X2 X3 X4 Experimental Predicted 1 6 60 1.5 120 82.88 86.64
2 9 50 1 90 87.89 88.33
3 6 60 0.5 120 65.24 71.06 4 12 60 0.5 60 61.86 64.04
5 12 50 1 90 75.66 82.60
6 12 40 0.5 120 73.44 77.16
7 12 40 1.5 120 83.31 84.75
8 9 50 1 60 83.22 85.09
9 9 50 0.5 90 83.07 80.21
10 6 60 1.5 60 76.58 72.62
11 6 40 1.5 60 61.64 66.58
12 12 60 1.5 60 75.52 78.66 13 6 40 1.5 120 77.99 75.00 14 6 40 0.5 120 65.12 62.94
15 9 50 1 120 98.21 97.96
16 9 50 1 90 90.28 88.26
17 6 40 0.5 60 48.63 50.63
18 6 60 0.5 60 53.72 54.22
19 9 40 1 90 75.65 80.11
20 12 40 1.5 60 84.47 77.80 21 12 40 0.5 60 69.53 66.47
22 6 50 1 90 79.78 73.65
23 12 60 1.5 120 93.55 90.74 24 12 60 0.5 120 83.98 79.74
25 9 60 1 90 87.84 84.36
26 9 50 1.5 90 89.93 93.78
Analysis of RSM and Optimization Process
catalyst concentration was applied. However, with 1.5 wt% of catalyst, led the production of large amount of soap, thus decrease the FAEE production, since the addition of an excessive amount of catalyst increased emulsion formation, similar to research of [18].
When PKO reacted with KOH dissolved in ethanol, there were two reaction pathways: transesterification and saponification. KOH was a catalyst on transesterification and also a reagent on saponification reaction. When saponification was favored, KOH was lost and the overall process rate decreased. On the other hand, the trans-esterification could be favored when adequate temperature was used. When temperature increased, the reaction rates were obviously higher because molecules had more energy, trans-esterification reaction was faster than the saponification reaction, thus FAEE concentration increased. When operating at higher temperature, the saponification rate speeded up also, therefore FAEE decreased (Fig. 7).
Fig. 6. Response surface contour for interaction on FAEE between temperature and catalyst concentration.
Fig. 7. Response surface contour for interaction on FAEE between temperature and molar ratio.
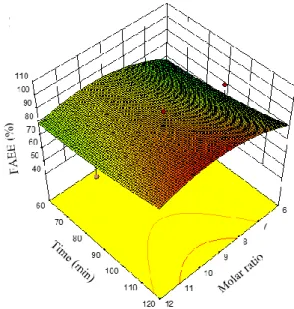
The 3D response surface plots on Fig. 8 indicated that ethyl esters increased when ethanol concentration increase. Moreover, greater ethyl esters conversion with high molar rario of ethnol in longer time, which similar to [19]. Vice versa, Tanaka et al. reported that the esters conversion
achieved at high values at shorter time of reaction, this due to the using of methanol [20]. Furthermore, an excessive amount of alcohol affects the separation and made the recovery of glycerol difficult [21], [22]. When glycerol remained in mixture, it helped driving the reverse reaction, thereby lowering the product of FAEE. Fillieres et al. and Noureddin et al. had hypothesized that the purity of ethyl esters depends on the excess of alcohol [3], [23]. For ratio less than 9:1, the reaction was incomplete. At molar ratio of 12:1 the glycerol separation was difficult and the apparent yield of esters decreased. Moreover, it is possible to observe that higher FAEE achieved at molar ratio 9:1 with large catalyst concentration (1 wt%) (Fig. 9). At lower molar ratio, FAEE could be increased with the increasing of catalyst concentration. Howerver, the excess of catalyst would affect to further step such as catalyst removal. Thus applying a suitable concentration of catalyst would result in an efficent process.
Fig. 8. Response surface contour for interaction on FAEE between reaction time and molar ratio.
Fig. 9.Response surface contour for interaction on FAEE between molar ratio and catalyst.
when yield of 98.21% was achieved. The ester yield increases as the molar ratio also increased up to a value of 9:1. Table VI indicated that the value of molar ratio for ethanol (9:1) was higher than the molar ratio found by Freedman et al. in methanol [5], however it was lower than molar found by Encinar et al. [4]. Thus molar ratio 9:1 seems to be the most appropriate. Several researchers had found similar results for FAEE production [23]-[25].
TABLE VI:OPTIMUM VALUES OF THE PROCESS PARAMETERS
Parameters Optimum values
Ethyl esters (%) 97.6
Molar ratio (X1) 9:1
Temperature (X2) 48
Catalyst concentration (wt.%) (X3) 1
Time (min) (X4) 120
The optimum value temperature was 48 oC. This temperature was under the boiling point of alcohol. Therefore, molar ratio is used between 6:1 to 9:1, since it did not evaporate. Study of Encinar et al. achieved the best temperature result at 75 oC, higher than this study [4]. However, depend on the oil used for trans-esterification, different temperature would be applied. The highest ethyl ester yields were achieved when the reaction time was 120 min. Other authors reported that similar yields of FAEE may be obtained however, the reaction times required to attain them are very different: methanolysis is quicker than ethanolysis [26]. And the optimum value of catalyst concentration was at 0.98 wt.%. This value agrees with the values duly presented in the literature [3]. As a typical catalyst concentration for transesterification reactions (0.5 to 1.5 wt.%), the results that were obtained agreed with those obtained from the response surface analysis, confirming that the RSM was effectively used to optimize for FAEE production.
B. Fractional Distillation from 20l Trans-esterification Process
Fig. 10. 20L reactor of trans-esterification and phase separation.
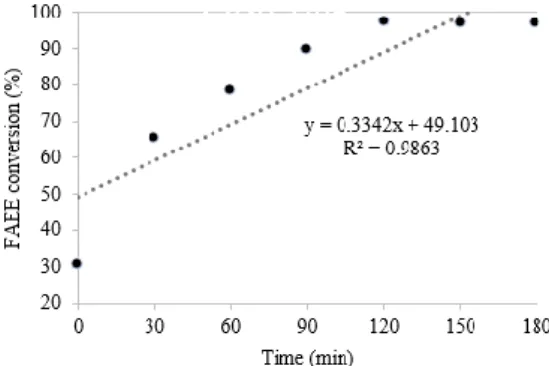
Trans-esterification reaction was carried out in 20 L reactor at the optimal parameters 9:1 molar ratio ethanol/oil, 1 wt.% potassium hydroxide, 48oC. Phase separation was occurred between PKO ethyl esters and glycerol at certain time (Fig. 10). The FAEE production at optimum condition was formed as equilibrium phase, shown on Fig. 11, extend the reaction time was also resulted in the increasing of FAEE production, however it is slightly different. After glycerol and catalyst
removal, mixture of FAEEs was used to produce bio-jet fuel (FAEE C8-C14) using fractional distillation. The rotary fractional distillation system was applied to synthesis jet-fuel. As mentioned above, the range of boiling point of FAEEs were different, from 207 to 265 oC for bio-jet fuel. The vapor liquid phase equilibrium of myrictis acid ethyl ester (represents the highest boiling point of C8-C14 bio-jet) and palmitic acid ethyl ester (represents the lowest boiling point of the heavy FAEEs) were shown on Fig. 12(a). It was formed an ideal system without aezotrope, thus strongly obtained that the fractional distillation would be efficient for produce bio-jet fuel.
Fig. 11. FAEE production equilibrium at optimum condition.
(a)
(b)
Fig 12. (a) Vapor liquid phase equilibrium of myristic acid ethyl ester (C14) and palmitic acid ethyl ester (C16) and (b) component profiles during time of
fractional distillation system. Including C12, C14, C18:0 and C18:2.
(a)
(b)
Fig. 13.(a) Gas chromatography of purity PKO-biojet and (b) PKO bio-jet fuel production (C8-C14 FAEE).
C. Properties of Bio-jet Fuel and Gas Turbine Engine Testing
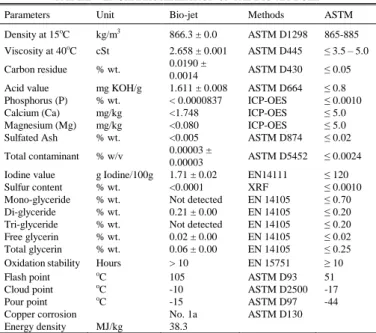
In evaluating the suitability of the PKO-biojet as alternative jet the ASTM biofuel, standard test procedures was used to characterize the PKO-biojet. The test results and the standard limit as recommended by ASTM and EN. The standard limits ASTM and EN above was reported by George et al., Viele et al. [27], [28]. Table VII contained the general and the FAEE from C8-C14 according to the ASTM and EN standards.
Among the general parameters for bio-jet, the viscosity controlled the characteristics of the injection from the gas engine injector. The viscosity of FAEE could go very high levels and hence it was important to control it within an acceptable level to avoid negative impacts on fuel injector system performance. The kinematic viscosity at 40 oC for PKO bio-jet was 2.658 cSt. This result was acceptable within the requirement of ASTM specification for bio-jet fuel, not much higher than the conventional jet fuel (2.37 cSt), indicating that PKO bio-jet could be used in gas turbine engines. Higher viscosity fuels can cause poor fuel combustion that leads to deposit formation as well as higher in cylinder penetration of the fuel spray.
Carbon residue of fuel is indicative of carbon depositing tendencies of the fuel and an approximation of the tendency for carbon deposits to form in engine. The carbon residue measured according to the ASTM standard for the PKO bio-jet was 0.2%. This result was in the agreement with the requirement of ASTM standard. However, the acid value did not meet the standard ASTM, it ranged higher that the limits specified by the standard (0.8 mg KOH/g), this due to the process neutrallize was not complete and needed to be improved for engine. The phosphorus and the sulfur content was proven to be almost at zero of the ethyl esters sample. The requirement is necessary to reduce sulfuric acid pollutant emissions and to protect exhausted catalyst systems when they
were developed on the gas turbine engine in the future. The flash point of a fuel is the temperature at which it will ignite when exposed to a flame or spark. The flash point of the PKO bio-jet was 105 C. A lower flash point is an indication of the presence of alcohol not properply removed from the bio-jet. A higher flash point means that the alcohol which is of lower flash point had been removed and fuel may only ignite at higher temperature. The flash point of bio-jet fuel is higher than the conventional jet fuel, which is safe and non hazardous for transportation purpose [29]. From the perspective of storage and fire hazard, bio-jet is much safer than jet fuel. Moreover, the oxidative stability is major industry issue for jet and bio-jet fuels. The result was in agreement with the requirements of ASTM standard. Unlike bio-jet, some types of biodiesel was instable in oxidation, it may result in fuels that have unacceptable low flash point after storage, which the degree of saturation of the fatty acid chains tended to be correlated with its stability.
TABLE VII:CHARACTERIZATION OF THE BIO-JET FUEL
Parameters Unit Bio-jet Methods ASTM
Density at 15oC kg/m3 866.3 ± 0.0 ASTM D1298 865-885
Viscosity at 40oC cSt 2.658 ± 0.001 ASTM D445 ≤ 3.5 – 5.0
Carbon residue % wt. 0.0190 ±
0.0014 ASTM D430 ≤ 0.05
Acid value mg KOH/g 1.611 ± 0.008 ASTM D664 ≤ 0.8
Phosphorus (P) % wt. < 0.0000837 ICP-OES ≤ 0.0010
Calcium (Ca) mg/kg <1.748 ICP-OES ≤ 5.0
Magnesium (Mg) mg/kg <0.080 ICP-OES ≤ 5.0
Sulfated Ash % wt. <0.005 ASTM D874 ≤ 0.02
Total contaminant % w/v 0.00003 ±
0.00003 ASTM D5452 ≤ 0.0024
Iodine value g Iodine/100g 1.71 ± 0.02 EN14111 ≤ 120
Sulfur content % wt. <0.0001 XRF ≤ 0.0010
Mono-glyceride % wt. Not detected EN 14105 ≤ 0.70
Di-glyceride % wt. 0.21 ± 0.00 EN 14105 ≤ 0.20
Tri-glyceride % wt. Not detected EN 14105 ≤ 0.20
Free glycerin % wt. 0.02 ± 0.00 EN 14105 ≤ 0.02
Total glycerin % wt. 0.06 ± 0.00 EN 14105 ≤ 0.25
Oxidation stability Hours > 10 EN 15751 ≥ 10
Flash point oC 105 ASTM D93 51
Cloud point oC -10 ASTM D2500 -17
Pour point oC -15 ASTM D97 -44
Copper corrosion No. 1a ASTM D130
Energy density MJ/kg 38.3
XRF= X-Ray Fluorescence Spectrometer
standard.
The energy density of a potential fuel impacts on the range with payload and high energy density is vital in trying to maximize the passenger and cargo capacity while retaining range. Where weight capacity is the limiting factor, as is the case with most civil aviation flights, it is desirable to have a fuel that produces high energy per unit mass whereas in applications in which range is to be maximized. The volumetric energy content of the fuel is the most important parameter, and a higher volumetric energy content is desirable [33]. The PKO bio-jet in this study was found to have an energy content of 38.3 MJ.kg-1, lower when compared to the conventional jet fuel 42 MJ.kg-1. This may affect to the fuel consumption of the engine due to fuel consumption was proportional to volumetric energy density of the fuel based on the lower heating value. Lower engery density values results in high fuel consumption when operating engine, thus increase the cost process. This may need to improve in future, by blendling with some additive compounds or with the conventional jet fuel.
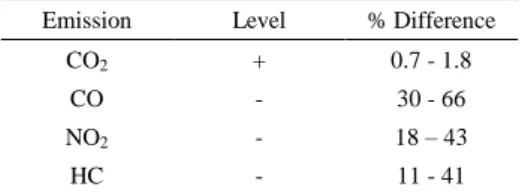
TABLE VIII:THE DIFFERENCE OF EMISSION LEVEL BETWEEN THE OBTAINED BIO-JET AND CONVENTIONAL KEROSENE
Emission Level % Difference
CO2 + 0.7 - 1.8
CO - 30 - 66
NO2 - 18 – 43
HC - 11 - 41
D. Emission Characteristics of PKO Bio-Jet Fuel
In the combustion process, bio-jet fuel is mixtures of hydrocarbons, compounds that contain hydrogen and carbon atoms. In perfect engine, oxygen in the air would convert all of the hydrogen in fuel to water and all of carbon in fuel to carbon dioxide. In reality, the combustion process is not perfect and the engines emit several types of pollutants. The difference values between PKO bio-jet fuel and conventional jet fuel was measured and obtained on Table 8, in which positive and negative represents the higher and lower percentage of PKO jet fuel to the conventional jet.
The amount of CO2 produced when a fuel burned is a function of the carbon content of the fuel. Carbon dioxide does not directly impair human health, but it is considered a “greenhouse gas”. The heat content, or the amount of energy produced when a fuel is burned, is mainly determined by the carbon (C) and hydrogen (H) content of the fuel. During complete combustion, C and H combine with oxygen (O2) to produce carbon dioxide (CO2) and water (H2O). As shown on the table, the produced bio-jet was obtained at higher content CO2 than the conventional jet with the acceptable value (<5%, the acceptable value of clean burning), indicating that bio-jet was resulted in efficiency fuel for engine with completely burning. Nevertheless, incomplete combustion occurs when the supply of air or oxygen is poor. During incomplete combustion, water is still produced but part of the carbon is not completely oxidized producing carbon monoxide (CO). Bio-jet fuel was burned with completely process, resulted in lower CO than conventional jet around 35%, strongly confirmed that PKO bio-jet fuel would become the
replacement for gas engine fuel in the future. Furthermore, incomplete combustion resulted in the using fuel inefficiently and the carbon monoxide produced is a health hazard, particularly dangerous to persons with heart disease.
For the hydrocarbon (HC) emissions, HC result when fuel molecules in the engine do not burn or burn only partially. HC react in the presence of nitrogen oxides (NO2) and sunlight to form ground-level ozone, a major component of smog. Ozone can irritate the eyes, damage lungs, and aggravate respiratory problems. It is our most widespread urban air pollution problem. The conventional jet fuel was produced in high value of HC, strongly effect to the environment (Table VIII).
With the difference value in nitrogen oxides about 18-43%, bio-jet fuel was achieved as clean burning compared to the conventional jet fuel. Under the high pressure and high temperature conditions in an engine, nitrogen and oxygen atoms in the air we breathe react to form various nitrogen oxides. In this study, nitrogen dioxide like hydrocarbons, are precursors to the formation of ozone. They also contribute to the formation of acid rain. Since the greenhouse gas emission and pollutant concern were increasing, PKO bio-jet fuel production was achieved as perfect replacement for the gas turbine engine in the next future.
IV. CONCLUSION
Bio-jet has become more attractive to replace petroleum jet fuel. Trans-esterification reaction of palm kernel oil and ethanol was carried out using potassium hydroxide as catalyst. In order to obtain FAEE with high conversion, the catalyst concentration, reaction temperature, molar ratio of ethanol/oil and reaction time were optimized using Response surface methodology. The high regression coefficient of the polynomial showed that the model was well fitted to the experimental data. The optimum concentration for molar ratio ethanol to oil, catalyst, reaction time and temperature were 9:1, 1 wt.%, 120 min and 48 °C, respectively. At the optimum conditions, the maximum FAEE concentration was 98.21 wt.%. And then, fractional distillation was succesful applied to produce FAEE bio-jet fuel C8-C14 at pressure 25 mbar and the controlled temperature as mentioned. A high percentage of PKO bio-jet 96.84 was distilled from the system. Finally, the PKO bio-jet fuel had acceptable properties of standard ASTM and EN. Moreover, PKO bio-jet fuel was obtained at lower emission of CO, NO, HC with the combustion which not only completely but also clean at the same conditions testing compared to the conventional jet fuel.
ACKNOWLEDGMENT
This work was financially supported by the Agricultural Research Development Agency Public organization (ARDA), Thailand under contract no. CRP5805020290
REFERENCES
[1] K. Mayor and R. S. J. Tol, “The impact of European climate change regulations on international tourist markets,” Transportation Research
Part D: Transport and Environment, vol. 15, no. 1, pp. 26-36, 2010.
[3] H. Noureddini, and D. Zhu, “Transesterification of soybean oil,” J. Am.
Oil Chem. Soc., vol. 74, pp. 1457–1463, 1997.
[4] J. M. Encinar, J. F. Gonzalez, J. J. Rodriguez, and A. Tejedor, “Biodiesel fuels from vegetable oils: Transesterification of Cynara
cardunculus L. oils with etanol,” Energy Fuels, vol. 16, pp. 443–450,
2002.
[5] B. Freedman, E. H. Pryde, and T. L. Mounts, “Variables affecting the yield of fatty esters from transsesterified vegetable oils,” J Am Oil
Chem Soc., vol. 61, no. 10, pp. 1638–1643, 1984.
[6] A. A. Refaat, S. T. El Sheltawy, and U. Sadek, “Optimum reaction time, performance and exhaust emissions of biodiesel produced by microwave irradiation,” Int. J. Environ. Sci Tech., vol. 5, pp. 315-322, 2008.
[7] I. Roy and M. N. Gupta, “Applications of microwaves in biological sciences,” Curr. Sci., vol. 85, pp. 1685-1693, 2003.
[8] M. Pearlson, C. Wollersheim, and J. Hileman, “A techno-economic review of hydroprocessed renewable esters and fatty acids for jet fuel production,” Biofuels, Bioproducts and Biorefining, vol. 7, no. 1, pp. 89-96, 2013.
[9] A. Atabani, A. Silitonga, I. A. Badruddin, T. Mahlia, H. Masjuki, and S. Mekhilef, “A comprehensive review on biodiesel as an alternative energy resource and its characteristics,” Renew. Sustain. Energy Rev., vol. 16, pp. 2070–2093, 2012.
[10] Z. Yaakob, M. Mohammad, M. Alherbawi, Z. Alam, and K. Sopian, “Overview of the production of biodiesel from Waste cooking oil,”
Renew. Sustain. Energy Rev., vol. 18, pp. 184–193, 2013.
[11] H. Z. Kister, Distillation Design, 1st ed., McGraw-Hill., 1992. [12] M. E. S. Oliveira, L. Pantoja, W. F. Duarte, C. F. Collela, L. T.
Valarelli, R. F. Schwan, and D. R. Dias, “Fruit wine produced from cagaita. Eugenia dysenterica DC) by both free and immobilized yeast cell fermentation,” Food Research International, vol. 44, no. 7, pp. 2391-2400, 2011.
[13] G. E. P. Box, W. G. Hunter, and J. S. Hunter, “Statistics for experimenters: An introduction to design, data analysis and model building,” John Wiley, New York, 1978.
[14] G. E. P. Box and K. B. Wilson, “On the experimental attainment of optimum conditions,” J. R. Stat. Soc., vol. 13, pp. 1–45, 1951. [15] A. Bouaid, M. Martinez, and J. Martinez, “A comparative study of the
production of ethyl esters from vegetable oils as a biodiesel fuel optimization by factorial design,” Chem. Eng. J., vol. 134, pp. 93–99, 2007.
[16] X. Yuan, J. Liu, G. Zeng, J. Shi, J. Tong, and G. Huang, “Optimization of conversion of waste rapeseed oil with high FFA to biodiesel using response surface methodology,” Renew. Energy, vol. 33, pp. 1678–1684, 2008.
[17] S. T. Ahmad, M. Natochin, N. O. Artemyev, and J. E. O'Tousa, “The Drosophila rhodopsin cytoplasmic tail domain is required for maintenance of rhabdomere structure,” FASEB J., vol. 21, no. 2, pp. 449-455, 2007.
[18] G. Vicente, A. Coteron, M. Martinez, and J. Aracil, “Application of the factorial design of experiments and response surface methodology to optimize biodiesel production,” Ind. Crops Prod., vol. 8, pp. 29–35, 1998.
[19] G. F. Silva, M. S. Castro, J. S. Silva, J. S. Mendes, and A. L. O. Ferreira, “Simulation and optimization of biodiesel production by soybean oil transesterification in non-ideal continuous stirred-tank reactor,” Int. J.
Chem. Reactor Eng.,vol. 8, pp. 1–20, 2010.
[20] Y. Tanaka, A. Okabe, and S. Ando, “Method for the preparation of a lower alkyl ester of fatty acids,” USPatent, vol. 4, pp. 303–590, 1981. [21] F. Ma, L. Clements, and M. Hanna, “The effects of catalysts, free fatty acids and water on transesterification of beef tallow,” Transactions of ASAE, vol. 41, no. 5, pp. 1261–1264, 1998.
[22] U. Schuchardt, R. Sercheli, and V. R. Matheus, “Transesterification of vegetable oils: a review,” J. Braz. Chem. Soc., vol. 9, pp. 199–210, 1998.
[23] R. Fillieres, B. Benjelloun-Mlayeh, and M. Delmas, “Ethanolysis of rapeseed oil quantitation of ethyl-esters, mono-glycerides, di-glycerides, and triglycerides and glycerol by high-performance size-exclusion chromatography,” J. Am. Oil Chem. Soc., vol. 72, pp. 427–432, 1995.
[24] B. Freedman and E. H. Pryde, “Fatty esters from vegetable oils for use as diesel fuel,” in Proc. International Conference on Plant and
Vegetable Oils as Fuel, ASAE, Fargo, 1982, p. 117.
[25] A. V. Tomasevic and S. S. Marinkovic, “Methanolysis of used frying oils,” Fuel Process. Technol., vol. 81, pp. 1–6, 2003.
[26] S. M. P. Meneghetti, M. R. Meneghetti et al., “Biodiesel from castor oil: a comparison of ethanolysis versus methanolysis,” Energy Fuels, vol. 20, pp. 2262–2265, 2006.
[27] A. Geogre, Z. Ypatia, S. Stamoulis, and K. Stamatis, “Transesterfication reaction of vegetable oils with ethanol and characterization of the key fuel properties of ethyl esters,” Energies,
vol. 2, pp. 362-376, 2009.
[28] E. L. Viele, F. O Chukwuma, and L. Uyigue, “Production and characterization of biodiesel from crude palm kernel oil and bioethanol using potash from ash of empty oil palm bunch residue as catalyst,”
International Journal of Application or Innovation in Engineering &
Management (IJAIEM), vol. 3, pp 355-363, 2014.
[29] D. Bajpai and V. K. Tyagi, “Biodiesel: Source, production, composition, properties and its benefits,” Journal of Oleo Science, vol. 55, pp. 487-502, 2006.
[30] E. Alptekin and M. Canakci, “Characterization of the key fuel properties of methyl ester-diesel fuel blends,” Fuel, vol. 88, no. 1, pp. 75-80, 2008.
[31] P. Felizardo, M. J. N. Correia, I. Raposo, F. J. Mendes, R. Berkemeier, and J. M. Bordaro, “Production of biodiesel from waste frying oils,”
Waste Manage, vol. 26, pp. 487-494, 2006.
[32] G. Vicente, M. Martiner, and J. A. Aracil, “Comparative study of vegetable oils for biodiesel production in Spain,” Energy Fuels, vol. 20, pp. 394-398, 2006.
[33] S. Blakey, C. W. Wilson, M. Farmery, and R. Midgley, “Fuel effects on range versus payload for modern jet aircraft,” Aeronau J., vol. 115, pp. 627-34, 2011.
Nhan Thi Thuc Truong was born on April 22, 1991 in Hue province, Vietnam. She obtained her Bachelor of Engineering degree in Post Harvest Technology from School of Food Technology, Hue Agriculture and Forestry University in 2009. Now she is studying in master’s degree of biotechnology.
During study, she received financial support from the Suranaree University of Technology and the funding provided by the Agicultural Research Agency (Thailand). She worked in the project title of “Development of Biojet fuel production using palm kernel oil and ethanol”, in Biofuel Production from Biomass Research Unit, Suranaree University of Technology, Thailand. She has joined in a course of Chemical Process Developement at Oldenburg University, Germany in the fund of Thai-German Cooperation, Researcher Mobility Scheme. During this time, she had practiced skills in the field of trans-esterification, fractional distillation, and adsorption technique, testing engine and she had an experience oral presentation in the title of “Bio-jet fuel production for the gas turbine engine” at the 5th Biotechnology International Colloquium 2016.
Apichat Boontawan was born on July 1, 1973 in Chaing Mai, Thailand. He graduated with the bachelor’s degree in food technology. He got the Royal Thai Government Scholarship and received his master’s degree in biochemical engineering from University of Birmingham, UK in 2000 and doctoral degree of chemical engineering from Imperial college London, UK in 2005.
He had an experience on ASEA-UNINET Post-doc research work for one year at Vienna University of Technology, Vienna, Austria (June 2007- May 2008). He works as the lecturer in School of Biotechnology, Institute of Agricultural Technology, Suranaree University of Technology (2005-Present), Thailand. His research is now focusing on bio-separation, fermentation and biochemical engineering.
Assoc. Prof. Dr. Boontawan have been published the paper entitled “Extractive fermentation of L-(+)- lactic acid by Pediococcus pentosaceus