DOI: 10.15575/join.v4i1.256
Received: November 27, 2018; Revised: March 12, 2019; Received: June 10, 2019; Published: August 31,2019
1
Assessment of Readiness and Usability of
Information Systems Use
Dwi Yuniarto
1, A’ang Subiyakto
2, Aedah Binti Abd. Rohman
3, Reny Rian Marliana
41,4
Informatics Engineering, STMIK Sumedang, Indonesia
2
Informatioan System Department, UIN Syarief Hidayatullah Jakarta, Indonesia
3Department of Information Communication Technology, Asia e University, Malaysia
1
[email protected],
2[email protected],
3[email protected],
4[email protected]
Abstract- The assessment of the use of information systems has been carried out by many researchers. This research was
conducted in Private Universities in Indonesia, which currently involve many information systems in many ways, especially
those related to the management of Higher Education, by measuring the readiness and usability of the use of information
systems with models that I build from the integration of two models. The results of the measurement of this study were obtained
from the distribution of questionnaires, there were 47% of respondents who filled 61-80% of the level of IS usage and 68% of
respondents stated their readiness in the level of readiness to use IS. The stage consists of evaluating reflective measurement
models and structural model assessments. Evaluating reflective measurement in evaluating internal consistency reliability
using Composite Reliability, Reliability Indicator, Convergent Validity, and Discriminant Validity, finally concluded that the
use of the Readiness and Usability integration model can be forwarded to a more complex research stage and can use the
questionnaire.
Keywords-
assessment, readiness, usability, use of information systems
I.
INTRODUCTION
As information systems have become widely utilized,
the assessment of the information system has likewise
become an important research topic [1]. The Information
system has been narrowly defined in terms of databases [2].
This definition focuses on data requirements and the
mechanism to store, organize, process, and analyze data
[3-15]. An alternative definition takes on a broad perspective
to encompass all components of the system, such as data,
software and hardware, people, methods, and procedures
[16]. The use of information systems in universities has
become a necessity [17, 18], some research on information
systems in universities has increased along with the
increasing need for information systems in universities
[19-22].
The internationalization of economies, globalization,
the rapid advance of the new technology, changes in
production structures, business reorganization and so forth
all place increasing pressure on the national statistical
systems [23]. Research in science and engineering often
involves using controllable and/or easy-to-measure
variables (factors) to explain, regulate, or predict the
behavior of other variables (responses) [24]. According to
past literature study, some researchers used PLS [12,
25-33] method for the analysis. Structural Equation Modeling
[34] is one of the current methods used to cover the existing
weaknesses of the regression method. The method experts
SEM research grouping into two approaches [35]. The first
approach is called as Covariance Based SEM (CBSEM)
and the other approach is Variance Based SEM or better
known as Partial Least Squares (PLS) [36].
In this study, statistical analysis was used to test the
questionnaire on the use of information systems derived
from the indicators of each variable made from the results
of integrating the model of readiness and usabiility. The
aim is to statistically assess the results of questionnaire
analysis. The findings of this study can later provide input
for researchers in terms of testing questionnaires and
revising questionnaires, especially in the use of
information systems. The research questions used in this
study are:
Q1: What is the effect of readiness and usability on the
use of information systems?
Q2: Are the results of the assessment of the use of
information systems in terms of readiness and
usability changing the indicators and variables that
exist?
This research was carried out sequentially through
four stages of research. At the first stage, the researcher
explained the background of the results of the study. The
explanation of the research method is in the second stage
which explains the stages in the research procedure that is
carried out and an explanation of the model used in the
measurement of the use of information systems. The third
stage of this study presents the results and discussions that
are the answers to the problems as stated in the first stage.
Finally, from this stage of the research, a conclusion can be
drawn which can illustrate the desired results of this study.
II.
METHOD
Assessment of Readiness and Usability of Information Systems Use
(Dwi Yuniarto, A’ang Subiyakto, Aedah Binti Abd. Rohman, Reny Rian Marliana)
2
from this study is the model that has been produced by
integrating the readiness and usability model (Figure 2)
which has produced the questionnaire that will be
evaluated.
Figure 1. The research procedure [12]
This study developed an information system use
model (Figure 2) by adopting Technology Readiness [37]
and Usability [38]. The ten variables of the developed
model are OPT (Optimism), INV (Innovation), DCF
(Discomfort), ISC (Insecurity), LRN (Learnability), EFC
(Efficiency), MMR (Memorability), RLB (Reliability),
STF (Satisfaction), and SYU (System Usability), From the
model that has been built, a questionnaire is generated
which is a derivative of the indicators of the variables
contained in the model (Figure 2) [2] (Table I and II).
Figure 2 .The Developed Use Information System [2]
The researcher distributed 60 copies of questionnaires,
which were distributed based on the experience of the
respondent's profile. The distribution of questionnaires is
done through the Google Form. The researchers processed
the collected data using SmartPLS 2.0. Regarding the
amount of data, the PLSSEM method is then used in the
analysis phase by using SmartPLS 2.0 to perform
reliability indicators, internal consistency reliability,
convergent validity, and discriminant validity assessment.
Table 1. List of the questions
Code Questionnaire
OPT1 The System is free from constraints, difficulties, and troubles [3]
OPT2 The System can be connected easily with other systems [3] OPT3 The System operates within the minimal resources [3] OPT4 The System operates within the maximal output [3] OPT5 The System is able to operate efficiently and effectively [3]
Code Questionnaire
INV1 A System is a problem-solving tool for users [3]
INV2 The System helps users to be free from the controls/influences [3]
INV3 The System supports users for achieving goals in a difficult situation or problem [3]
INV4 The System encourages users to achieve goals [3] INV5 The System supports users to be more successful than their
competitors [3]
DCF1 The System confuses users in its operation [3] DCF2 The System cannot be operated easily [3] DCF3 The System cannot be operated freely [3]
DCF4 The System is operated without a full support operation [3] DCF5 The System is inappropriate to its development planning [3]
ISC1 The System is unsuccessful be operated appropriated to its development planning [3]
ISC2 The System is in a situation that could cause harm or danger [3]
ISC3 The System makes users become less in interactions [3] ISC4 The System makes users be unfocused with their importance
[3]
ISC5 The system is dubious to use [3] LRN1 The system is easy to use [2] LRN2 The system is very simple [2]
EFC1 The system gets the job done effectively [2] EFC2 The System quickly completes the job [2] EFC3 The system gets the job done efficiently [2] MMR1 The information in this SI is easy to understand [2] MMR2 Their commands are aligned to specific functions [2] MMR3 There hierarchical of the interface is simple to understand [2]
RLB1 The system is always available to operate when needed [2] RLB2 The System is protected from physical access from
non-authoritative rights [2]
RLB3 The system is easy to maintenance [2]
RLB4 The system processing is complete, accurate, and timely [2] STF1 In this SI, the information provided is very clear [2] STF2 In this SI there is ease in finding the information needed [2] STF3 Their navigation in the interface is satisfactory [2] STF4 The input method is appropriate [2]
SYU1 The organization of information on the screens was clear [2] SYU2 The interface of this system was pleasant [2]
SYU3 I liked using the interface of this system [2]
SYU4 This system has all the functions and I expect it to have [2] SYU5 Overall, I am satisfied with this system [2]
Table 2. List of the variables and indicators
Variables Indicators References
Optimism Easiness, connectivity, efficiency, effectiveness, productivity.
[37, 39-43]
Innovation Problem solving, independence, challenge, stimulation, competitiveness
[15, 37, 43-45] Discomfort Complexity, difficulty, dependence,
lack of support, inappropriateness
[37, 39-43]
Insecurity Failure, threat, reducing interaction,
distraction, incredulity [37, 39-42, 46]
Learnability Ease of use, simplicity [38]
Efficiency Effectively, quickly, efficiency [38]
READINESS INPUT
OPT
ISC DCF INV
USABILITY
PROCESS OUTPUT
LRN
EFC
MMR
RLB
STF
Received: November 27, 2018; Revised: March 12, 2019; Received: June 10, 2019; Published: August 31,2019
3
Variables Indicators References
Memorability Understanding, functionality, convenience
[38]
Reliability Availability, protectivity, maintenance, accuracy
[37, 38, 47-49] Satisfaction Clearly, easily, satisfaction,
appropriately
[38]
System
Usability Obviously, pleasantly, likely, expectation, excitement [38]
III.
RESULTS AND DISCUSSION
A.
Demographics Information
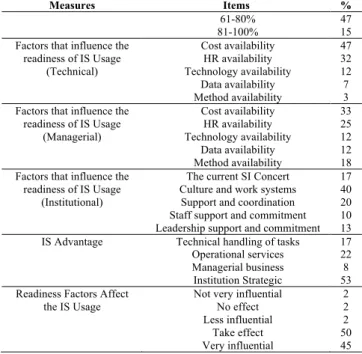
Table III presents the characteristics of the respondents,
i.e., education, position, experience and skill level in using
IS. From the results of data collection, it can be seen in
Table 4 regarding the characteristics of respondents in
terms of readiness and usability in the use of information
systems. The above results can provide a recommendation
for researchers in terms of data consistency between data
collected by the expectations of the researchers. There
were 47% of respondents who filled 61-80% of the level of
IS usage and 68% of respondents stated their readiness in
the level of readiness to use IS.
Table 3. Respondents profiles
Measures Items %
Education High School 3
Diploma 0
Bachelor 12
Master 75
Doctor 10
Position Top Manager 22
Business Unit Manager 20
Project Manager 47
Project Team Member 12
Experience < 2 years 18
2-5 years 35
5-10 years 18
> 10 years 28
Skill Very unskilled 0
Unskilled 0
Less skilled 23
Skilled 58
Very skilled 18
Table 4. Readiness and usability profiles
Measures Items %
Strategic Plan Exist
No Unknown
82 5 13 Level of Readiness to use
IS Very unprepared Not ready Less ready Ready Very ready 0 0 15 68 17
Level of IS Usage <20%
21-40% 41-60%
5 7 27
Measures Items %
61-80% 81-100%
47 15 Factors that influence the
readiness of IS Usage (Technical) Cost availability HR availability Technology availability Data availability Method availability 47 32 12 7 3 Factors that influence the
readiness of IS Usage (Managerial) Cost availability HR availability Technology availability Data availability Method availability 33 25 12 12 18 Factors that influence the
readiness of IS Usage (Institutional)
The current SI Concert Culture and work systems Support and coordination Staff support and commitment Leadership support and commitment
17 40 20 10 13
IS Advantage Technical handling of tasks
Operational services Managerial business Institution Strategic 17 22 8 53 Readiness Factors Affect
the IS Usage
Not very influential No effect Less influential Take effect Very influential 2 2 2 50 45
From the results of data collection, it can be seen in
Table 4 regarding the characteristics of respondents in
terms of readiness and usability in the use of information
systems. The above results can provide a recommendation
for researchers in terms of data consistency between data
collected by the expectations of the researchers. There
were 47% of respondents who filled 61-80% of the level of
IS usage and 68% of respondents stated their readiness in
the level of readiness to use IS.
B.
The Statistical Analysis Result
At the statistical analysis result stage, there are several
stages to process the questionnaire. The stage consists of
evaluating reflective measurement models and structural
model assessment. Evaluating reflective measurement are
evaluating internal consistency reliability using Composite
Reliability (Table IV and Tabel VI), Indicator Reliability
(Tabel V), Convergent Validity (Table VII), Discriminant
Validity (Tabel VIII).
The Structural Model Assessment is a step to
determining whether or not the hypothesis is based on the
research model (Table IX), assessing R
2values of the
Assessment of Readiness and Usability of Information Systems Use
(Dwi Yuniarto, A’ang Subiyakto, Aedah Binti Abd. Rohman, Reny Rian Marliana)
4
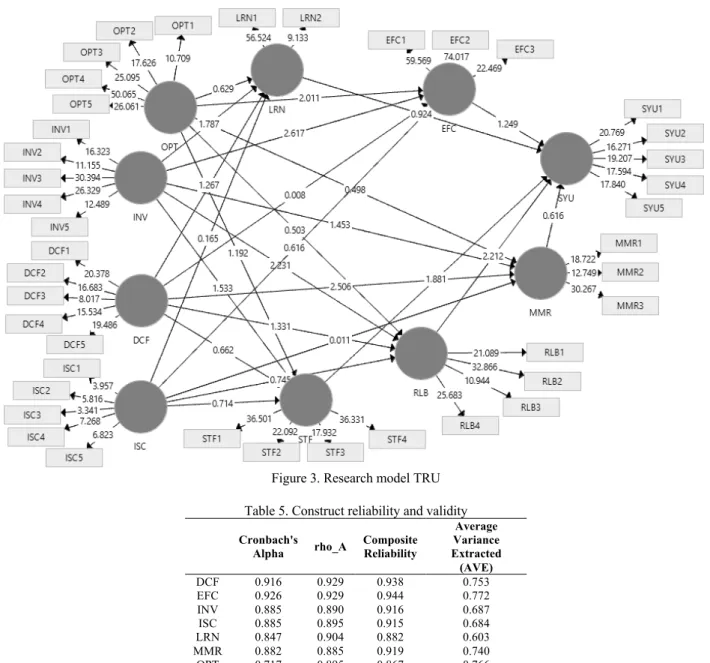
Figure 3. Research model TRU
Table 5. Construct reliability and validity
Cronbach's Alpha rho_A
Composite Reliability
Average Variance Extracted (AVE)
DCF 0.916 0.929 0.938 0.753
EFC 0.926 0.929 0.944 0.772
INV 0.885 0.890 0.916 0.687
ISC 0.885 0.895 0.915 0.684
LRN 0.847 0.904 0.882 0.603
MMR 0.882 0.885 0.919 0.740
OPT 0.717 0.895 0.867 0.766
RLB 0.949 0.964 0.967 0.908
STF 0.842 0.849 0.905 0.761
SYU 0.929 0.929 0.947 0.817
As we can see from the table above, the composite
reliability for all the reflective constructs are higher than
0,708 and have high levels of internal consistency
reliability.
Table 6. Outer loadings
DCF EFC INV ISC LRN MMR OPT RLB STF SYU DCF1 0.857
DCF2 0.790 DCF3 0.774 DCF4 0.841 DCF5 0.870
EFC1 0.958
EFC2 0.970
EFC3 0.930
INV1 0.805
INV2 0.758
INV3 0.908
INV4 0.865
INV5 0.800
ISC1 0.684
ISC2 0.789
Received: November 27, 2018; Revised: March 12, 2019; Received: June 10, 2019; Published: August 31,2019
5
DCF EFC INV ISC LRN MMR OPT RLB STF SYUISC4 0.874
ISC5 0.865
LRN1 0.944
LRN2 0.801
MMR1 0.853
MMR2 0.845
MMR3 0.917
OPT1 0.733
OPT2 0.840
OPT3 0.906
OPT4 0.940
OPT5 0.904
RLB1 0.878
RLB2 0.899
RLB3 0.806
RLB4 0.854
STF1 0.928
STF2 0.888
STF3 0.874
STF4 0.925
SYU1 0.895
SYU2 0.885
SYU3 0.906
SYU4 0.853
SYU5 0.854
From the Table 6, we can see that the outer loadings
of indicator ISC1 and ISC3 are below to 0.7, these two
indicators need to be analyzed of the impact of indicator
deletion on AVE and composite reliability (see Table 5). If
the deletion increasing those measurements then the
reflective indicators need to be removed from the model,
but if the deletion does not increase those measurements
the reflective indicators need to be retained.
Table 7. Composite reliability from all models
Composite Reliability
Full Model
Model 2 (Deletion of Indicators ISC1 and
ISC3)
DCF 0.938 0.915
EFC 0.944 0.967
INV 0.916 0.916
ISC 0.915 0.894
LRN 0.882 0.867
MMR 0.919 0.905
OPT 0.867 0.938
RLB 0.967 0.919
STF 0.905 0.947
SYU 0.947 0.944
From table 7, we get that deletion of indicators ISC1
and ISC3 has increased the composite reliability.
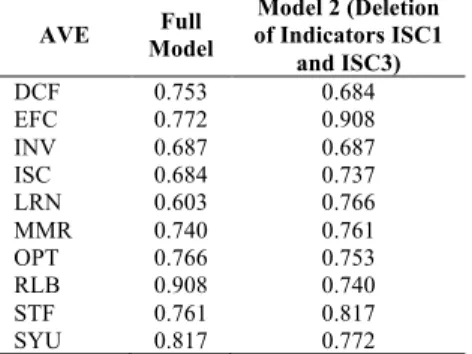
The AVE for all models are higher than 0,5, so the
convergent validity confirmed. From table 8 we also get
that all the indicator's outer loadings on a construct are
higher than its cross-loadings with other constructs, then
the discriminant validity confirmed [39].
Table 8. Convergent validity from all models
AVE Model Full of Indicators ISC1 Model 2 (Deletion and ISC3)
DCF 0.753 0.684
EFC 0.772 0.908
INV 0.687 0.687
ISC 0.684 0.737
LRN 0.603 0.766
MMR 0.740 0.761
OPT 0.766 0.753
RLB 0.908 0.740
STF 0.761 0.817
SYU 0.817 0.772
The determination of whether or not the hypothesis is
based on the research model we can see at Tabel 9. To
assess the significance of path coefficients we use
significant level 5% and one-tailed test. The significance
level is 1,64.
R
2values of endogen constructs System Usability and
Memorability are respectively substantial, meanwhile the
endogen constructs Efficiency, Learnability are
respectively weak and endogen construct Reliability,
Satisfaction is respectively moderate (Tabel 10).
Meanwhile, from Tabel 11, we can see all the exogenous
construct’s contribution to its endogenous latent variable
[39].
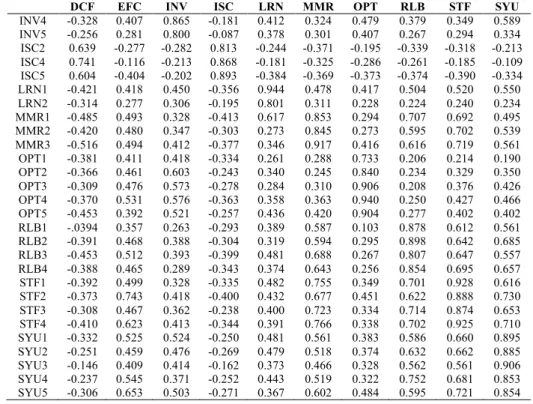
Table 9. Cross loadings of model 2
DCF EFC INV ISC LRN MMR OPT RLB STF SYU
DCF1 0.857 -0.341 -0.379 0.671 -0.353 -0.471 -0.398 -0.412 -0.420 -0.339 DCF2 0.790 -0.206 -0.367 0.594 -0.495 -0.483 -0.317 -0.441 -0.450 -0.337 DCF3 0.774 -0.329 -0.349 0.598 -0.305 -0.305 -0.288 -0.224 -0.191 -0.065 DCF4 0.841 -0.348 -0.354 0.600 -0.315 -0.493 -0.421 -0.432 -0.269 -0.226 DCF5 0.870 -0.243 -0.272 0.658 -0.271 -0.456 -0.349 -0.393 -0.310 -0.170
EFC1 -0.314 0.958 0.561 -0.335 0.448 0.527 0.493 0.534 0.642 0.664
EFC2 -0.292 0.970 0.511 -0.268 0.379 0.547 0.490 0.523 0.650 0.590
EFC3 -0.410 0.930 0.467 -0.373 0.339 0.528 0.517 0.437 0.570 0.421
INV1 -0.474 0.532 0.805 -0.336 0.289 0.453 0.490 0.423 0.385 0.451
INV2 -0.283 0.507 0.758 -0.277 0.361 0.336 0.651 0.234 0.372 0.376
Assessment of Readiness and Usability of Information Systems Use
(Dwi Yuniarto, A’ang Subiyakto, Aedah Binti Abd. Rohman, Reny Rian Marliana)
6
DCF EFC INV ISC LRN MMR OPT RLB STF SYU
INV4 -0.328 0.407 0.865 -0.181 0.412 0.324 0.479 0.379 0.349 0.589
INV5 -0.256 0.281 0.800 -0.087 0.378 0.301 0.407 0.267 0.294 0.334
ISC2 0.639 -0.277 -0.282 0.813 -0.244 -0.371 -0.195 -0.339 -0.318 -0.213 ISC4 0.741 -0.116 -0.213 0.868 -0.181 -0.325 -0.286 -0.261 -0.185 -0.109 ISC5 0.604 -0.404 -0.202 0.893 -0.384 -0.369 -0.373 -0.374 -0.390 -0.334
LRN1 -0.421 0.418 0.450 -0.356 0.944 0.478 0.417 0.504 0.520 0.550
LRN2 -0.314 0.277 0.306 -0.195 0.801 0.311 0.228 0.224 0.240 0.234
MMR1 -0.485 0.493 0.328 -0.413 0.617 0.853 0.294 0.707 0.692 0.495
MMR2 -0.420 0.480 0.347 -0.303 0.273 0.845 0.273 0.595 0.702 0.539
MMR3 -0.516 0.494 0.412 -0.377 0.346 0.917 0.416 0.616 0.719 0.561
OPT1 -0.381 0.411 0.418 -0.334 0.261 0.288 0.733 0.206 0.214 0.190
OPT2 -0.366 0.461 0.603 -0.243 0.340 0.245 0.840 0.234 0.329 0.350
OPT3 -0.309 0.476 0.573 -0.278 0.284 0.310 0.906 0.208 0.376 0.426
OPT4 -0.370 0.531 0.576 -0.363 0.358 0.363 0.940 0.250 0.427 0.466
OPT5 -0.453 0.392 0.521 -0.257 0.436 0.420 0.904 0.277 0.402 0.402
RLB1 -.0394 0.357 0.263 -0.293 0.389 0.587 0.103 0.878 0.612 0.561
RLB2 -0.391 0.468 0.388 -0.304 0.319 0.594 0.295 0.898 0.642 0.685
RLB3 -0.453 0.512 0.393 -0.399 0.481 0.688 0.267 0.807 0.647 0.557
RLB4 -0.388 0.465 0.289 -0.343 0.374 0.643 0.256 0.854 0.695 0.657
STF1 -0.392 0.499 0.328 -0.335 0.482 0.755 0.349 0.701 0.928 0.616
STF2 -0.373 0.743 0.418 -0.400 0.432 0.677 0.451 0.622 0.888 0.730
STF3 -0.308 0.467 0.362 -0.238 0.400 0.723 0.334 0.714 0.874 0.653
STF4 -0.410 0.623 0.413 -0.344 0.391 0.766 0.338 0.702 0.925 0.710
SYU1 -0.332 0.525 0.524 -0.250 0.481 0.561 0.383 0.586 0.660 0.895
SYU2 -0.251 0.459 0.476 -0.269 0.479 0.518 0.374 0.632 0.662 0.885
SYU3 -0.146 0.409 0.414 -0.162 0.373 0.466 0.328 0.562 0.561 0.906
SYU4 -0.237 0.545 0.371 -0.252 0.443 0.519 0.322 0.752 0.681 0.853
SYU5 -0.306 0.653 0.503 -0.271 0.367 0.602 0.484 0.595 0.721 0.854
Table 10. Assessment of the significance of path coefficients
Original Sample (O)
Sample Mean (M)
Standard Deviation (STDEV)
T Statistics
(|O/STDEV|) P Values Results
DCF -> EFC 0.063 0.059 0.224 0.281 0.779 Not Significant
DCF -> LRN -0.232 -0.230 0.188 1.237 0.216 Not Significant
DCF ->
MMR -0.407 -0.401 0.165 2.471 0.014 Significant
DCF -> RLB -0.305 -0.307 0.198 1.538 0.125 Not Significant
DCF -> STF -0.131 -0.141 0.187 0.702 0.483 Not Significant
DCF -> SYU -0.123 -0.120 0.168 0.730 0.466 Not Significant
EFC -> SYU 0.147 0.153 0.122 1.201 0.230 Not Significant
INV -> EFC 0.349 0.365 0.134 2.603 0.010 Significant
INV -> LRN 0.269 0.259 0.152 1.769 0.077 Significant
INV ->
MMR 0.194 0.200 0.129 1.497 0.135 Not Significant
INV -> RLB 0.275 0.270 0.136 2.021 0.044 Significant
INV -> STF 0.228 0.231 0.150 1.518 0.130 Not Significant
INV -> SYU 0.257 0.281 0.118 2.169 0.031 Significant
ISC -> EFC -0.230 -0.207 0.193 1.053 0.293 Not Significant
ISC -> LRN -0.051 -0.068 0.190 0.266 0.790 Not Significant
ISC -> MMR -0.034 -0.033 0.188 0.182 0.856 Not Significant
ISC -> RLB -0.108 -0.110 0.185 0.582 0.561 Not Significant
ISC -> STF -0.154 -0.162 0.193 0.796 0.426 Not Significant
ISC -> SYU -0.140 -0.147 0.144 0.971 0.332 Not Significant
LRN -> SYU 0.129 0.109 0.144 0.895 0.371 Not Significant
MMR ->
SYU -0.163 -0.094 0.263 0.618 0.537 Not Significant
OPT -> EFC 0.265 0.246 0.131 2.021 0.044 Significant
OPT -> LRN 0.107 0.115 0.179 0.595 0.552 Not Significant
OPT ->
MMR 0.071 0.087 0.153 0.461 0.645 Not Significant
OPT -> RLB -0.067 -0.059 0.135 0.497 0.619 Not Significant
OPT -> STF 0.160 0.153 0.142 1.124 0.262 Not Significant
OPT -> SYU 0.091 0.085 0.118 0.772 0.441 Not Significant
RLB -> SYU 0.354 0.370 0.154 2.295 0.022 Significant
Received: November 27, 2018; Revised: March 12, 2019; Received: June 10, 2019; Published: August 31,2019
7
Table 11. R Square
R Square R Square Adjusted
EFC 0.374 0.329
LRN 0.278 0.226
MMR 0.344 0.296
RLB 0.275 0.222
STF 0.273 0.220
SYU 0.652 0.620
Table 12. F- Square
DCF EFC INV ISC LRN MMR OPT RLB STF SYU
DCF 0.002 0.028 0.095 0.048 0.009
EFC 0.035
INV 0.113 0.058 0.033 0.060 0.041
ISC 0.028 0.002 0.001 0.007 0.014
LRN 0.035
MMR 0.024
OPT 0.064 0.009 0.004 0.004 0.020
RLB 0.137
STF 0.153
SYU
![Figure 1. The research procedure [12] This study developed an information system use](https://thumb-us.123doks.com/thumbv2/123dok_us/8085554.2142373/2.892.135.794.168.340/figure-research-procedure-study-developed-information-use.webp)