M
Moonnttaannoollooggyy,,CCaaddaassttrreeSSeerriieess)) VVooll.. XXLLIIXX//22001199
348
ASSESSEMENT OF THERMAL REGIME IN OLTENIA USING
TEMPERATURE-BASED CLIMATE INDICATORS RELEVANT FOR
AGRICULTURE SECTOR
Mietta Colan (1), Liliana Velea (2),(4)*, Cristina Burada (1), Emilia Constantinescu (3), Roxana Bojariu (2), Mihaela Udristioiu (4) and Adriana Bacescu (1)
(1) Regional Meteorological Center Oltenia, Str. Brestei 3A, Craiova, Romania
e-mail: [email protected]
(2) National Meteorological Administration, Sos. Bucuresti-Ploiesti, nr. 97
Bucuresti, Romania; *corresponding author: e-mail: [email protected]
(3) University of Craiova, Faculty of Agronomy, Craiova, Romania (4) University of Craiova, Faculty of Science, Physics Department
Abstract:
We present a quantitative evaluation of current climate (1981-2010) thermal conditions relevant for the agriculture sector by using seven agrometeorological climate indices computed based on the ROCADA dataset. The temperature-related indicators characterize the cold period of the year (i.e. sums of minimum air temperatures ≤‐10°C recorded in December‐February interval), the bounding seasons (e.g. zero crossing days), heating degree days) or are more specifically oriented for the growing season (i.e. Growing degree days; growing season mean temperature during April‐October/ May-September interval; Winkler index). The indices are computed for the entire Romanian territory, highlighting the thermal climatic features of the Oltenia region.
Keywords: heat stress, thermal discomfort, climate change, regional modeling, public health
1. INTRODUCTION
Oltenia is one of the 8 Development Regions of Romania - the South West “Oltenia” Region, with nearly 2.1 million inhabitants. The economy of the region is based both on the industry (largest contribution to local GDP) and on the agriculture (largest share of population working in this area) (PDR, 2014).
The region has mainly a rural character, with more than 52% of population living in rural area.
These aspects highlight the vulnerability of the region to the natural
hazards, especially for the population working in agriculture.
349
2. MATERIALS AND METHODS
In order to investigate the changes in climate conditions for agriculture sector during the reference period (1981-2010), we employ data from ROCADA (ROmanian ClimAtic Dataset; Dumitrescu and Birsan, 2015).
This high-resolution observation-based dataset, representative for the Romanian territory, provides a daily gridded climatology at the spatial resolution of 0.1x0.1 degrees for 9 meteorological parameters, based on long-term observational records from 150 Romanian meteorological stations.
The data is freely available on request on the PANGAEA data portal (doi.pangaea.de/10.1594/PANGAEA.833 627). For this study, we use data regarding to maximum, minimum and daily air temperature (Tmax, Tmin, Tave).
The analysis makes use of seven thermal indices relevant for the agriculture sector, namely:
- HD17 - the heating degree days index (Klein et al, 2009) is defined as the sum of temperatures below 17 °C along a year.
- GD4 - growing degree days (Klein et al, 2009) - represents the sum of temperatures exceeding 4 °C over one year.
-TAO - Growing-season temperature from April to October (Klein et al, 2009) -is defined as the average daily temperature in the interval 1 April - 31 October.
-TMS - growing-season temperature from May to September (Klein et al, 2009) – represents the average daily temperature during the interval 1May -30 September.
-WKI – the Winkler Index (Winkler et al, 1974) is defined as the sum of degrees
-STN10 (Sandu et al, 2010) represents the sum of minimum air temperatures below ‐10°C recorded during December‐February.
- ZCD - Zero Crossing Days (Klein et al, 2009) – is defined as the number of days with minimum air temperature below 0°C and the maximum air temperature above 0°C during one year.
These indices are also employed by INDECIS project (Integrated approach for the development across Europe of user oriented climate indicators for GFCS high-priority sectors: agriculture, disaster risk reduction, energy, health, water and tourism) (www.indecis.eu) where they are computed from ECA&D database over the entire Europe, at a spatial resolution of 25 km, and they are freely available on project website ( http://www.indecis.eu/indices.php).
The threshold temperature values for the indices HD17 and GD4 follows the approach used in INDECIS; however, various threshold values may be chosen depending on the investigated impact as for example a particular crop or for a specific application (e.g. electricity, energy budget) (Spinoni et al, 2015)
The analysis regards the spatial distribution of long-term mean values of indices over the entire Romanian territory.
The characteristics of Oltenia region are highlighted in this context. Furthermore, an analysis of the time-series of the indices over Dolj county is presented.
A
Aggrriiccuullttuurree,,MMoonnttaannoollooggyy,,CCaaddaassttrreeSSeerriieess)) VVooll.. XXLLIIXX//22001199
350
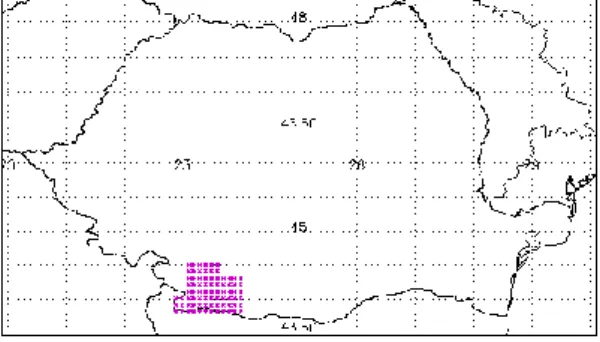
Figure 1. Selected grid points from ROCADA dataset covering the area of Dolj county.
3. RESEARCH RESULTS
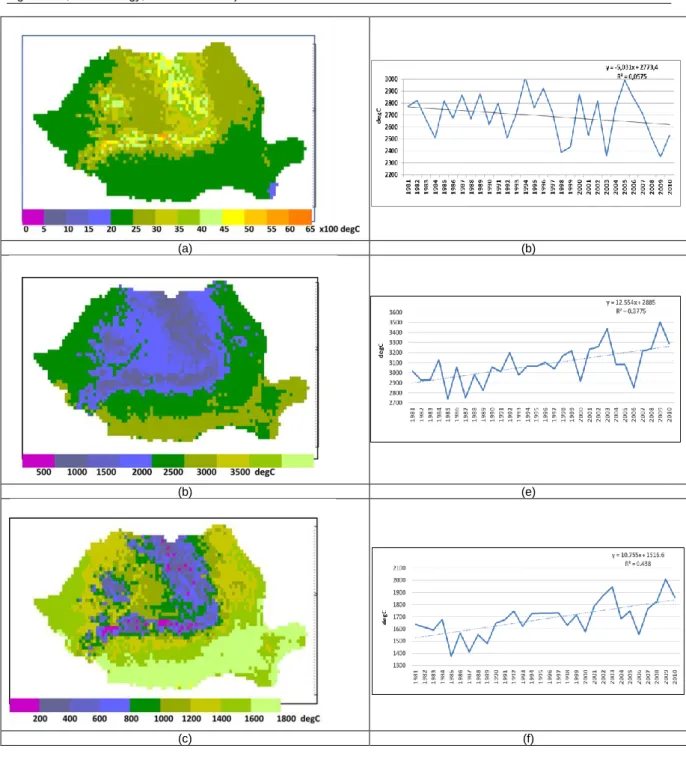
The spatial distribution of HD17 long-term mean values over the entire territory (Fig.2a) shows the lowest values in the western, southern and south-eastern regions, as expected based on the climatological distribution of temperature which indicates these regions as having the largest annual temperatures (Administratia Nationala de Meteorologie, 2008). The largest values of HD17 are around 4000-5000 °C, reaching almost 6000 °C on the highest mountain tops. Oltenia region, situated in the W-SW part of the country, is characterized by HD17 mean values of 2000-2500 °C. The temporal evolution of HD17 index over Dolj county shows extreme values ranging between 2350 and 3000 °C, with larger amplitude oscillations after the year 1994. Also, a decreasing trend of HD17 values is found over the period analyzed (1981-2010) (Fig 2b), in agreement with studies indicating increasing temperature during winter (e.g. Dumitrescu et al, 2014).
The GD4 index shows a spatial distribution over the entire territory (Fig.2c) characterized by largest values
in the southernmost areas (3000 °C), followed by values around 2500 °C in the hilly areas in Oltenia as well as in the western and eastern regions. The lowest values are found in the mountains and intra-mountainous areas (1000-1500 °C). Over Dolj county, a significant increasing trend of GD4 is found (Fig. 2d).
The spatial distribution of long-term mean Winkler index corresponds to the wine growing zones defined at European level (EU, 2013). It indicates the southern areas as favorable for high production of standard to good quality table wines and characterized by WKI index in the range 1600-1800 °C), followed by western and eastern regions where early and mid-season table wine varieties are favorized to produce good quality wines. The temporal evolution of WKI index over Dolj area shows a
quite pronounced increasing trend
351
(a) (b)
(b) (e)
(c) (f)
Figure 2. Left column: distribution of long-term mean values (1981-2010) of (a) HD17, (b) GD4 and (c) WKI index over the Romanian territory; right column: time series of (d) HD17, (e) GD4 and (f)
WKI index over Dolj county for the period 1981-2010, based on ROCADA dataset.
The growing season temperature indices TAO and TMS present similar patterns (Fig 3 a, b), characterized by larger values in the south, followed by western and eastern areas. In Oltenia region, TAO has long-term mean values in the range 14-16 °C. The distribution of TMS index presents maximum values of
A
Aggrriiccuullttuurree,,MMoonnttaannoollooggyy,,CCaaddaassttrreeSSeerriieess)) VVooll.. XXLLIIXX//22001199
352
(a) (c)
(b) (d)
Figure 3. Left column: distribution of long-term mean values (1981-2010) of (a) TAO and (b) TMS index over the Romanian territory; right column: time series of (c) TAO and (d) TMS index over Dolj
county for the period 1981-2010, based on ROCADA dataset.
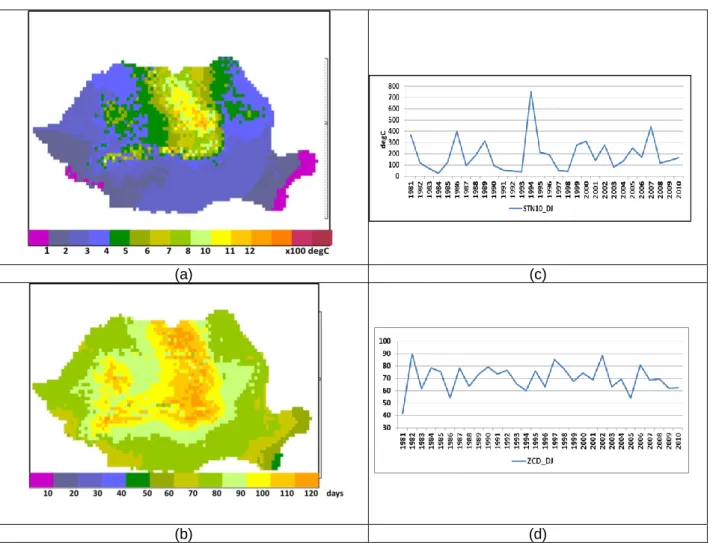
The STN10 index, representing a the sum of temperatures deviations below the threshold of -10 °C , indicates that the lowest values are found in the W-SW and eastern regions (less than 200 °C ), followed by the areas in the south, north-west and north-east areas (200-400 °C ) (Fig.4a) The largest values of STN10 are found, as expected, in the mountainous areas, reaching values of 1000-1200 °C. Oltenia region is characterized by STN10 values in the range 100-300 °C, lower values being found over Dolj county.
A similar spatial pattern is found for the ZCD index (Fig 4b), where the lowest values (up to 70 days) are found in the
353
(a) (c)
(b) (d)
Figure 4. Left column: distribution of long-term mean values (1981-2010) of (a) STN10 and (b) ZCD index over the Romanian territory; right column: time series of (c) STN10 and (d) ZCD index over
Dolj county for the period (1981-2010), based on ROCADA dataset.
5. CONCLUSIONS
We presented an assessment of thermal climate conditions for the period 1981-2010 quantified with the use of seven indices relevant for the agriculture sector, with a focus on Oltenia region.
The results show that the indices more focused on the growing season (e.g. GD4, TAO, TMS, WKI) generally show larger values in Oltenia and in particular in the SW areas. Also, for the area of Dolj county, these indices present increasing tendencies, more
pronounced toward the end of the period analyzed. On the opposite, the thermal indices characterizing the cold season (STN10, ZCD) presents the lowest long-term values in the SW of the country and no clear increasing/ decreasing tendency.
The study may be adapted for other threshold values and/or indices relevant in agriculture. Along with this, another possible further step would be the evaluation of these indices in the context of climate change scenarios in Oltenia
5. ACKNOWLEDGEMENTS
A
Aggrriiccuullttuurree,,MMoonnttaannoollooggyy,,CCaaddaassttrreeSSeerriieess)) VVooll.. XXLLIIXX//22001199
354
REFERENCES
PDR (2014): Planul de Dezvoltare
Regionala Sud-Vest Oltenia 2014-2020, available at
http://www.adroltenia.ro/wp- content/uploads/2014/07/PDR-SV-Oltenia-2014- 2020-1.pdf
Bojariu R, Bîrsan MV, Cică R, Velea L, Burcea S, Dumitrescu A, Dascălu SI, Gothard M, Dobrinescu A,Cărbunaru F, Marin L (2015):
Climate changes – from physical basis to risks and adaptation’ (in Romanian), Ed. Printech, București. 200 p., available at http://www.meteoromania.ro/anm/i mages/clima/Schimbariclimatice201 4.pdf
Bucur, G.M., Cojocaru, G.A, Antoce, A.O (2019): The climate change
influences and trends on the grapevine growing in Southern Romania: A long-term study, BIO Web Conf, Vol. 15,
https://doi.org/10.1051/bioconf/201 91501008
Administratia Nationala de
Meteorologie (2008): Climate of
Romania, Editura Academiei Române, București (in Romanian)
Dumitrescu A, and Birsan VM (2015)
ROCADA: a gridded daily climatic dataset over Romania (1961-2013) for nine meteorological variables. Natural Hazards, vol. 78 (2), pp 1045-1063.
Dumitrescu, A., Bojariu, R., Birsan, M.V., Marin, L., Manea, A. (2014):
Recent climatic changes in Romania from observational data (1961–2013), Theor Appl Climatol, DOI 10.1007/s00704-014-1290-0
EU(2013): Regulation (EU) no 1308/2013 of the European Parliament and of the Council, Appendix I available at https://ec.europa.eu/info/sites/info/files/
food-farming- fisheries/farming/documents/wine-growing-regions_en.pdf
Klein Tank AMG, Zwiers FW, Zhang X. (2009). Guidelines on analysis of
extremes in a changing climate in support of informed decisions for adaptation, climate data and monitoring WCDMP‐No 72, WMO‐TD No 1500, p 5.
Sandu I., Mateescu Elena, Vatamanu V. V (2010) Schimbari climatice in
Romania si efectele asupra agriculturii, Editura Sitech, Craiova
Santos, J.A, Malherio, A.C., Pinot, J.C, Jones, G. J (2012): Macroclimate
and viticultural zoning in Europe:observed trends and atmospheric forcing, Clim. Res, 51: 89–103, doi: 10.3354/cr01056
Spinoni, J., Vogt, J. and Barbosa, P (2015): European degree-day climatologies and trends for the period 1951–2011, Int. J. Climatol.35: 25–36, DOI: 10.1002/joc.3959