Abstract—Bamboo based activated carbon (AC) was
modified by attaching silver (AC-Ag) and copper (AC-Cu) nano-particles to reduce the low-concentration of formaldehyde in air. Batch isotherm tests were performed to determine the adsorption capacity of each activated carbon. At equilibrium concentration of 8 ppm, AC-Cu adsorbed 29% higher amount of formaldehyde as compared to the original AC. The highest loading amount was obtained for AC-Ag, being around 0.425 mg/g AC-Ag. The concentration of formaldehyde removed by the AC-Ag was 1.6 times higher than the virgin AC at the same equilibrium concentration.
Index Terms—Formaldehyde, activated carbon, bamboo,
silver nano-particles.
I. INTRODUCTION
Gaseous formaldehyde is one of the major indoor gaseous pollutants. This volatile organic compound is emitted from the paint, decoration materials, binder of furniture, principal ingredients of cigarette smoke, disinfectants, and preservatives. Formaldehyde at low concentration can cause irritation of eyes and noses at about 1 ppm, difficult breathing at about 10 ppm, injury of respiratory organs at about 40 ppm, and asphyxia above 80 ppm. Even, formaldehyde can also result in nasopharyngeal cancer (based on small number) and eventually death [1], [2]. Therefore, technology development, especially in the area of formaldehyde removal becomes an important task for a better human living.
Activated carbon adsorption is thought as one of the most common methods for the removal of formaldehyde in air. Studies on adsorptions of formaldehyde gas on activated carbon have been conducted by several researchers. Activated carbon used were varied in their studies including rayon-based activated carbon fibers [3], [4], activated carbons from coffee residue [5], activated carbons modified with organosilane solution [6] and hexamethylene diamine [7], activated carbon derived from sewage sludge [8], and activated carbon produced from electrospun polyacrylonitrile nanofiber [9].
An interesting fact was that Shin and Song [10] used silver
Manuscript received July 13, 2013; revised September 11, 2013. This work was supported by The Directorate General of Higher Education of the Republic of Indonesia under Research Grant of Universitas Indonesia for Hibah Madya.
The authors are with the Department of Chemical Engineering, Faculty of Engineering, Universitas Indonesia, Kampus Universitas Indonesia, Depok 16424, on leave from Universitas Negeri Semarang for Chemical Engineering Department, Kampus Sekaran Gunungpati Semarang 50229, Indonesia (e-mail:[email protected], [email protected], [email protected]).
nano-particles dispersed on granular coal-based activated carbon to effectively remove formaldehyde from air. It was believed that silver nano-particles could improve the adsorption of formaldehyde on activated carbon through two reasons, i.e. oxidation potential and larger specific surface area. Silver also possesses high applicability for use of controlling indoor air due to its non-toxic feature.
Despite its several advantages, silver is still considered as a precious metal. Alternatively, cheaper metal such as copper can also be used to adsorb formaldehyde in air. Copper is not only cheaper than silver, but also possesses higher oxidation potential. In addition, copper impregnated activated carbons have been used to adsorb CO [11] and H2S [12] in previous
studies. As a result, we decided to perform studies on the adsorption capacity of gaseous formaldehyde on both silver and copper nano-particles impregnated on activated carbon.
The differences of Shin and Song work [10] with our experimental work were that we used low concentration of gaseous formaldehyde, which is more applicable for controlling indoor air pollution, and we used bamboo based activated carbon (AC). Since we used different activated carbon, combined, their data and ours could be used to confirm the mutual viability of the two experimental results.
Selection of bamboo as raw material for our activated carbon was based on the consideration that waste bamboo is abundantly available from the furniture factories especially in Asian countries and its carbon content is reasonably high. High carbon content is a preferable property of the starting carbonaceous material to be used for the production of activated carbon. The carbon content of our bamboo (Dendrocalamus asper) is about 44%.
In this study, silver nano-particles or copper nano-particles were attached onto the surface of AC, (AC-Ag) or (AC-Cu). The AC-Ag or AC-Cu was evaluated for the removal of formaldehyde, the target indoor air pollutant at room temperature. We used the Langmuir‟s model to demonstrate its ability to correlate the experimental data. Furthermore, the parameters obtained in the Langmuir‟s model were also evaluated.
II. PROCEDURE A. Sample Preparation
Dried waste bamboo was cut into a size of about 1 cm x 1 cm. The bamboo was carbonized under air atmosphere at approximately 400 oC for 2 hours, crushed and sieved into a granular size less than 200 mesh. Chemical activation was conducted by immersing the bamboo char in a potassium hydroxide (KOH) solution (25% by volume). The weight
Adsorption of Low-Concentration Formaldehyde from Air
by Silver and Copper Nano-Particles Attached on
Bamboo-Based Activated Carbon
W. D. P. Rengga, M. Sudibandriyo, and M. Nasikin
ratio of carbonized bamboo to KOH was 1:3. The mixture was dehydrated at 200 oC until it formed slurry and subsequently activated in a tube-type electronic heating furnace in the presence of nitrogen gas with flow rate of 200 mL/min. The heating rate was 10 ºC/min and continued until the final temperature of 800 ºC was reached. The activation was maintained at 800 oC for 1 h. After activation, the product was washed with 5 N HCl followed by rinsing with distilled water several times until the pH of the washing effluent was 6-7. The produced activated carbon was then dried at 105 oC for 12 h and grinded into 200 mesh prior to characterization and adsorption study.
B. Synthesis of AC-Ag
The silver nano-particles were synthesized in reduction process similar to Gaedhi‟s method [13]. In this case, 4 mL of 0.1 M AgNO3 was added into 1 L of an aqueous solution 0.15
wt% of the soluble starch and vigorously stirred for 1 h under inert atmosphere. The pH of resulting solution was adjusted to 8.0 by adding a 0.1 M NaOH solution. The mixture was maintained at 50 oC for 24 h and the color of the reaction solution became yellow.
In the next step, silver nano-particles solution was mixed with 107.9 g of activated carbon in a 1 L flask under magnetic stirring for up to 24 h, resulting in the deposition of about 4 wt% of silver nano-particles on AC. The AC-Ag was filtered and extensively washed with distilled water. The AC-Ag was generally dried at 105 oC for 12 h.
C. Synthesis of AC-Cu
The synthesized activated carbon was impregnated with an aqueous solution of Cu(NO3)2. The amount of copper was
arranged at 4 wt% with respect to the activated carbon. The mixture was dried at 105 oC for 24 h and reduced in a tube-type electronic heating furnace in hydrogen flowrate of 100 L/min. The heating rate was 10 oC/min and continued until the final temperature of reached 500 oC and subsequently cooled to room temperature. Through this process, copper nano-particles would be attached on the
activated carbon (AC-Cu). The AC-Cu was washed with distilled water and dried at 105 oC under atmosphere for
12 h.
D. Characteristics
Brunauer, Emmett and Teller (BET) surface area was determined using a specific surface analyzer (Quantachrome NOVA 1200e). The shape and surface morphology of the nano-particles were investigated by Scanning electron microscopy (SEM) images were obtained using a JEOL KSM-6390A with an accelerating voltage of 20 keV. Scanning was performed in situ on a powder sample. SEM
with energy-dispersive X-ray (EDX) analysis was done at 5 K magnifications. Transmission electron
microscopy (TEM) images were obtained using a JEOL JEM-1400.
E. Formaldehyde Gas Preparation
Fig. 1 shows schematic diagram of the equipment to produce gaseous formaldehyde in air. Research grade air flowed through a flow-meter at the flow rate of 200 L/min and passed through formaldehyde solution in a formaldehyde vapor generator to generate gaseous formaldehyde in air.
Another stream of air flowed through the second flow-meter to adjust the concentration of formaldehyde desired in the mixing chamber. Both streams of air containing formaldehyde and pure air met in the packed-bed water adsorber filled with KOH to adsorb all water in the streams. The formaldehyde concentrations were measured using gas chromatography equipped with a flame ionization detector (GC/FID, Shimadzu GC-2014).
Fig. 1. Schematic diagram of the experimental setup of vapor phase formaldehyde adsorption.
F. Adsorption Isotherm
Isotherm tests were conducted similar to the work by Shin and Song [10]. The isotherm tests were conducted by adding about 0.2 g activated carbon and formaldehyde at various gas-phase concentrations into a 10 mL glass bottle equipped with silicon sealed. The bottles were maintained at 25 oC, sealed and placed in a shaker until equilibrium was reached, and then headspace gas samples were taken and analyzed for formaldehyde. The gas samples were collected using a 0.5 mL gas-tight syringe, and analyzed immediately using gas chromatography equipped with a flame ionization detector (GC/FID, Shimadzu GC-2014).
The Langmuir‟s isotherm model was used to represent the adsorption data. The model can be written as the following (1).
𝑞
𝑒=
𝑞1+𝐾𝑚𝐾𝐿𝐶𝑒𝐿𝐶𝑒 (1)
where Ce is the equilibrium concentration of formaldehyde in
the gas sample (ppm), qe is the amount of formaldehydes
adsorbed (mg/g), qm is a Langmuir‟s parameter, the
maximum adsorption capacity of formaldehyde (mg/g), and KL is the Langmuir‟s adsorption equilibrium constant related
to the affinity of the binding sites (1/ppm).
The Freundlich‟s isotherm model was used to represent the adsorption data as the following (2).
𝑞
𝑒= 𝐾
𝐹𝐶𝑒
1
𝑛 (2)
where KF and 1
𝑛 are the Freundlich isotherm parameters
(mg/(g(ppm)1/n)) and dimensionless.
III. RESULT AND DISCUSSION A. SEM-EDX and TEM Analysis
SEM-EDX elemental analysis of AC-Ag revealed the presence of C, O, Si, K, and Ag in Fig. 2a whereas AC-Cu in Fig. 2b revealed the presence of C, O, Si, K, and Cu on the surface of this material. Ag particles seem more uniformly distributed on the surface of the carbon than Cu. Based on the map of AC-Ag or AC-Cu, oxygen is rather present on the surface in the form of functional groups than in the form of metal oxides. Silicon is originates metal from the innate of bamboo. The source of K is in KOH, used in the process of chemical activation of the carbon [14]. Table I shows the contents of elements in AC-Ag and AC-Cu from EDX analysis. As seen, the contents of Ag in AC-Ag and Cu in AC-Cu are quite close to the amount of metal added to the carbon during the preparation procedure (4 wt%).
(a)
(b)
Fig. 2. SEM-EDX images of the elements detected on the surface of (a) AC-Ag and (b) AC-Cu.
TABLEI:CONTENTS OF ELEMENTS FROM EDXANALYSIS
Sample C O Si K Ag Cu
AC-Ag 75 19 1 1 3.9 N/A
AC-Cu 78 16 1 1 N/A 3.9
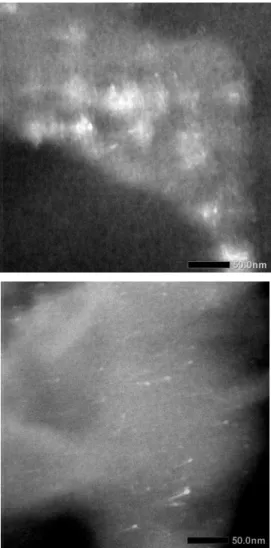
Fig. 3 shows the dark field image of TEM photographs of the metal particles dispersed on the activated carbon which were prepared with the same amount of metal intakes. As
show in the Figs, (Fig. 3a) has larger size than Cu clusters. Rough estimations of the sizes of the nano-particles are about 5-40 nm for Ag clusters and 2-10 nm for Cu clusters.
Fig. 3. TEM images of (a) AC-Ag and (b) AC-Cu.
B. Surface Area of Activated Carbon
To investigate the changes in surface properties due to activation process, metal loading, and nano-particles deposition, the specific surface area was determined using the BET method for activated carbon, AC-Ag and AC-Cu. The BET surface areas for AC, AC-Ag, and AC-Cu were found of 753 m2/g, 685 m2/g, and 533 m2/g. These findings imply that the metal deposition of nano-particle reduced the available surface area of the activated carbon and blocked the opening of pores. Generally, the metal deposition onto activated carbon can cause a decline in the surface area [10], [14]-[16], because the deposits physically block both the outer surface and the opening of pore structures. The surface area of AC-Cu is lower than that of AC-Ag. The smaller size of Cu clusters (Fig. 2) might block more effectively the pore structures of the carbons.
C. Adsorption Isotherm Experimental Result
amount of formaldehyde adsorbed by activated carbon. As seen in the Table, at equilibrium concentration of 8 ppm, the highest adsorption capacity was obtained about 0.425 mg/g carbon on AC-Ag. At the same equilibrium concentration, AC-Cu adsorbed 0.341 mg/g AC-Cu, whereas the original AC adsorbed only 0.264 mg/g AC. The amount of formaldehyde removed in AC-Ag was 1.6 times higher than in the virgin AC at the same equilibrium concentration. Compared to the results obtained by Shin and Song [10], the adsorption capacities obtained in our experiment are lower. This is because Shin and Song performed the adsorption at much higher concentration (900 ppm in Shin and Song, compared to about 20 ppm in our experiment).
TABLEII:AMOUNT OF FORMALDEHYDE ADSORBED ON ACTIVATED
CARBONS AT VARIOUS BULK EQUILIBRIUM CONCENTRATIONS
Activated Carbon
Injected (ppm)
Bulk Concentration after Equilibrium (ppm)
Adsorbed (mg/g)
AC-Ag 58.3 2.4 0.083
116.7 3.5 0.167
174.9 5.0 0.257
233.3 6.0 0.342
291.6 8.0 0.425
349.9 11.9 0.509
AC-Cu 80.1 2.6 0.084
160.1 4.2 0.171
240.2 5.6 0.254
320.3 7.4 0.336
400.3 8.0 0.341
480.5 12.9 0.509
AC 82.7 3.0 0.086
165.4 5.0 0.170
248.1 7.4 0.257
330.8 8.0 0.264
413.5 12.9 0.428
496.3 17.9 0.506
The adsorption capacity is affected by potential energy involved in the system. Based on the interaction of a single molecule with a single lattice plane, the fluid-solid potential energy (εis) has a minimum at a depth given by [17] as in (3):
𝜀
𝑖𝑠=
65𝜋𝜌
𝑐𝜀
12∗𝜍
122 (3)where (ρc) = 0.382 atom/Å2 is the area density of carbon
atoms in graphite plane. The cross interaction parameter ε12
and σ12 are obtained from Lorentz-Berthelot mixing rules.
The adsorbate-carbon well depth potential (ε12) and
adsorbate-carbon collision diameter (σ12) are estimated as (4)
and (5). The parameters of energy and collision diameter for the adsorbate, carbon, and metal particles obtained from various references are listed in Table III.
The fluid-solid potential energy parameters for interacting systems can be calculated according to (3) and the results are listed in Table IV. As seen in the Table, the values of formaldehyde-Ag and formaldehyde-Cu potential energy parameters are much higher than that in formaldehyde-C system. Therefore, the formaldehyde is adsorbed more in AC-Ag and AC-Cu than in AC as obtained in the experimental results.
𝜀
12∗= 𝜀
11∗𝜀
22∗ (4)𝜍
122=
12
(𝜍
11+ 𝜍
22) (5)TABLEIII:ENERGY AND COLLISION DIAMETER PARAMETERS FOR
VARIOUS MOLECULES
Interacting Material ε*/kB (K) ε* (J/mol) σ (Å)
Formaldehyde 206.5[16] 1773.75 3.731[18] Carbon 28 [17] 240.51 3.4 [19]
Ag - 23036 [18] 2.68 [20]
Cu - 34032 [18] 1.94 [20]
TABLEIV:INTERACTION PARAMETERS FOR FORMALDEHYDE –SOLID
SYSTEM
Interacting System ε12 (J/mol) σ12 (Å) εis(atom.J/mol)
Formaldehyde- Ag 6392.2 3.2 94625.9
Formaldehyde- Cu 7769.4 2.8 89995.0 Formaldehyde- C
653.1 3.6 11962.5
TABLEV:AVERAGE DEVIATIONS AND LANGMUIR MODEL‟S PARAMETERS
Parameters AC-Ag AC-Cu AC
𝑞𝑚 (mg/g) 9.96 8.85 7.79
𝐾𝐿(1/ppm) 0.049 0.047 0.045 ave. dev. (mg/g) 0.16 0.16 0.16
TABLEVI:AVERAGE DEVIATIONS AND FREUNDLICH MODEL‟S
PARAMETERS
Parameters AC-Ag AC-Cu AC
1 𝑛
1.19 1.18 1.13
𝐾𝐹(mg/(g(ppm)1/n)) 0.031 0.028 0.022 ave. dev. (mg/g) 0.14 0.12 0.13
Fig. 4. Langmuir and Freundlich model representation of formaldehyde adsorption on AC-Ag, AC-Cu, and AC
D. Langmuir’s and Freundlich’s Models Representation The Langmuir‟s and Freundlich‟s isotherm model were used to represent the adsorption data. Regressions used to determine the model coefficients minimized the sum of squares of the relative errors in the predicted amounts adsorbed. The optimized parameters for Langmuir‟s model included qm and KL in (1) and Freundlich„s model included KF
and n in (2) for each system.
Fig. 4 shows Langmuir and Freundlich model representation of the formaldehyde adsorption on three types of activated carbons. The values of the correlation coefficients indicated that the Freundlich model was more suitable than the Langmuir model for formaldehyde adsorption each system. The model fits reasonably well with the experimental data, within 0.16 mg/g carbon of average deviation for Langmuir Model and 0, 12-0, 14 mg/g of
* 2
average deviation for Freundlich Model. Table V and Table VI also present the parameters used to fit the formaldehyde adsorption data. The highest values of qm, KL, KF,and
1 𝑛, are
obtained for AC-Ag system followed by AC-Cu and AC systems, respectively. These values agree with the values of fluid-solid potential energy parameters as listed in Table IV. The values also are related to the fluid-solid potential energy parameter.
IV. CONCLUSION
This study was conducted to investigate the effects of silver or cooper nano-particles attached onto the surface of bamboo-based activated carbon. The BET specific surface area measurements indicated that the nano-particle deposits reduced the available surface area of the activated carbon and blocked the openings of the pores. Loading silver and copper nano-particles on the activated carbon significantly increased the ability of activated carbon to adsorb formaldehyde in air. At equilibrium concentration of 8 ppm, activated carbon with addition Cu nano-particles was able to adsorb 29% higher amount of formaldehyde as compared to the original activated carbon (i.e. 0.341 mg/g AC-Cu compared to 0.264 mg/g AC). The highest loading amount was obtained for AC-Ag, being around 0.425 mg/g AC-Ag. The concentration of formaldehyde removed by the AC-Ag was 1.6 times higher than that by the virgin AC at the same equilibrium concentration. It was shown that the adsorption of formaldehyde was highly affected by the fluid-solid potential energy of the involved systems. Furthermore, the experimental data can be represented reasonably well with the Freundlich „s Model.
ACKNOWLEDGMENT
The authors would like to thank The Directorate General of Higher Education of the Republic of Indonesia for financial support under Research Grant of Universitas Indonesia for Hibah Riset Madya No. DRPM/R/209/RM-UI/2012.
REFERENCES
[1] V. J. Cogliano, Y. Grosse, R. A. Baan, K. Straif, M. B. Secretan, and F. El-Ghissassi, “Meeting report: Summary of IARC monographs on formaldehyde, 2-butoxyethanol, and 1-tert-butoxy-2-propanol,”
Environ Health Persp, vol. 113, no. 9, pp. 1205-1208. Sep. 2005.
[2] M. Hauptmann, J. H. Lubin, P. A. Stewart, R. B. Hayes, and A. Blair, “Mortality from solid cancers among workers in formaldehyde industries,” Am J Epidemiol, vol. 15, no. 12, pp. 1117-1130, June 2004. [3] H. Rong, Z. Ryu, J. Zheng, and Y. Zhang, “Effect of air oxidation of rayon-based activated carbon fibers on the adsorption behavior for formaldehyde,” Carbon, vol. 40, pp. 2291-2300, 2002.
[4] H. Rong, Z. Ryu, J. Zheng, and Y. Zhang, “Influence of heat treatment of rayon-based activated carbon fibers on the adsorption of formaldehyde,” JColloid Interf Sci, vol. 261, pp. 207-212, 2003. [5] V. Boonamnuayvitaya, S. Sae-ung, and W. Tanthapanichakoon,
“Preparation of activated carbons from coffee residue for the adsorption of formaldehyde,” Sep Purif Technol, vol. 42, pp. 159-168, 2005.
[6] L. I. Jing, L. I. Zhong, L. I. U. Bing, X. I. A. Qibin, and X. I. Hongxia, “Effect of relative humidity on adsorption of formaldehyde on modified activated carbons,” Chinese J Chem Eng, vol. 16, no. 6, pp. 871-875, 2008.
[7] C. Ma, X. Li, and T. Zhu, “Removal of low-concentration formaldehyde in air by adsorption on activated carbon modified by hexamethylene diamine,” Carbon, vol. 49, pp. 2869-2877, 2011.
[8] Q. Wen, C. Li, Z. Cai, W. Zhang, H. Gao, L. Chen, G. Zeng , X. Shu, and Y. Zhao, “Study on activated carbon derived from sewage sludge for adsorption of gaseous formaldehyde,” Bioresource Technol, vol. 102, pp. 942-947, 2011.
[9] K. J. Lee, N. Shiratori, G. H. Lee, J. Miyawaki, I. Mochida, S.-H. Yoon, and J. Jang, “Activated carbon nanofiber produced from electrospun polyacrylonitrile nanofiber as a highly efficient formaldehyde adsorbent,” Carbon, vol. 48, pp. 4248-4255, 2010.
[10] S. K. Shin and J. H. Song, “Modeling and simulations of the removal of formaldehyde using silver,” J Hazard Mater, vol. 194, pp. 385-392, 2011.
[11] J. Ma, L. Li, J. Ren, and R. Li, “CO adsorption on activated carbon-supported Cu-based adsorbent prepared by a facile route,” Sep
Purif Technol, vol. 76, pp. 89-93, 2010.
[12] C.-C. Huang, C.-H. Chen, and S.-M. Chu, “Effect of moisture on H2S
adsorption by copper impregnated activated carbon,” J Hazard Mater, vol. B136, pp. 866-873, 2006.
[13] M. Ghaedi, M. N. Biyareh, S. N. Kokhdan, S. Shamsaldini, R. Sahraei, A. Daneshfar, and S. Shahriyar, “Comparison of the efficiency of palladium and silver nanoparticles loaded on activated carbon and zinc oxide nanorods loaded on activated carbon as new adsorbents for removal of congo red from aqueous solution: kinetic and isotherm study,” Mater Sci Eng. vol. C32, pp. 725-734, 2012.
[14] S. Bashkova, D. Deoki, and T. J. Bandosz, “Effect of silver nanoparticles deposited on micro/mesoporous activated carbons on retention of NOx at room temperature,” J Colloid Interf Sci, vol. 354, pp. 331-340, 2011.
[15] S.-J. Park and B.-J. Kim, “A study on NO removal of activated carbon fibers with deposited silver nanoparticles,” J Colloid Interf Sci, vol. 282, pp. 124-127, 2005.
[16] F. L. Y. Lam and X. Hu, “A new system design for the preparation of copper/activated carbon catalyst by metal-organic chemical vapor deposition method, Chem Eng Sci, vol. 58, pp. 687-695, 2003. [17] M. Sudibandriyo, S. A. Mohammad, R. L. Robinson, and K. A. M.
Gasem, “Ono-Kondo lattice model for high-pressure adsorption: pure gases,” Fluid Phase Equilibr, vol. 299, pp. 238-251, 2010.
[18] M. E. V. Leeuwen, “Derivation of Stockmayer potential parameters for polar fluids,” Fluid Phase Equilibr, vol. 99, pp. 1-18, 1994.
[19] W. A. Steel, The Interaction of Gases with Solid Surfaces, New York: Pergamon Press Oxford, 1974.
[20] S. Morioka, “The dense gas-like model of the viscosity for liquid metals,” J Non-Cryst Solids, vol. 341, pp. 46-52, 2004.
International Journal of Chemical Engineering and Applications, Vol. 4, No. 5, October 2013
W. D. P. Renggawas born in Semarang, Central Java
(Indonesia) on 19th May 1974. She received her
master‟s degree in Chemical Engineering from Universitas Indonesia. At present she is doing Doctorate Program in Chemical Engineering Department, Universitas Indonesia under the supervision of Prof. Dr. Ir. Mohammad Nasikin, M.Eng and Prof. Ir. Mahmud Sudibandriyo, M.Sc., Ph.D. Her major field of study is adsorption fluid pollutants using modified activated carbon.
M. Sudibandriyo was born in Pati, Central Java
(Indonesia) on 18thAugust 1963. He is a lecturer of
Chemical Engineering, Faculty of Engineering, University of Indonesia since 1987. He graduated from Institut Teknologi Bandung with a BSc in Chemical Engineering. He gained a Master also in Chemical Engineering from Oklahoma State University in 1991. In 2000, he pursued Ph.D program and became a teaching assistant and research assistant at Oklahoma State University, School of Chemical Engineering. He hold a doctoral degree in Chemical Engineering from Oklahoma State University in 2003. His major field of study is thermodynamics and adsorption.
M. Nasikinwas born in Sidoarjo, East Java (Indonesia)
on 1stMay 1961. He graduated from Institut Teknologi