ISSN: 2147-611X
www.ijemst.com
Secondary
Teachers’
Knowledge
Structures for Measures of Center,
Spread
&
Shape
of
Distribution
Supporting their Statistical Reasoning
Christopher Engledowl1, James E. Tarr2
1
New Mexico State University, United States
2University of Missouri, United States
To cite this article:
Engledowl, C. & Tarr, J.E. (2020). Secondary teachers‘ knowledge structures for measures
of center, spread & shape of distribution supporting their statistical reasoning.
International
Journal of Education in Mathematics, Science and Technology (IJEMST), 8
(2), 146-167.
This article may be used for research, teaching, and private study purposes.
Any substantial or systematic reproduction, redistribution, reselling, loan, sub-licensing,
systematic supply, or distribution in any form to anyone is expressly forbidden.
Authors alone are responsible for the contents of their articles. The journal owns the
copyright of the articles.
Volume 8, Number 2, 2020
Secondary Teachers’ Knowledge Structures for Measures of Center,
Spread & Shape of Distribution Supporting their Statistical Reasoning
Christopher Engledowl, James E. Tarr
Article Info
Abstract
Article History
Received: 23 August 2019
Recent standards reform documents across the globe have called for statistical literacy by the end of high school. Thus, it is important for teachers to develop a deep understanding of the content. Despite the relatively thick literature base connecting students‘ content knowledge and reasoning, research on these connections among practicing teachers is in critical need. Our study contributes to this lack of research by examining the knowledge structures and statistical reasoning—and possible ways knowledge structures supported reasoning—of a stratified purposeful sample of nine middle and secondary mathematics teachers as they responded to released items from the Levels of Conceptual Understanding in Statistics (LOCUS) assessment during two 60– 90 minute task-based clinical interviews. Knowledge structures were categorized as compatible-connected, incompatible-connected, and incompatible-disconnected. Teachers with less incompatible knowledge elements in their structures engaged more frequently in reasoning coded as sound. However, teachers frequently engaged in both sound and unsound forms of reasoning on the same task item. Implications are offered for teacher education and future research.
Accepted: 20 November 2019
Keywords
Statistics education Statistical reasoning Cognition
Teacher education
Introduction
Recent calls for research into teachers‘ statistical knowledge and reasoning (e.g., Biehler, Frischemeier, Reading, & Shaughnessy, 2018; Groth & Meletiou-Mavrotheris, 2018) appear amid expectations of statistical literacy, as evidenced through standards and curriculum documents internationally (e.g., Australian Curriculum Assessment and Reporting Authority [ACARA], 2014; England Department of Education, 2014; Franklin et al., 2007; Ministry of Education Singapore, 2012; National Governors Association Center for Best Practices & Council of Chief State School Officers, 2010). Despite calls for statistical literacy, there is convincing evidence that many teachers do not feel prepared to teach the statistics content required of them—according to both of Banilower and colleagues‘ (2018, 2013) nationally representative surveys of elementary and secondary mathematics teachers in the US. This is likely due to how recent such standards and curriculum reform documents have called for statistical literacy—which requires a deeper level of understanding of statistics content than they likely had the opportunity to learn in their tertiary coursework (Alkas Ulusoy & Kayhan Altay, 2017; Castro Sotos, Vanhoof, Van den Noortgate, & Onghena, 2007; delMas, Garfield, Ooms, & Chance, 2007). In order to address the lack of research on how mathematics teachers‘ statistical reasoning may be related to their statistical knowledge, this study aims to develop a deeper understanding of these relationships. More specifically, the following research questions guided this study:
1. What knowledge structures do middle level and secondary mathematics teachers have, regarding center, spread, and shape of distributions?
2. In what ways do middle level and secondary mathematics teachers‘ knowledge structures support their statistical reasoning?
Background and Theoretical Framework
beginning of the course (delMas et al., 2007). It has further been observed that instructors may frequently exhibit the same misconceptions as their students (Haller & Krauss, 2002). These findings indicate that teachers are not likely to have a strong background in statistics. This is perhaps the reason why so little research has been conducted around practicing teachers‘ statistics knowledge. The next sections will address first our theoretical stance on knowledge and then progress to describe compatible and incompatible ways of thinking about center, spread and shape of distributions that have been documented in the literature. Finally, we provide some discussion of an important mode of inquiry that has been successful in other research in studying and attempting to map knowledge structures.
Theoretical Stance on Knowledge
Epistemologically, we take a constructivist stance in this study, that knowledge is constructed and that learning occurs through integration of newly constructed knowledge elements into one‘s cognition (Herscovics, 1996; Sen & Ay, 2017). Thus, existing knowledge structures, including all its inconsistencies and perceived flaws, are viewed as guiding the extension of new ways of thinking (Duit, 1992, as cited in Booker, 1996). von Glasersfeld (1991) argued that, as a result, knowledge could be assumed when a person responds ―in ways that seem compatible‖ with one‘s own understanding (p. 5). Therefore, we use the terms compatible and incompatible to describe knowledge that may support or limit broader conceptions. Moreover, we extend this idea further by relating it to whether the observed knowledge element is compatible or incompatible with the knowledge as it is described in the literature base. Other scholars have utilized similar terms to describe knowledge, such as Moschkovich (1999) and Hohensee & Jansen (2017) who used the terms conception and transitional
conception. However, these terms were defined in the context of a more longitudinal study design, and therefore
were not useful for the present study.
Knowledge of Center
In a literature review conducted by Jacobbe and Carvalho (2011), teachers and preservice teachers were generally found to 1) have a procedural understanding of measures of center and to prefer algorithms when asked about the center, 2) struggle to make connections between different measures of center, 3) prefer the mean over other measures, and 4) struggle to flexibly apply computations and consider effects of the outliers, distribution, and context on the result. As also found by Jacobbe and Carvalho (2011), Leavy and O‘Loughlin‘s (2006) study of preservice teachers‘ conceptions of mean found that a majority do not distinguish between the words ―average‖ and ―mean.‖ Despite these deficit findings, at least two studies described a range of conception types, one of which separated them into hierarchical levels to help understand the types of conceptions teachers may have and what limitations they inherently impose. Gfeller, Niess, and Lederman (1999) found that when solving problems involving the arithmetic mean, mathematics and science preservice teachers made use of either a procedural understanding or a ―fair share‖ understanding—which the GAISE report (Franklin et al., 2007) places at the lowest level of understanding—which involved balancing deviations. Perhaps more useful in distinguishing conceptions, Groth and Bergner (2006) used the SOLO Taxonomy (Biggs & Collis, 1982) to describe preservice elementary teachers‘ thinking, when comparing mean, median, and mode, across four hierarchical levels:
Unistructural: procedural understanding only;
Multistructural: procedural with a recognition that all are analysis tools (but with no specification of what they measure);
Relational: indicates that all are measures of center or represent what is typical for a dataset;
Extended abstract: includes description of when each measure might be more useful than another (Groth & Bergner, 2006, p. 51)
Groth and Bergner‘s (2006) findings align with others in that most of the teachers were at the multistructural and relational level, indicating that the vast majority were not able to describe salient differences in measures of center. Moreover, it is important to note that understanding when, for instance, the median might be more useful than the mean requires relating conceptions of center and shape (e.g., skewed, symmetric).
Knowledge of Spread
The empirical study of teachers’ conceptions of spread is fairly recent in the literature, relative to investigations
of students’ conceptions. However, Langrall and colleagues‘ (2017) review of frameworks that have been used
―integration of concepts and the ability to attend to and coordinate multiple aspects of the data being examined‖ (p. 495) among the highest levels of reasoning. It is noteworthy that Langrall and colleagues (2017) made no mention of studies that focused on teachers‘ knowledge of variability, but instead referred readers to the book
Teaching statistics in school mathematics-Challenges for teaching and teacher education: A Joint ICME/IASE
Study (Batanero, Burrill, & Reading, 2011). In Batanero and colleagues‘ (2011) volume, Sánchez, Silva, and
Coutinho (2011) wrote the literature review chapter on variability, titled Teacher’s Understanding of Variation, and cited a total of four studies explicitly involving teachers—the most relevant of which was Silva and Coutinho (2008). In their literature review, Sánchez, Silva, and Coutinho (2011) extract four hierarchical levels of reasoning from Silva and Coutinho (2008), which are paraphrased below:
Level 1 (idiosyncratic): calculating mean and standard deviation without indicating knowledge of what they mean
Level 2 (verbal reasoning): ―perception of variation; understanding the standard deviation as the measure of the difference between the values of the data; the idea that low standard deviation is better and recognizing there are quantities of values within one standard deviation interval from the mean.‖ (p. 3)
Level 3 (transitional reasoning): using at least two summary statistics, such as ―maximum and minimum values, mode and the graph representation itself‖, many times leaving out standard deviation and not completely integrating the ideas (p. 4)
Level 4: (procedural reasoning): standard deviation as measure of deviation from the mean without estimating ―a percentage of the observations in this interval‖ (p. 5)
These hierarchical levels echo Langrall and colleagues‘ (2017) description that higher sophistication in conceptions of variability require consideration of multiple knowledge types (e.g., spread around a center as opposed to only referring to the range).
Knowledge of Shape
It is important to note that many studies around the conception of shape are studies also of variability. Moreover, as a concept integral to thinking about distribution, shape tends to involve integration of center and spread (Bakker & Gravemeijer, 2004; Ekol, 2015; Pfannkuch & Reading, 2006; Reading & Canada, 2011). For instance, a symmetric distribution with a high peak might be described as ―tight‖, indicating a narrow spread as well as a general location of multiple measures of center. For this reason, ideas of distribution cannot easily be isolated and reasoning about distribution is a complex process (Pfannkuch & Reading, 2006). Moreover, the notion of shape is just one of many conceptions included in the literature on distribution, and is widely accepted to involve ―features such as center, spread, density, skewness, and outliers but also involves other ideas such as sampling, population, causality and chance‖ (p. 4), and thus distribution has been referred to as being located within a ―web of statistical knowledge‖ (Reading & Canada, 2011, p. 224). However, some ideas relating to shape (as well as center and spread) from the literature on teachers‘ conceptions of distribution are helpful to inform this study. One common misunderstanding students and teachers appear to have is that skewed distributions will be more variable than symmetric distributions (delMas & Liu, 2005; Doerr & Jacob, 2011). For example, Doerr and Jacob (2011) studied a group of secondary practicing and prospective mathematics teachers, as well as mathematics education doctoral students. Some common misunderstandings they claimed teachers exhibited regarding variability and shape were:
1. not attending to how skewness impacts standard deviation when comparing two skewed distributions in which one is more strongly skewed,
2. judging symmetric distributions to have a smaller standard deviation than a non-symmetric distribution with a much smaller range and similar mean, and
3. more clearly indicating that symmetry ―minimizes standard deviation‖ (pp. 780–781).
These findings led Doerr and Jacob to conclude that ―some teachers had difficulty interpreting skewed distributions and tended to inappropriately choose symmetric normal distributions‖ (p. 784). A consistent finding across studies regarding center, spread, and shape is that more sophisticated forms of reasoning are evidenced by the integration of multiple concepts—both within and between knowledge element types (center, spread, shape). Therefore, this study attempts to understand teachers‘ integration of these knowledge element types and how such integration may support their reasoning. As a result, it is important to consider how other studies have examined students‘ or teachers‘ knowledge structures.
Measuring and Mapping Knowledge Structures
inconsistencies. This is not a new concept and has been used in mathematics education for many years in the study of, for instance, students‘ and teachers‘ fractional reasoning (e.g., Izsák, 2008; Steffe, 2001). Regarding statistics content, two studies of importance have used such methods. Ron, Dreyfus, and Hershkowitz (2010, 2017) conceptualized the perspective of partially-correct constructions (PaCCs) because they were confronted with a situation in which students were exhibiting unexpected contradictions in their observed knowledge. They defined a PaCC as ―a construct that only partially matches a corresponding intended knowledge element‖ (p. 69). In this way, they identified all possible constructions and used a content analysis to identify intended
knowledge elements from which to decide if an observed knowledge element was constructed in the intended way or not. Moreover, these knowledge elements are intended to have observed connections between them, in part, because the original purpose was to trace learning over time and thus understand the process of knowledge construction. Building upon Ron and colleagues‘ (2010) perspective of knowledge structures as PaCCs, Groth and Bergner (2013) incorporated node-link diagrams in their study of elementary preservice teachers‘ knowledge structures for teaching nominal categorical data analysis. Development of visual representations of knowledge structures allowed Groth and Bergner to conduct a finer-grained analysis, and understanding, of participants‘ knowledge. Therefore, this study first employs an examination of knowledge structures in order to establish a deeper understanding of teachers‘ knowledge, including its inconsistencies, so that potential supports for teachers‘ reasoning may then be more accurately inferred.
Method
Because we sought to collect the full range of settings in which statistics is taught by middle level and secondary mathematics teachers (teachers of students aged 11–18), the overall design used to address the research questions first involved recruiting a stratified purposeful sample (Patton, 2002). Recruitment extended across four strata—teachers who had taught an Advanced Placement (AP) statistics course (N = 2), a non-AP statistics course (N = 2), at least one unit of statistics in the context of a secondary mathematics course (N = 2), and at least one unit of statistics in the context of a middle level mathematics course (N = 3). AP Statistics courses cover similar content to that of a tertiary course in statistics at the undergraduate level (e.g., hypothesis testing). Data was collected through a task-based clinical interview design (Goldin, 1997) and analyzed using a cross-case analysis (e.g., Groth & Bergner, 2013) to identify patterns across knowledge structures (RQ1) and to distinguish the ways knowledge structures may provide support for statistical reasoning (RQ2).
Participants and Setting
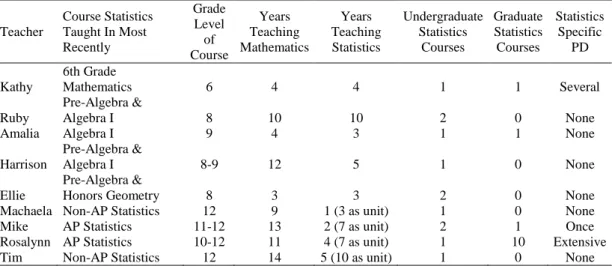
Participants were recruited in order to achieve a stratified purposeful sample (Patton, 2002). Recruitment intensely focused on mathematics teachers at the middle and secondary level who had taught statistics content that explicitly included data analysis, such as calculating summary statistics, to make decisions based on the data. The resulting nine teachers who participated in this study were uniformly spread across the four strata and taught in middle level and secondary schools in the Midwestern portion of the US. All nine teachers held Bachelor‘s degrees in either Mathematics or Mathematics Education, Master‘s degrees in education-related fields, and had completed at least one tertiary course in statistics (see Table 1).
Table 1. Study participant backgrounds
Teacher
Course Statistics Taught In Most Recently Grade Level of Course Years Teaching Mathematics Years Teaching Statistics Undergraduate Statistics Courses Graduate Statistics Courses Statistics Specific PD Kathy 6th Grade
Mathematics 6 4 4 1 1 Several
Ruby
Pre-Algebra &
Algebra I 8 10 10 2 0 None
Amalia Algebra I 9 4 3 1 1 None
Harrison
Pre-Algebra &
Algebra I 8-9 12 5 1 0 None
Ellie
Pre-Algebra &
Honors Geometry 8 3 3 2 0 None
In contrast, there was a large amount of variability in their teaching experience in mathematics, but much less variability in experience in teaching statistics. Moreover, statistics teaching experience was not concentrated at a specific grade band or stratum.
Data Sources
GOALS-2
Data came from two sources. To aid in answering the first research question, the Goals and Outcomes Associated with Learning Statistics (GOALS-2) assessment (Sabbag & Zieffler, 2015) was first used to gain baseline data on the extent of the formal knowledge participants held that would traditionally be included in a tertiary course, as well as to confirm knowledge elements found during analysis of other sources. The GOALS-2 was developed from items from the Comprehensive Assessment of Outcomes in Statistics (CAOS) assessment (delMas et al., 2007), which has been shown to be psychometrically valid and reliable. GOALS-2 includes 20 forced-choice items on topics such as covariation, samples and sampling, hypothesis testing (e.g., confidence intervals, p-values) and study design. It was completed online, and item-level scores and answer selections were retrieved once participants had completed the assessment.
LOCUS Tasks
Data to aid in answering both research questions came from teachers‘ written and verbal responses to four constructed response released tasks from the Levels of Conceptual Understanding in Statistics (LOCUS) assessment (Jacobbe, 2016). The LOCUS assessment was developed to assess middle and secondary level students‘ conceptual understanding of statistics (Whitaker, Foti, & Jacobbe, 2015). The items were intended to align with the hierarchical developmental levels across the four statistical problem solving process components described in the Guidelines for Assessment and Instruction in Statistics Education (GAISE) Report (Franklin et al., 2007), as well as the Common Core State Standards for Mathematics (CCSSM) (National Governors Association Center for Best Practices & Council of Chief State School Officers, 2010). All LOCUS items, including those that are released, have been extensively reviewed and vetted by experts in the field, including multiple authors of the GAISE report, the American Statistical Association/National Council of Teachers of Mathematics Joint Committee on Curriculum in Statistics and Probability, the National Science Foundation project‘s advisory board and two test development committees (Jacobbe, Case, Whitaker, & Foti, 2014).
The four constructed response LOCUS tasks that were selected for this study were categorized under the statistical problem solving process components of data analysis and interpreting results because our second line of inquiry was to examine teachers‘ reasoning. Moreover, these tasks were selected based on Huey and Jackson‘s (2015) suggestion that tasks be ill-structured and open-ended, and set in a context that is necessary in order to respond to the task. Some of the LOCUS tasks were adapted from their original format by removing prompts that did not align with the goals of this study.
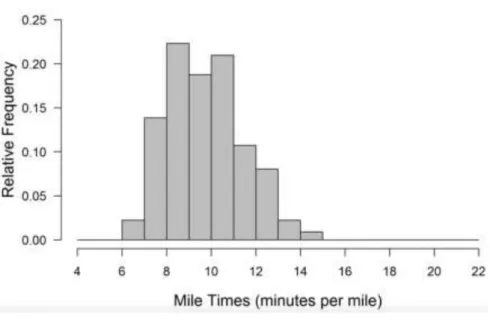
To illustrate these task features, the New Year‘s Day Race task (see Figure 1) initially prompted participants, stating ―Jaron predicted that the mile times of runners in the 5K race would be more consistent than the mile times of runners in the half-marathon. Do these data support Jaron‘s statement? Explain why or why not‖ (Jacobbe, 2016). This prompt is ill-structured because it does not require a specific solution method, it is open-ended because it allows for multiple solution paths, and the context is a necessary component to include in any response.
Figure 1. Histograms presented in the New Year‘s Day Race task. Released item from LOCUS assessment (Jacobbe, 2016)
Task-based Clinical Interviews
Data Analysis
Knowledge Structures
Regarding the first research question, data analysis involved constructing maps of teachers‘ knowledge structures for the knowledge types of center, spread and shape of distributions from transcripts of teachers‘ verbal responses to the four LOCUS tasks, using video of their gestures and any written responses as additional evidence, as well as responses to GOALS-2 assessment. Open-coding of transcripts and written responses were used to identify constructed knowledge elements and what connections teachers may have drawn between such knowledge elements. We followed a similar method to that of Ron and colleagues (2010) and Groth and Bergner (2013) that refers to partially-correct constructions (PaCCs), except that this study was cross-sectional and not intended to follow the teachers across an a priori learning trajectory.
They are referred to as partially-correct because they include all observed knowledge elements, regardless of whether they represent ―impoverished conceptual and procedural knowledge‖ (Groth & Bergner, 2013, p. 250). An advantage of tracing the development of knowledge was that Groth and Bergner were able to identify missing knowledge elements and which elements contributed to the construction of others. Because this study is cross-sectional and unable to identify these features, we use the term knowledge structures to distinguish them from Groth and Bergner‘s PaCCs. After maps were constructed for each teacher, a cross-case analysis was carried out to identify possible patterns and to create categories for types of knowledge structures.
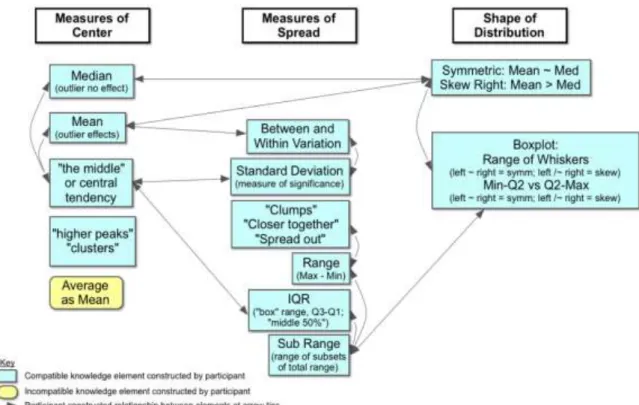
To construct the maps of teachers‘ knowledge structures, each observed knowledge element related to the knowledge element types of center, spread, or shape of distribution was first identified as compatible or
incompatible, and represented visually by a blue rectangle or a yellow rectangle with rounded edges,
respectively (see Figure 2). Missing elements were identified for teachers when they explicitly stated they had not constructed a particular knowledge element. Such elements were represented as a blue rectangle with an X over them. Knowledge elements coded as compatible were those that align with current understandings of the content in the field of statistics believed to support conceptual development of other knowledge elements and types. Knowledge elements coded as incompatible were those that do not align with current understandings of the content in the field of statistics, or would not allow for a compatible knowledge element to be constructed from it.
To illustrate, all participants were observed associating the term ―average‖ with the term ―mean.‖ Although this association does not necessarily imply that average is defined as mean or that mean is defined as average, all teachers consistently replaced average with mean. This is considered incompatible because the term average is a much broader term than mean, referring to what is typical. Thus, a unidirectional meaning that average implies mean can inhibit more general ways of thinking about what is typical (Leavy & O‘Loughlin, 2006). As can be seen in Rosalynn‘s knowledge structure, this way of speaking was coded as ―average as mean‖ and indicated with a yellow rectangle with rounded edges.
On the other hand, an example of a compatible knowledge element is that the arithmetic mean is sensitive to extreme values. This is compatible because 1) it is a statistically sound knowledge element used consistently in the field of statistics and 2) it is supportive of the construction of connections between other conceptions of center (i.e., median, mode) and when each would be more appropriate (connections within a knowledge type), as well as connections between respective positions of different measures of center based on the shape of the distribution (connections between knowledge types). Such connections have empirical grounding for being at a hierarchically higher level (Groth & Bergner, 2006).
Statistical reasoning. To aid in answering the second research question, teachers‘ statistical reasoning was
characterized using Means and Voss‘ (1996) framework for informal reasoning. I employed the use of the following questions from their analytic framework:
1. What claims are being made and what reasons are offered?
2. Is the reason being offered acceptable and does it support the claim?
Means and Voss (1996) described reasoning as being sound if the reason offered was both acceptable and it supported the claim. We used this same language in our coding. Reasons offered for claims were considered to
be sound if they drew on compatible knowledge elements. To illustrate, if a teacher reasoned (see Figure 1) that
the mile times for the half marathon runners are more consistent than those of the 5K runners because the mile times for the half marathon runners have a smaller range, it would be considered sound because range is a compatible knowledge element to reason about consistency (i.e., variability).
Furthermore, comparing the differences in the ranges supports the claim that one group is more consistent than the other group. In contrast, suppose a teacher were to reason that the far right bars in the 5K histogram were outliers and therefore should be ignored, resulting in the two groups having a similar range for the ―center mass‖ and thus the same consistency. This would be identified as unsound because it does not support the claim of similar consistency. Although focusing on a subrange of the center of the distribution is a compatible knowledge element (e.g., IQR is the spread of the middle 50%), the subranges of the ―center mass‖ of each plot would be the same regardless of whether outliers were considered or not. For this study, analysis focused on the task items (see Appendix) that required only drawing on knowledge of center, spread, and shape of distributions, and not items that required inferential statements. After all responses were coded according to Means and Voss‘ (1996) framework, a within-case and cross-case analysis were carried out to identify common themes in teachers‘ reasoning.
Findings
Cross-case analysis of teachers‘ knowledge structure maps, based on responses to the GOALS-2 (Sabbag & Zieffler, 2015) and LOCUS (Jacobbe, 2016) tasks, led to the creation of three categories of knowledge structures that are helpful to describing teachers‘ knowledge structures: compatible-connected (3 teachers),
incompatible-connected (4 teachers), and incompatible-disconnected (2 teachers). Although these categories are
Knowledge Structures for Centre, Spread and Shape
Compatible-Connected Knowledge Structures
Three teachers—Tim, Rosalynn, and Mike—had knowledge structures that were categorized as
compatible-connected. The distinguishing features of knowledge structures categorized as compatible-connected can be
exemplified with Rosalynn‘s knowledge structure map (see Figure 3). The most distinguishing feature was that the knowledge structure was highly interconnected, both within and between knowledge element types, and
incompatible knowledge elements were rare and disconnected.
For example, Rosalynn‘s knowledge structure (Figure 3) indicates multiple connections within each knowledge element type, and direct connections across all possible pairs of knowledge element types (e.g., between center and spread). More specifically, Rosalynn expressed evidence of connections within the measure of center knowledge type while describing a plausible student response to the New Year‘s Day Race task:
[a student might] say ‗the middle of the graphs are really close together‘, where they have the idea that the mean or average is center, but the wrong application of it. So then you can talk about median being the actual frequency middle, versus um, arithmetic mean and the calculation that goes into that (Rosalynn, New Year‘s Day Race, Line 76).
In this quote, Rosalynn connects a more general notion of center as ―the middle‖ to the more specific notions of center as mean and center as median. Therefore, these knowledge elements are connected within the knowledge element type of measures of center. These types of connections were observed for all three knowledge structures in this category.
Later on, while responding to the Jumping Distances task, Rosalynn connected the more general notion of ―the middle‖ as a measure of center, with the inter-quartile range (IQR) as a measure of spread, thus drawing a connection between the two knowledge types. During another task, she provided evidence of a connection between center and shape, stating ―with that somewhat symmetric shape your mean and your median are going to be about the same‖ (New Year‘s Day Race, Line 24). Furthermore, on the Jumping Distances task, a connection was observed between the more general notion of sub-range as a way to understand variability to the shape of the distribution of a box-plot by comparing the lengths of each quartile. Therefore, at least one direct connection was observed between all three knowledge element types, as was seen across all three knowledge structures in this category. This finding is evidence that these three teachers‘ knowledge of center, spread and shape was highly integrated.
Incompatible-Connected Knowledge Structures
Similar to compatible-connected knowledge structures, incompatible-connected knowledge structures were observed to be highly interconnected both within and between knowledge element types, but, in contrast, they all included at least one incompatible knowledge element that was connected to a compatible knowledge element. The knowledge structures of Harrison, Michaela, Ruby, and Ellie were categorized as
incompatible-connected.
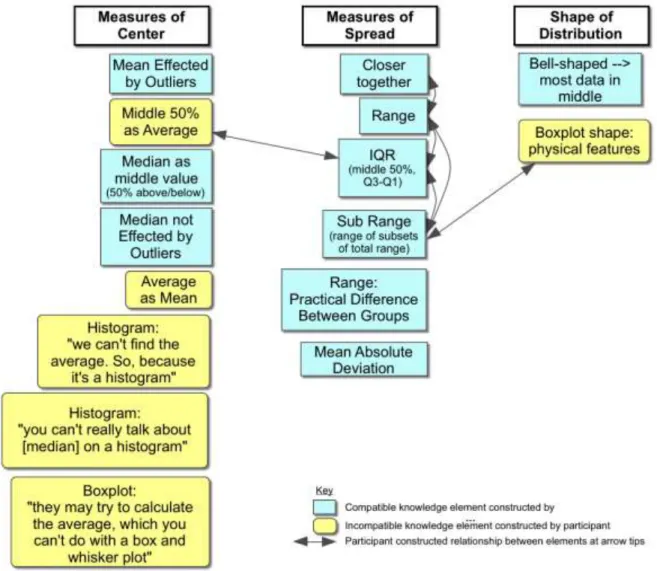
Figure 4. Harrison‘s knowledge structure map
As can be seen in Harrison‘s knowledge structure map (Figure 4), as a case of an incompatible-connected
knowledge structure, multiple connections were observed within knowledge element types. However, in contrast to compatible-connected knowledge structures, Harrison was observed to draw a connection between a compatible and incompatible knowledge element within the measure of spread knowledge element type. Harrison provided evidence of a compatible knowledge element of spread on the Jumping Distances task when he compared the variability in jumping distances for two groups by saying ―from an overall range, or min max, it looks like there‘s a difference of about 10 on the high end [gesturing to max of both plots], and like, what would that be on the low end, like 15 or so [gesturing to min of both plots], 15, 16 something like that‖ (Line 18). Further evidence of the range as a measure of spread was provided on the New Year‘s Day Race task when he claimed, ―it has a wider, the range is [gesturing to max and min on histogram of 5K runners‘ mile times], I guess that‘s the most obvious one that‘s bigger‖ (Line 9).
Figure 5. Ruby‘s knowledge structure map
Another common feature of incompatible-connected knowledge structures is that either direct or indirect connections were observed between all knowledge element types. An indirect connection is one that passes through at least one knowledge element type to get to another knowledge element type, with no direct connection between the two. For instance, Ruby‘s knowledge structure map (Figure 5) indicates that she was not observed to make a connection between measures of center and measures of shape. However, on the Jumping Distances task, when she described the shape of the boxplot (referring to physical features only, an incompatible
knowledge element) she also described sub-ranges of the data, making a connection to a compatible way of thinking more flexibly about spread. Extending the connection, Ruby further indicated that spread should focus on the ―center bars‖ of a histogram (New Year‘s Day Race, Line 23 and 105), and that the interquartile range (Jumping Distances, Line 12) is preferred for boxplots. This connected the compatible element of a sub-range, to the incompatible element that spread should focus on the center portion—much like Harrison did. Completing the indirect connection between shape and center, Ruby spoke more generally about comparing centers by talking about ―the entire IQR being higher‖ (Jumping Distances, Line 57). As with Ruby‘s knowledge structure, all knowledge structures in this category included at least one indirect connection across knowledge element types that included at least one incompatible knowledge element. This finding indicates that although these four teachers‘ knowledge of center, spread and shape was highly interconnected, incompatible knowledge elements were included in those interconnections.
Incompatible-Disconnected Knowledge Structures
Similar to the incompatible-connected knowledge structures, incompatible-disconnected knowledge structures also included incompatible knowledge elements that were connected to compatible knowledge elements. The feature that distinguishes it from the other two categories is that the knowledge elements were largely disconnected from one another. The knowledge structures of Amalia and Kathy were categorized as
incompatible-disconnected.
incompatible-connected knowledge structures. Similarly, connections were observed both within and between knowledge types, as with the other two categories, and connections were observed between compatible and incompatible knowledge elements, as with incompatible-connected structures. The most distinguishing feature of
incompatible-disconnected knowledge structures was that the majority of the knowledge elements were
observed to be disconnected from one another.
Figure 6. Kathy‘s knowledge structure
This finding indicates that Kathy‘s and Amalia‘s knowledge of center, spread and shape was largely disconnected, and when connections were drawn between knowledge types, there were incompatible conceptions integrated into the structure.
Characterizing Statistical Reasoning
Across all tasks, teachers who offered unsound forms of reasoning—those who drew on incompatible knowledge elements or whose reasons did not support their claims—also engaged in sound forms of reasoning on those same items. Because of the interview protocol‘s consistent calls for teachers to consider alternate arguments that would be considered appropriate justification, four of the nine teachers offered multiple arguments—multiple claims or multiple reasons for claims—for 2 of the 3 subparts and all of the teachers offered multiple arguments for at least 1 of the 3 subparts. No teacher was observed to engage only in unsound
forms of reasoning across all task items. However, two teachers, Tim and Rosalynn, engaged in only sound
forms of reasoning on the three task items analyzed in this study.
remaining teachers (Ruby, Ellie, Kathy) were observed to only engage in reasoning coded as unsound on at least one task item. The next few sections detail the sound and unsound nature of the teachers‘ reasoning.
Knowledge of Shape
The most common cause of a teacher‘s reasoning being coded as unsound was a result of drawing upon incompatible knowledge elements of shape. This occurred in two central ways: 1) considering shape to be about
spread (i.e., that they were the same concept) and 2) connecting shape and spread in incompatible ways.
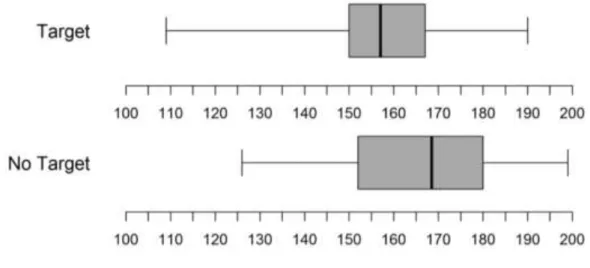
Shape is spread. Three teachers were observed considering shape and spread to mean the same thing (Ruby, Ellie, Kathy). In particular, this occurred on the Jumping Distances task. This task prompted participants to compare the center, spread, and shape (explicitly) of the distances that two groups of students jumped—one with a target to jump towards, the other with no target (see Figure 7).
Figure 7. Boxplots presented in the Jumping Distances task. Released item from LOCUS assessment (Jacobbe, 2016).
To illustrate, consider Ellie‘s response regarding spread and shape. Note that she does not offer a description of shape until prompted. Just prior to this interaction, she compared the ranges for each group by computing the maximum minus minimum.
Ellie: The box part of the box and whisker plots [tracing outline of center box on each plot], on the no
target is bigger, so that would mean that more of the data is [gesturing by moving hands inward towards middle of box] in the, between the lower quartile and the upper quartile. In that area [gesturing to box of no target plot]. So in the [motioning by pushing her hands together], more of the data is in that area.
Researcher: Okay.
Ellie: Um, yeah. I think that‘s all I have to say, right?
Researcher: What about shape?
Ellie: Well, does that not go with the shape? That this is bigger [drawing lines at Q1/Q3 on no target
plot] than that [marking on target plot].
Researcher: Okay.
Ellie: And so the whiskers are shorter [gesturing to whiskers of no target plot]. That‘s what I was going
with, with the shape.
Researcher: Okay. I wasn‘t sure so thank you.
In this excerpt, Ellie first describes spread by informally comparing the inter-quartile range for each group. It is not until she is prompted (―What about shape?‖) that she reveals that she is conceptualizing spread and shape to be equivalent. Because of this conception that points to a physical feature (i.e., shape) of the graph that indicates a measure of spread, rather than shape of distribution, Ellie‘s reasoning in this instance was coded as unsound
Connecting to shape. The second way that teachers‘ reasoning around shape was coded as unsound was when they made incompatible connections to shape. This is different from the reasoning of Ellie, Ruby, and Kathy, because Ellie, Ruby, and Kathy did not make connections about the relationship between shape and spread, but rather considered them to be the same conception. Amalia, on the other hand, recognized that shape would impact spread, while Michaela recognized that shape would impact center. However, in the case of Amalia, although she drew on compatible knowledge about shape—comparing the whisker lengths to decide symmetry and skewness—she used this information in an incompatible manner to determine the spread. For instance, on the Jumping Distances task, she states:
The no target looks to be more symmetric [and the target] is close to be symmetric, but it is slightly skewed. So maybe a little more variability, if we look at the largest versus the shortest jump [of the target group], where here [no target plot] the largest versus the shortest isn‘t as spread apart. (Line 10)
In this excerpt from Amalia, she reasons about the spread by conceiving that a more symmetric shape implies less variability. It just so happens that in this case, it is true when measuring spread with the total range—the no target group has a smaller range and is more symmetric. She was observed making this same claim on the New Year‘s Day Race task—using the symmetry to claim more consistency.
In a similar manner, on the New Year‘s Day Race task, Michaela claimed that a skewed right distribution implies that the mean (a measure of center) is pulled to the left of the median and a skewed left distribution implies that the mean is pulled to the right of the median. Although a relationship between center and shape does in fact exist, Michaela‘s conception of this relationship was not in the compatible direction. The mean is pulled in the same direction of the skew, not the opposite direction.
Knowledge of Center
Other sources of unsound forms of reasoning were related to observations of how teachers described center. Mike and Harrison were both observed in this category. For instance, on the Jumping Distances task, Harrison was concerned with the idea of shift as a way of comparing centers, claiming that ―with the exception of that first quartile, everything else is shifted over in that 10 to fifteen range‖ (Line 19). This idea of shift is concerned with a broader sense of center rather than variability. A similar line of reasoning was observed on the New Year‘s Day Race task, where he indicated that students should focus on the ―center mass‖ and ―ignore the tails‖ (Line 122) when comparing consistency, providing evidence that he believes that range 1) is a measure of spread and 2) can be used to compare locations (centers). Therefore, his reasoning comparing consistency on the New Year‘s Day Race task, and comparing spread and center on the Jumping Distances task were coded as
unsound because they drew on incompatible connections between spread and center—that spread can be a
measure of center.
Ignoring Outliers
A last common way that teachers‘ reasoning was coded as unsound was for being dismissive of outliers. Harrison and Amalia were both observed reasoning in this way on the New Year‘s Day Race task. However, on that task, in particular, the supposed outliers—identified by both teachers as the two far right bars of the 5K histogram—account for more than 10% of the 5K runners. Ignoring this large chunk of data is not appropriate because 1) it represents a substantial subset of the data and 2) these are assumed to be valid mile times and therefore they are necessary for representing the whole of 5K runners‘ mile times—without this subset of the data, any claims would be of a smaller subset and not all 5K runners. However, neither Harrison nor Amalia were observed altering their claims to accurately depict the subset of data that ignores the supposed outliers— such as referring to them as the non-walkers.
Siloed and Inter-connected Compatible Knowledge
As previously mentioned, across all tasks, all teachers reasoned in ways coded as sound on at least one task. Moreover, five teachers (Mike, Michaela, Amalia, Harrison, Ellie) reasoned in ways coded as sound and
unsound on the same item. Considering the reasoning that was coded as sound, most teachers utilized
The largest opportunity for connecting knowledge types was on the Jumping Distances task, in which teachers were asked to compare center, spread, and shape of distribution (see Figure 7). However, on this particular task, it was largely infrequent, and teachers tended to describe center, then spread, then shape, all as distinct comparisons. As might be expected, teachers whose knowledge structures were described as
compatible-connected and incompatible-connected were observed drawing connections between compatible knowledge
elements to support sound forms of reasoning. However, the inclusion of incompatible knowledge elements into a teacher‘s knowledge structure increased the likelihood of connections between incompatible and compatible knowledge elements. Teachers whose reasoning was coded as sound and whose knowledge structures also included a connection between at least one pair of compatible knowledge elements from different knowledge element types on the Jumping Distances task were (organized by knowledge structure category):
Incompatible-connected knowledge structure
o Ruby (connection between center and spread)
o Harrison (connections between center and shape; spread and shape)
o Michaela (connections between shape and spread; shape and center)
Compatible-connected knowledge structure
o Mike (connections between center and shape; spread and shape)
o Rosalynn (connection between spread and shape)
o Tim (connections between center and shape; spread and shape)
Considering the possible relationship between knowledge structures and the integration of knowledge element types to support reasoning, it is to be expected that all three teachers whose knowledge was classified as
compatible-connected were observed reasoning in this way. Teachers whose knowledge was classified as
incompatible-connected could be expected to be less likely to integrate their knowledge to support their
reasoning in sound forms because of the inclusion of incompatible knowledge elements in their knowledge structure. It is of note that Ruby, Harrison, and Michaela were observed to have connections between knowledge element types in their knowledge structure that supported reasoning in sound forms, despite observed connections with several incompatible knowledge elements in their overall knowledge structures.
Discussion
Knowledge Structures and Reasoning
A major finding of this study is that middle and secondary teachers‘ knowledge structures could be described as being in three categories—compatible-connected, incompatible-connected, and incompatible-disconnected. Looking across these categories, seven of the nine teachers were found to have highly interconnected knowledge structures that established connections among the knowledge types of center and spread, with six of the seven teachers drawing connections across all three knowledge element types (center, spread, shape). Despite six of the nine teachers exhibiting multiple incompatible knowledge elements integrated into their knowledge structures, four were simultaneously observed to draw at least one connection between compatible elements of center and spread. Conversely, although there was evidence of teachers‘ knowledge structures being highly interconnected, teachers struggled to integrate this knowledge.
This finding is consistent with that of Groth and Bergner (2006), who found that very few elementary preservice teachers were able to reason at the highest level with measures of center—which required an understanding of when different types of center were more useful than others. In this study, many teachers were observed making incompatible generalizations from the connections they drew between knowledge elements of center. For instance, on several occasions, across multiple tasks, Ruby insisted that the mean was not an appropriate measure of center because it was sensitive to outliers and admitted that the median was her preferred measure of center as a result. Thus, she appears to have constructed a belief that the median is always a better measure of center because it is not influenced by outliers—despite the fact that outliers should not necessarily be ignored. Conversely, Amalia, Ellie, and Michaela indicated that they believed that the mean was always a better measure of center because it took the magnitude of the values into account. For instance, Amalia goes so far as to call the mean the ―true center‖ (Jumping Distances, Lines 18, 57). These teachers may appear to be at the highest level of Groth and Bergner‘s framework because they had developed an understanding of when one measure of center may be better than another, and yet they ultimately did not fully comprehend when each
measure of center was preferable.
finding appears to align with Silva and Coutihno‘s (2008), the present study was able to provide a deeper inspection of the extent of each teachers‘ conceptions through the carefully constructed interview protocol, while Silva and Coutihno were not afforded this luxury in their study that involved a group of teachers in a professional learning course context. This also appears to relate to Torok and Watson‘s (Torok & Watson, 2000) findings with students across grades 4–10 in Tasmania. Moreover, in our study, most teachers relied on the range as a measure of spread, thus not relating it to a measure of center. This may be evidence that such teachers‘ reasoning would be characterized within the lower levels of reasoning within Noll and Shaughnessy‘s (2012) framework.
Considering teachers‘ knowledge of shape, Ellie and Amalia were observed relating that symmetric distributions have less variability than skewed distributions. However, it is of note that teachers were not explicitly asked to compare such situations in this study, so it could be more widespread than it appears, as found by Doerr and Jacobs (2011), whose study mostly involved preservice teachers. Another major contribution of this study to the field is its description of the possible connections between teachers‘ knowledge structures and teachers‘ statistical reasoning. In this study, seven of the nine teachers offered more sound forms of reasoning than they
did unsound forms of reasoning. It is of note that many of the items did not require teachers to draw on multiple
knowledge elements simultaneously in order to respond. However, even when granted an opportunity for doing so, the majority of the time, teachers in this study tended to not only draw on a single knowledge element, but they tended to focus only on measures of center unless explicitly prompted otherwise. This finding echoes those of Huey (2011), with preservice mathematics teachers, and Watson (2003), with students across grades K–12, in that measures of center were the main focus for reasoning from.
Implications for Teacher Education and Future Research
Results of this study have several implications for teacher education. In particular, we focus here on tasks that encourage integrating knowledge elements within and between knowledge element types, as well as providing teachers opportunities to weigh the evidence of the reasoning included in their arguments. Some of the teachers in this study had one-sided perspectives, such as that the mean was always better or that the median was always better. In these cases, teachers tended to view outliers dichotomously as either always or never ignorable. Therefore, teachers need to be exposed to situations in which outliers should and should not be disregarded in order to develop a more nuanced understanding that will lead them away from over generalizations that may result in inadequate supports to develop compatible conceptions of measures of center. More broadly, teachers need opportunities to develop a fuller understanding of how different measures of center are related to one another and when each is more useful than the others.
In this study, it was common that teachers focused on range and sub-ranges, rather than considering spread as a measure fromcenter. Consequently, they were not considering the center in relation to the spread. Therefore, it becomes difficult for teachers who lack this reasoning to respond to students who do reason in such ways, and can result in inadvertently persuading students away from more complex ways of reasoning. Teachers should be provided opportunities to informally explore the connections between spread and center to promote development of more robust conceptions.
In addition to tasks that are designed to provide teachers opportunities to consider multiple knowledge elements and knowledge element types simultaneously, teachers need opportunities to weigh the evidence they draw on when engaging in statistical reasoning. For instance, in this study, all teachers engaged in both sound and
unsound forms of reasoning—many times on the same task item. As a result of the interview protocol, teachers
were confronted with different ways of reasoning—either directly by the interviewer or from responding with different ways of reasoning themselves. This presented the opportunity to weigh the evidence to support the claims they had made. In the process of weighing the evidence, teachers had opportunities to reconstruct their arguments, thereby strengthening them, while also evaluating the quality of their arguments. Therefore, teacher professional learning programs focused on statistics should provide opportunities for teachers to both construct
and respond to multiple arguments and explore their validity. It is of note that although teachers benefited from
This study provided multiple points of evidence to support the existence of connections that were observed between knowledge elements of teachers‘ knowledge structures. However, more research is needed to ascertain
the strength of such relationships. Such investigations might aid in explaining differences in teachers‘
knowledge structures that may appear to be similar but whose reasoning indicates salient differences in how that knowledge is applied. Moreover, teachers‘ knowledge structures need to be examined as they develop—similar to Groth and Bergner (2013). A benefit of such a design would be that the formation of incompatible elements could be explained, and this could lead to the development of interventions to foster the development of
compatible constructions of knowledge elements and the connections between them—thereby providing more
adequate support for more complex forms of reasoning. Ultimately, such research could inform a more purposeful design of professional development programs recommended by The Statistical Education of
Teachers report (Franklin et al., 2015) and in two chapters of the International Handbook of Research in
Statistics Education (Ben-Zvi, Gravemeijer, & Ainley, 2018, Chapter 16; Ponte & Noll, 2018, Chapter 14).
Concluding Thoughts
This study contributes to the growing need to understand middle and secondary teachers‘ knowledge structures for measures of center, spread and shape, and how they may support statistical reasoning (Langrall et al., 2017). Moreover, these concepts, and their inherent interconnections, are vital to higher levels of reasoning, and also appear to be difficult for teachers and students to integrate (Franklin et al., 2007; Groth & Bergner, 2006; Silva & Coutinho, 2008). More importantly, in order to support development of the ―inner logic of statistical inference‖, knowledge of center, spread and shape must be integrated into a ―sophisticated network of ideas‖ (Saldanha & Thompson, 2014, p. 28). Therefore, this study offers insights into how teachers may have conceptualized and connected compatible and incompatible knowledge elements for center, spread, and shape and how such knowledge structures may impact their reasoning.
References
Alkas Ulusoy, C. & Kayhan Altay, M. (2017). Analyzing the statistical reasoning levels of pre-service elementary school teachers in the context of a model eliciting activity. International Journal of Research
in Education and Science (IJRES), 3(1), 20-30.
Australian Curriculum Assessment and Reporting Authority. (2014). Autstralian Curriculum. Retrieved from http://www.australiancurriculum.edu.au/mathematics/curriculum/f-10?layout=1
Bakker, A., & Gravemeijer, K. P. E. (2004). Learning to reason about distribution. In D. Ben-Zvi & J. Garfield (Eds.), The challenge of developing statistical literacy, reasoning and thinking (pp. 147–168). Springer Science + Business, Inc.
Banilower, E. R., Smith, P. S., Malzahn, K. A., Plumley, C. L., Gordon, E. M., & Hayes, M. L. (2018). Report
of the 2018 NSSME +. Chapel Hill, NC: Horizon Research, Inc. Retrieved from
http://horizon-research.com/NSSME/
Banilower, E. R., Smith, P. S., Weiss, I. R., Malzahn, K. A., Campbell, K. M., & Weis, A. M. (2013). Report of
the 2012 national survey of science and mathematics education. Chapel Hill, NC: Horizon Research, Inc.
Batanero, C., Burrill, G., & Reading, C. (Eds.). (2011). Teaching statistics in school mathematics–Challenges
for teaching and teacher education. A Joint ICMI/IASE Study. The 18th ICMI Study. New York, NY:
Springer Science + Business Media.
Ben-Zvi, D., Gravemeijer, K., & Ainley, J. (2018). Design of statistics learning environments. In D. Ben-Zvi, K. Makar, & J. Garfield (Eds.), International Handbook of Research in Statistics Education (pp. 473–502). Cham, Switzerland: Springer International Publishing. https://doi.org/10.1007/978-3-319-66195-7_16 Biehler, R., Frischemeier, D., Reading, C., & Shaughnessy, J. M. (2018). Reasoning about data. In D. Ben-Zvi,
K. Makar, & J. Garfield (Eds.), International Handbook of Research in Statistics Education (pp. 139– 192). Cham, Switzerland: Springer International Publishing.
Biggs, J. B., & Collis, K. F. (1982). Evaluating the quality of learning: The SOLO taxonomy. New York, NY: Academic.
Booker, G. (1996). Constructing mathematical conventions formed by the abstraction and generalization of earlier ideas: The development of initial fraction ideas. In L. P. Steffe, P. Nesher, P. Cobb, G. A. Goldin, & B. Greer (Eds.), Theories of Mathematical Learning (pp. 381–395). New York, NY: Routledge. Castro Sotos, A. E., Vanhoof, S., Noortgate, W. Van den, & Onghena, P. (2009). How confident are students in
their misconceptions about hypothesis tests? Journal of Statistics Education, 17(2).
Educational Research Review, 2(2), 98–113. https://doi.org/10.1016/j.edurev.2007.04.001
delMas, R., Garfield, J., Ooms, A., & Chance, B. (2007). Assessing students‘ conceptual understanding after a first course in statistics. Statistics Education Research Journal, 6(2), 28–58.
delMas, R., & Liu, Y. (2005). Exploring students‘ conceptions of the standard deviation. Statistics Education
Research Journal, 4(1), 55–82. Retrieved from
http://citeseerx.ist.psu.edu/viewdoc/download?doi=10.1.1.219.7563&rep=rep1&type=pdf
Doerr, H. M., & Jacob, B. (2011). Investigating secondary teachers‘ statistical understandings. In M. Pytlak, T. Rowland, & E. Swoboda (Eds.), Proceedings of the Seventh Congress of the European Society for
Research in Mathematics Education (pp. 776–786). University of Rzeszów, Poland. Retrieved from
https://www.researchgate.net/profile/Maria_Meletiou-Mavrotheris/publication/283347725_Stochastic_thinking_Proceedings_of_Working_Group_5_at_CERM E_7/links/5635ada008aebc003fff737c.pdf#page=80
Ekol, G. (2015). Exploring foundation concepts in introductory statistics using dynamic data points.
International Journal of Education in Mathematics, Science and Technology, 3(3), 230–241.
England Department of Education. (2014). National curriculum in England: mathematics programmes of study. Retrieved from https://www.gov.uk/government/publications/national-curriculum-in-england-mathematics-programmes-of-study/national-curriculum-in-england-mathematics-programmes-of-study Falk, R., & Greenbaum, C. W. (1995). Significance tests die hard: The amazing persistence of a probabilistic
misconception. Theory & Psychology, 5(1), 75–98. https://doi.org/10.1177/0959354395051004
Franklin, C., Bargagliotti, A. E., Case, C. A., Kader, G., Scheaffer, R., & Spangler, D. A. (2015). The statistical
education of teachers. Retrieved from http://www.amstat.org/education/SET/SET.pdf
Franklin, C., Kader, G., Mewborn, D., Moreno, J., Peck, R., Perry, M., & Scheaffer, R. (2007). Guidelines for
assessment and instruction in statistics education (GAISE) report: A pre-k-12 curriculum framework.
American Statistical Association. Alexandria, VA. Retrieved from
http://www.amstat.org/Education/gaise/GAISEPreK-12_Full.pdf
Gfeller, M. K., Niess, M. L., & Lederman, N. G. (1999). Preservice teachers‘ use of multiple representations in solving arithmetic mean problems. School Science and Mathematics, 99(5), 250–257. https://doi.org/10.1111/j.1949-8594.1999.tb17483.x
Ginsburg, H. (1981). The clinical interview in psychological research on mathematical thinking: Aims, rationales, techniques. For the Learning of Mathematics, 1(3), 4–11. Retrieved from http://www.jstor.org/stable/40247721
Goldin, G. A. (1997). Chapter 4: Observing mathematical problem solving through task-based interviews.
Journal for Research in Mathematics Education. Monograph, 9(Qualitative Research Methods in
Mathematics Education), 40-62+164-177.
Groth, R. E., & Bergner, J. A. (2006). Preservice elementary teachers‘ conceptual and procedural knowledge of mean, median, and mode. Mathematical Thinking and Learning, 8(1), 37–63. Retrieved from http://www.tandfonline.com/doi/abs/10.1207/s15327833mtl0801_3
Groth, R. E., & Bergner, J. A. (2013). Mapping the structure of knowledge for teaching nominal categorical data analysis. Educational Studies in Mathematics, 83(2), 247–265. https://doi.org/10.1007/s10649-012-9452-4
Groth, R. E., & Meletiou-Mavrotheris, M. (2018). Research on statistics teachers‘ cognitive and affective characteristics. In D. Ben-Zvi, K. Makar, & J. Garfield (Eds.), International Handbook of Research in
Education (pp. 327–355). Cham, Switzerland: Springer International Publishing.
https://doi.org/10.1007/978-3-319-66195-7
Haller, H., & Krauss, S. (2002). Misinterpretations of significance: A problem students share with their teachers? Methods of Psychological Research Online, 7(1), 1–20.
Herscovics, N. (1996). The construction of conceptual schemes in mathematics. In L. P. Steffe, P. Nesher, P. Cobb, G. A. Goldin, & B. Greer (Eds.), Theories of Mathematical Learning (pp. 351–379). New York, NY: Routledge.
Hohensee, C., & Jansen, A. (2017). Elementary preservice teachers‘ transitional conceptions of partitive division with proper-fraction divisors. Mathematical Thinking and Learning, 19(4), 210–236. https://doi.org/10.1080/10986065.2017.1346452
Huey, M. E. (2011). Characterizing middle and secondary preservice teachers’ change in inferential reasoning.
University of Missouri, Columbia, MO. Retrieved from
http://search.proquest.com/docview/1262397961/abstract/AB7A075587244E0FPQ/1?accountid=14576 Huey, M. E., & Jackson, C. D. (2015). A framework for analyzing informal inferential reasoning tasks in middle
school textbooks. In T. G. Bartell, K. N. Bieda, R. T. Putnam, K. Bradfield, & H. Dominguez (Eds.),
Proceedings of the 37th annual meeting of the North American Chapter of the International Group for
the Psychology of Mathematics Education (pp. 431–438). East Lansing, MI: Michigan State University.