O R I G I N A L R E S E A R C H
Open Access
Multi-objective optimization strategy for
distribution network considering
V2G-enabled electric vehicles in building
integrated energy system
Zhao Huang
1,2*, Baling Fang
2and Jin Deng
1Abstract
Based on the large-scale penetration of electric vehicles (EV) into the building cluster, a multi-objective optimal strategy considering the coordinated dispatch of EV is proposed, for improving the safe and economical operation problems of distribution network. The system power loss and node voltage excursion can be effectively reduced, by taking measures of time-of-use (TOU) price mechanism bonded with the reactive compensation of energy storage devices. Firstly, the coordinate charging/discharging load model for EV has been established, to obtain a narrowed gap between load peak and valley. Next, a multi-objective optimization model of the distribution grid is also defined, and the active power loss and node voltage fluctuation are chosen to be the objective function. For improving the efficiency of optimization process, an advanced genetic algorithm associated with elite preservation policy is used. Finally, reactive compensation capacity supplied by capacitor banks is dynamically determined according to the varying building loads. The proposed strategy is demonstrated on the IEEE 33-node test case, and the simulation results show that the power supply pressure can be obviously relieved by introducing the
coordinated charging/discharging behavior of EV; in the meantime, via reasonable planning of the compensation capacitor, the remarkably lower active power loss and voltage excursion can be realized, ensuring the safe and economical operation of the distribution system.
Keywords:Distribution network, Electric vehicles, Multi-objective optimization, Coordinated dispatch, Advanced genetic algorithm
1 Introduction
With the continuous development of energy industry, the utilization of renewable energy as an alternative for fossil fuels has become a common sense of some coun-tries [1]. Recently, the integrated energy system (IES) has been greatly supported by the Chinese government and turned into a research hotspot, since it benefits the inte-gration of renewable energy, and the coordinated devel-opment of energy system. As the terminal node of IES, the building integrated energy system (BIES) provides customers with flexible cascades of different local energy resources, not only facilitating the environmentally
friendly, but also reducing the cost for consumers simul-taneously [2, 3]. The consumers in the building can be classified as two types: stationed institutions, and electric vehicles (EV) owners. EV is an important part for the fu-ture power system, for the more and more intense coup-ling with BIES. However, with the large-scale penetration of EV, operation of the distribution network is enormously impacted by these random charging loads, since problems such as harmonic pollution, three-phase voltage imbalance, and aging of the transformers are in-duced. Especially, the enlarged load peak-valley gap puts forward higher requirements for the power system. The node voltage excursion as well as the active power loss is usually regarded as a crucial indicator reflecting the op-eration state of the distribution system. The peak load arisen from the aggregated charging behavior of EV
© The Author(s). 2020Open AccessThis article is distributed under the terms of the Creative Commons Attribution 4.0 International License (http://creativecommons.org/licenses/by/4.0/), which permits unrestricted use, distribution, and reproduction in any medium, provided you give appropriate credit to the original author(s) and the source, provide a link to the Creative Commons license, and indicate if changes were made.
* Correspondence:[email protected] 1Hunan college of information, Changsha, China
2College of electric and information engineering, Hunan university of
owner probably leads to low voltage even collapse, con-currently increased system loss. Hence, guiding mea-sures for coordinated regulation should be taken, to minimize the negative influences of EV while satisfying the travel demands of customers.
As part of a vehicle to grid (V2G) system [4], EV also can be regarded as controllable power resource, to realize the bidirectional power flow between the building and distribution system. Additionally, time-of-use (TOU) price mechanism is an effective method for the integrated demand side management, which creates an economic incentive for users to adjust their charging/ discharging time. For example, residential customers plug in their vehicles during off-peak hours. This helps to reduce the potential of distribution transformer over-loads, as well as stabilize the load fluctuation by valley filling and peak shaving, thus balance the demand and supply.
A voltage regulation model is proposed after regula-tion of EV devices in [5], to reduce the voltage fluctu-ation of the power system, while the active loss has not been included in the optimization objective. Contras-tively, the optimized model for distribution system re-configuration is analyzed in [6], with the only optimization function of power loss. Researches about energy management and optimized operation of EV based on microgrid are also explored in many papers [7, 8]. Reference [9] similarly establishes a coordinated scheduling model of EV in response to TOU price. The charging/discharging plan is generated with fixed peak and valley periods, which maybe not suitable for the time-varying loads.
In this paper, the standard IEEE 33-node system is taken as an example, and measures of TOU price com-bined with the reactive power compensation devices are adopted. We select the tradeoff between power loss and node voltage excursion as the optimal objective. Under the designated simulation circumstance, the optimal compensation capacity is dynamically solved by an im-proved genetic algorithm. Through the peak shaving and valley filling effects on the building load curve of coordi-nated regulation of EV, the positive guiding role of TOU price can be directly manifested. EV as controllable load inside BIES can participate in energy management ef-fectively. Besides, by statistical results comparison of power loss and relative voltage excursion, the feasibility of reactive power compensation approach is also verified.
2 Modeling of coordinated dispatch for EV
In the presence of large-scale penetration of EV into BIES, the load pressure, operating cost, and reliance on distribution grid will be increased. Coordinated dispatch facilitates to boost the utilization of EV and improve the
demand side flexibility. Due to the intrinsic advantages such as operational safety and energy density, the lith-ium ion batteries of 25 kWh are selected as the power battery for EV [10–12], and the charging power main-tains at 2.5 kW for a single vehicle. Concurrently, the safety threshold of the state of charge (SOC) is set to be [10%, 90%], hence it can be inferred that the charging time could not be more than 8 h. As the traffic infra-structure, supposing that power consumption for EV is 15 kWh per 100 km [13], and the theoretical endurance mileage can be calculated as 133 km.
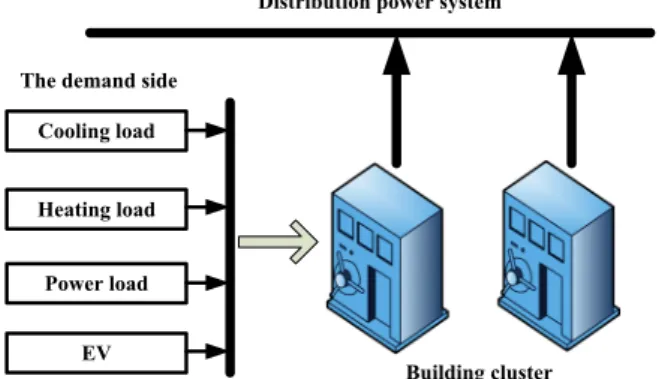
2.1 Structure of the BIES
BIES is mostly configured as an energy cascade utilization system which enables free power flow among different energy types. The building cluster provides power to residents through external distribu-tion power grid. As illustrated in Fig. 1, the demand side is comprised of three kinds of loads (cooling load, heating load, power load) and EV connections. EV devices are not considered as traditional loads since they can also act as a power supplier. For the V2G application, EV charging devices not only pro-vide customers with charging services, but also allow the EV owners to sell excessive electricity to the power system.
2.2 Aggregated charging of EV
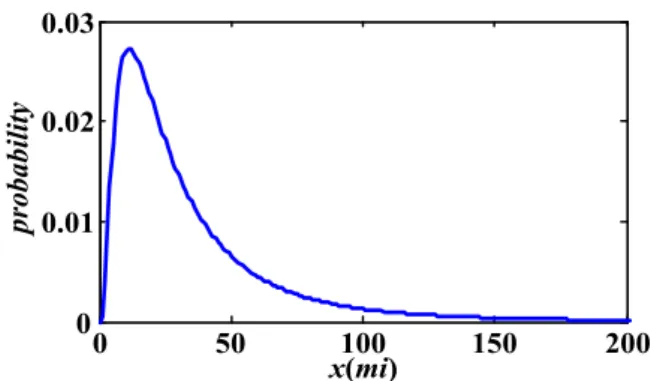
Aggregated charging of EV could be explained as char-ging behavior only according to customers’travel needs or living habits, without any guiding principle. As the EV travel follows a probability density distribution repre-sented in Fig.2:
fdð Þ ¼x
1
xσd
ffiffiffiffiffiffi
2π
p exp½−ð lnx−μdÞ 2
2σ2
d
ð1Þ
where μd= 3.20, σd= 0.88, x denotes the daily
mileage of EV (mostly lies between 32 and 97 km), so a charged 25 kWh battery can provide sufficient
energy to meet daily driving requirements. Monte Carlo random sampling can be used to predict the charging power demand for a single EV during a day. In this paper, 24 h in a day is divided into 96 periods, with sampling the state of EV per 15 min. The charging expectation for a single vehicle is shown in Fig. 3.
2.3 Coordinated dispatch of EV
The three-stage TOU price is designated to establish a positive guidance for the charging/discharging process of the EV owners. Depending on the load change of the power grid, the corresponding electri-city price level of each period is confirmed, to achieve the peak shaving and valley filling. In the modeling process of TOU price, minimizing the peak valley dif-ference of the total loads in building cluster is chosen as the optimization objective, and the application background is specified as follows:
(1) the battery power meets the driving demand of the EV owners, and there is no other power
consumption behavior beside the normal travel; (2) user charge and discharge without exceeding the
safe range of the SOC, and 80% of the total owners participate in the coordinated dispatch (λ= 0.8);
(3)pv,ppandpfare defined as the electricity price of valley, peak and normal period respectively, then the price modelp(t) can be described as:
p tð Þ ¼ (p
v t1≤t≤t2
pp t3≤t≤t4
pf else
ð2Þ
wheret1-t4represents the start and end moment of val-ley period, as well as peak period, respectively;
(4) before charging/discharging, the user can query the current battery status of the EV and independently select the charging/discharging time. The parameters tsc, tc, tsd, td are defined as follows:
tsc,tsd-the start moment for users to charge/discharge; .
tc,td-duration of charging/discharge process.
Users participating in the coordinated dispatch can se-lecttscortsdaccording to Eqs. (3) and (4):
tsc¼
(
t1þrandcðt2−tcÞ 0≤tc≤t2−t1
t1 else ð
3Þ
tsd¼
(
t3þranddðt4−tdÞ 0≤td≤t4−t3
t3 else ð4Þ
where randc and randd are random numbers in [0,
1]. It can be known that for the TOU price model, parameters t1-t4 determine the peak and valley areas, and consequent daily load characteristics. Hence, they are key factors for optimal control of the distribution network.
3 Modeling of distribution grid and var compensator
The guiding ideology for the distribution network optimization can be concluded as follows: on the prem-ise that the parameters such as branches and loads are known, and various constraints are satisfied, dynamically adjust the output of the pre-set capacitor bank to optimize the comprehensive indices of active power loss and voltage excursion. Finally, the economical and safe operation of the distribution power system can be achieved.
3.1 Objective function
The optimization objective function comprises two im-portant issues: active power loss and voltage excursion of the distribution system.
Fig. 2Probability of driving distance during 1 day
3.1.1 Active power loss
The first objective is the minimization of the total active power loss of the distribution network, which can be mathematically modeled as Eq. (5):
minf1¼
Xn
i¼1
Xn
j¼1
PLij
Xn
i¼1
Xn
j¼1
P0Lij
ð5Þ
where P’Lij、PLij respectively denote the active power
loss of the branch (i, j) before and after
optimization.
3.1.2 Voltage excursion
Node voltage is an important indicator reflecting the security and service quality. To avoid all the voltages moving toward their maximum limits after optimization, the deviation of voltage from the rated value is chosen as an objective function, that is:
minf2¼
Xn
j¼1
Uj−UjN
Xn
j¼1
U0j−UjN
ð6Þ
where U’j、Uj、UjN respectively represent the actual
voltage of the node j before and after optimization, and the rated voltage of the nodej.
Combining the above two indicators, the objective function can be expressed as:
minF¼λ1
Xn
i¼1
Xn
j¼1
PLij
Xn
i¼1
Xn
j¼1
P0Lij
þλ2
Xn
j¼1
Uj−UjN
Xn
j¼1
U0j−UjN
þμXn
j¼1
ΔUj Ujmax−Ujmin
2
ð7Þ
where λ1 and λ2 are the weight coefficients for the
two optimization objectives (λ1=λ2= 0.5). The penalty function is used to deal with the node voltage
out-of-limit problem,Ujmin and Ujmax are the minimum and
maximum voltage values of the node j; while μ
indi-cates the penalty factor (μ= 1000), and ΔUj is defined as (8):
ΔUj¼
(U
j−Ujmax Uj>Ujmax
0 Ujmin≤Uj≤Ujmax
Ujmin−Uj Uj<Ujmin
ð8Þ
3.2 Constraints
The basic constraints of distribution power system optimization mainly include equality constraints (power flow) and inequality constraints as follows:
A. SOC of lithium battery constraint:
SOCmin≤SOC≤SOCmax ð9Þ
where SOCmin and SOCmax are the safety threshold
values of SOC, which are 10% and 90% respectively.
B. compensation capacity constraint:
0≤Cj¼kjCjN≤Cj max ð10Þ
where Cjand Cjmax illustrate the output capacity of the capacitor bank installed on the nodej, and its maximum capacity respectively;CjN is the capacity of a single cap-acitor included in the capcap-acitor bank;kjis the number of single capacitors on the nodej.
3.3 Algorithm
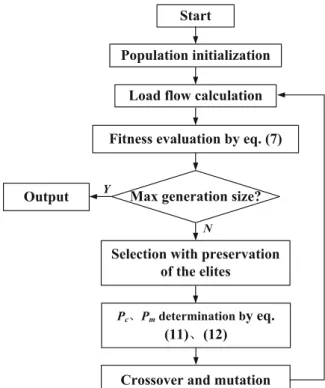
The purpose of multi-objective optimization is to deter-mine a set of Pareto solutions, which compromise each optimization objective. Herein, a novel genetic algorithm based on elite preservation policy is introduced to solve the optimization mathematical model established in 3.1 and 3.2. Principally, the crossover probabilityPcand mu-tation probabilityPmare improved as follows [14]:
Pc¼
(k
1ðFmax−F0Þ
Fmax−Favg F
0≥ Favg
k2 F0< Favg
ð11Þ
Pm¼
(k
3ðFmax−F00Þ
Fmax−Favg F
00≥ Favg
k4 F00< Favg
ð12Þ
where k1-k4 are constant, which are set to be
0.5、0.9、0.02 and 0.05; while Favg、Fmax、F′ and
F″ respectively demonstrate the average and
max-imum fitness value of individuals, the better fitness of the two crossover individuals, and the fitness of
the mutation individuals. By improving Pc and Pm, it
to the next generation, while rest individuals are randomly selected by the roulette wheel method and produced according to the crossover and mutation operations. The flowchart of the algorithm is shown in Fig. 4.
4 Results and discussion
The standard IEEE 33-node power distribution sys-tem shown in Fig. 5 is tested for verification, and its load information is detailed in reference [15]. The basic parameters of the network for the per-unit system are 10 MVA and 12.66 kV. It is assumed that the building loads are evenly distrib-uted on these four nodes: 3, 10, 18, 32. Consider-ing the time-varyConsider-ing characteristics of the daily loads, a series of building load data including cool-ing load, heatcool-ing load and power load, whereas without EV integration, for a certain day are col-lected in Fig. 6 (original building loads). Distrib-uted generator DG1 and DG2 are respectively installed on the node 2 and 5, with the output of 1 + j0.484 MVA. The capacitor banks for compen-sation are installed on the node 17 and 32, with the maximum capacity of 1 Mvar. EV scale inside the buildings connected to the distribution grid is 500, with the charge/ discharge power of 2.5 kW. Furthermore, the convergence accuracy of power flow calculation is 10−4.
Based on the building load curve in Fig. 6, the op-timized result under the coordinated dispatch of EV is obtained, as depicted in Fig. 7. For comparison, the aggregated EV charging result is also exhibited. It can be observed that the load area between 17: 00–20:00 is intensified by the aggregated EV char-ging behavior, which puts forward higher require-ments for the power supply. The attempt of coordinated charging/discharging regulation could realize the function of load peak shaving and valley filling, circumventing above problem. By introducing the TOU price, which makes full use of the schedul-ability of V2G, the load curve can be smoothed, while guaranteeing the charging demand of EV owners.
Concretely, the distribution system is most prone to black out at about 19:00 for the original build-ing load curve, with the peak load of 3715 kW. However, this would be further increased to 4167 kW under the access of aggregated EV charging. After coordinated regulation, the peak load can be optimized to 3608 kW (decreased by 13.41%). Ac-cordingly, voltages for all of the nodes are also cal-culated, as demonstrated in Fig. 8. Supposing that a voltage dip lower than 0.95 p.u. or a voltage higher than 1.05 p.u. is deemed as voltage out-of-limit, then it is discovered that under the EV aggregated charging, the system voltage drops ser-iously. Only 11 node voltages are better than the
Fig. 4Flowchart of the developed genetic algorithm
Fig. 5IEEE 33-node system
lower bound, and the worst one of 0.834 p.u. oc-curs on the node 32. In contrast, the system volt-age is overall heightened on coordinated regulation mode, and the voltage of the node 32 is raised up to 0.846 p.u., close to its value when the distribu-tion system operates with original building loads (0.844 p.u.).
Moreover, through the power flow analysis, Table 1 illustrates the statistical results of the two indices for the system under different EV regulation modes. It’s obvious that the integration of building loads increases the power supply burden of distri-bution system, since the problems such as power consumption and voltage quality are more serious. By the introduction of TOU mechanism, the coor-dinated management of flexible loads inside the buildings not only boosts the utilization of EV, but conducive to the economical and safe operation of the grid, consistent with the concept of energy con-servation and emission reduction of modern power system.
DG1 and DG2 separately connected to the node 2 and 5 can further support the system voltage. After the DG input, 12 nodes exceed the voltage lower limit, the smallest value is still on the node 32,
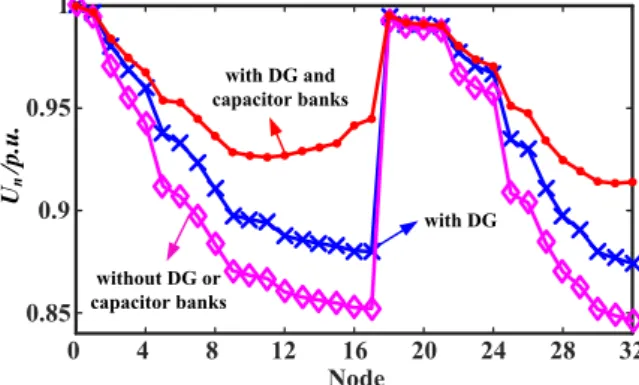
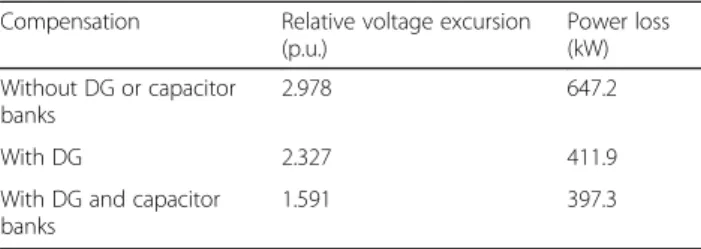
which is raised to 0.874 p.u. The relative voltage excursion of each node totally adds up to 2.327 p.u., decreased by 22.92% compared to 3.019 p.u. of the original building loads. Finally, by employing the improved genetic algorithm analyzed in 3.3, the optimal compensation capacities of the capacitor banks on the node 17 and 32 are solved as 0.95 and 0.81 Mvar respectively. The risk of voltage out-of-limit is effectively reduced after reactive compen-sation, which can be testified by the node voltage of 32 (0.914 p.u.). Based on the coordinated dispatch of EV devices, Fig. 9 declares the node voltages of the distribution system before and after compensation, emphasizing an excellent effect of voltage fluctuation suppression. After reactive com-pensation by DG and capacitor banks, the total voltage excursion is optimized to 1.591 p.u. (de-creased by 47.3% compared to that of the original building loads).
In addition, as shown in Table 2, when DG and capacitor are not installed, the active power loss of the system is 647.2 kW; which is reduced to 411.9 kW when DG is put into operation but capacitor compensation is not available. After both of the DG and capacitor banks are put into use, the system loss is further decreased to 397.3 kW. Compared with power consumption of 666.9 kW for the ori-ginal building loads, the reduction achieves 2.95%,
Fig. 8Voltage curves under two operation modes of EV
Fig. 9Comparison results of node voltages before and after reactive compensation
Fig. 7Load curves under two regulation modes of EV
Table 1Indices under different EV regulation modes
Regulation mode Relative voltage excursion
(p.u.)
Power loss (kW)
Without building loads 1.701 202.6
With original building loads
3.019 666.9
Aggregated charging of EV
3.199 755.2
Coordinated dispatch of EV
38.2% and 40.4% respectively. Therefore, the rea-sonable dispatch of EV weakens the burden of the distribution network for power supply, concurrently the multi-objective optimization approach also en-sures the significant improvements of system power loss and node voltage excursion, proving that the proposed strategy in this paper could obtain out-standing performance.
It’s worth to note that the response degree of the EV users λ also has an impact on the optimal ef-fects for the distribution network. For the demand side, participating in regulation favors the economic interest of customers. For the network, a higher λ definitely corresponds to a weaker difference be-tween load peak and valley. This is conducive to improving both the initiative of users and security of the distribution system.
5 Conclusions
In dependence on the basic principle of optimal control for distribution network, considering the popularization of EV devices in BIES, an optimization strategy is put for-ward in this paper. The strategy combines the pricing mechanism in the buildings and the dynamic compensa-tion of the energy storage device, which is designed to bal-ance the optimization between system power loss and node voltage fluctuation. By simulation analysis and com-parison on the MATLAB, the overall ability of the optimization strategy is illustrated. Firstly, BIES provides access for EV, enhancing more space for schedulable re-source capacity. Next, introduction of EV coordinated dispatch by the TOU price mechanism promotes their ini-tiative and utilization, and alleviates the power supply de-mand of the distribution network by load peak shaving and valley filling. Finally, under the condition of basic con-straints, the optimal solution of compensation plan by capacitor banks can be determined through an improved genetic algorithm. After scheduled charging/discharging of EV and reactive compensation, the active power loss and risk of node voltage out-of-limit are improved simul-taneously, promoting the economical and safe operation of the distribution network. This optimal strategy can be extended to other cases, and has great significance for the optimal management of power grid.
Abbreviations
BIES:Building integrated energy system; EV: Electric vehicles; IES: Integrated energy system; SOC: State of charge; TOU: Time-of-use; V2G: Vehicle to grid
Authors’contributions
BF performed the literature review and collected the information pertaining to distribution power system optimization. JD provided critical comments and technical guidance for the algorithm. ZH performed the simulation, analyzed the results, and wrote the paper. All authors read and approved the final version of the manuscript.
Author information
Zhao Huang (1985-), female, PHD and Lecturer, Major in the energy storage devices in power system, and distribution grid optimal operation control. Baling Fang (1980-), male, PHD and Lecturer, Major in the power network planning modeling, and power grid data mining research.
Jin Deng (1991-), female, MS and Lecturer, Major in the planning theory application in distribution network.
Funding
This work was supported by Natural Science Foundation of Hunan Province (2017JJ5044).
Availability of data and materials
Not applicable.
Consent for publication
Not applicable.
Competing interests
The authors declare that they have no competing interests.
Received: 31 October 2019 Accepted: 15 January 2020
References
1. Hu, W., Su, C., Chen, Z., et al. (2013). Optimal operation of plug-in electric vehicles in power systems with high wind power penetrations. IEEE Transactions on Sustainable Energy, 4(3), 577–585.
2. Qin, C., Yan, Q., & He, G. (2019). Integrated energy systems planning with electricity, heat and gas using particle swarm optimization.Energy, 188, 116044.
3. Alshahrani, S., Khalid, M., & Almuhaini, M. (2019). Electric vehicles beyond energy storage and modern power networks: challenges and applications. IEEE Access, 7, 99031–99064.
4. Wang, Z., & Wang, S. (2013). Grid power peak shaving and valley filling using vehicle-to-grid systems. IEEE Transactions on Power Delivery, 28(3), 1822–1829.
5. Guo, Y., Xinhui, Z., Ke, P., et al. (2019). Voltage regulation strategy of distribution network considering the joint action of electric vehicle and photovoltaic power supply.Electrical Measurement & Instrumentation, 56(7), 75–83.
6. Guang, C., Pan, D., Hao, Z., et al. (2013). Distribution system reconfiguration considering distributed generators and plug-in electric vehicles. Power System Technology, 37(1), 82–88.
7. Tan, L., Caihong, Z., Ziqi, C., et al. (2015). Economical dispatch for microgrids of electric vehicles and distributed power.Power System and Clean Energy, 31(4), 100–105.
8. Zhang, M., & Chen, J. (2014). The energy management and optimized operation of electric vehicles based on microgrid. IEEE Transactions on Power Delivery, 29(3), 1427–1435.
9. Dajun, W., Chenghui, Z., Bo, S., et al. (2014). A time-of-use price based multi-objective optimal dispatching for charging and discharging of electric vehicles.Power System Technology, 38(11), 2972–2977.
10. Ziemann, S., Müller, D. B., Schebek, L., et al. (2018). Modeling the potential impact of lithium recycling from EV batteries on lithium demand: A dynamic MFA approach.Resources, Conservation and Recycling, 133, 76–85. 11. Zhang, P., Qian, K., Zhou, C., et al. (2012). A methodology for optimization of
power systems demand due to electric vehicle charging load. IEEE Transactions on Power Systems, 27(3), 1628–1636.
Table 2Indices before and after compensation
Compensation Relative voltage excursion
(p.u.)
Power loss (kW)
Without DG or capacitor banks
2.978 647.2
With DG 2.327 411.9
With DG and capacitor banks
12. Nykvist, B., & Nilsson, M. (2015). Rapidly falling costs of battery packs for electric vehicles.Nature Climate Change, 5(4), 329.
13. Liang, Z., Zheng, Y., Donghan, F., et al. (2014). Two-stage optimization model based coordinated charging for EV charging station.Power System Technology, 38(4), 967–973.
14. Ruiz-Rodriguez, F. J., Hernández, J. C., & Jurado, F. (2018). Voltage behaviour in radial distribution systems under the uncertainties of photovoltaic systems and electric vehicle charging loads.International Transactions on Electrical Energy Systems, 28(2), e2490.