Denitrification potential of the eastern oyster
microbiome using a 16S rRNA gene based
metabolic inference approach
Ann Arfken1☯*, Bongkeun Song1☯, Jeff S. Bowman2, Michael Piehler3
1 Department of Biological Sciences, Virginia Institute of Marine Science, Gloucester Point, Virginia, United
States of America, 2 Integrative Oceanography Division, Scripps Institution of Oceanography, University of California, San Diego, California, United States of America, 3 Institute of Marine Sciences, University of North Carolina at Chapel Hill, Morehead City, North Carolina, United States of America
☯These authors contributed equally to this work.
Abstract
The eastern oyster (Crassostrea virginica) is a foundation species providing significant eco-system services. However, the roles of oyster microbiomes have not been integrated into any of the services, particularly nitrogen removal through denitrification. We investigated the composition and denitrification potential of oyster microbiomes with an approach that com-bined 16S rRNA gene analysis, metabolic inference, qPCR of the nitrous oxide reductase gene (nosZ), and N2flux measurements. Microbiomes of the oyster digestive gland, the
oys-ter shell, and sediments adjacent to the oysoys-ter reef were examined based on next genera-tion sequencing (NGS) of 16S rRNA gene amplicons. Denitrificagenera-tion potentials of the microbiomes were determined by metabolic inferences using a customized denitrification gene and genome database with the paprica (PAthway PRediction by phylogenetIC plAce-ment) bioinformatics pipeline. Denitrification genes examined included nitrite reductase (nirS and nirK) and nitrous oxide reductase (nosZ), which was further subdivided by geno-type into clade I (nosZI) or clade II (nosZII). Continuous flow through experiments measuring N2fluxes were conducted with the oysters, shells, and sediments to compare denitrification
activities. Paprica properly classified the composition of microbiomes, showing similar clas-sification results from Silva, Greengenes and RDP databases. Microbiomes of the oyster digestive glands and shells were quite different from each other and from the sediments. The relative abundance of denitrifying bacteria inferred by paprica was higher in oysters and shells than in sediments suggesting that oysters act as hotspots for denitrification in the marine environment. Similarly, the inferred nosZI gene abundances were also higher in the oyster and shell microbiomes than in the sediment microbiome. Gene abundances for nosZI were verified with qPCR of nosZI genes, which showed a significant positive correlation (F1,7= 14.7, p = 6.0x10⁻³, R2= 0.68). N2flux rates were significantly higher in the oyster
(364.4±23.5μmol N-N2m-2h-1) and oyster shell (355.3±6.4μmol N-N2m-2h-1) compared
to the sediment (270.5±20.1μmol N-N2m-2h-1). Thus, bacteria carrying nosZI genes were
found to be an important denitrifier, facilitating nitrogen removal in oyster reefs. In addition, this is the first study to validate the use of 16S gene based metabolic inference as a method a1111111111 a1111111111 a1111111111 a1111111111 a1111111111 OPEN ACCESS
Citation: Arfken A, Song B, Bowman JS, Piehler M (2017) Denitrification potential of the eastern oyster microbiome using a 16S rRNA gene based metabolic inference approach. PLoS ONE 12(9): e0185071.https://doi.org/10.1371/journal. pone.0185071
Editor: Xiangzhen Li, Chengdu Institute of Biology, CHINA
Received: May 15, 2017
Accepted: September 6, 2017
Published: September 21, 2017
Copyright:©2017 Arfken et al. This is an open access article distributed under the terms of the
Creative Commons Attribution License, which permits unrestricted use, distribution, and reproduction in any medium, provided the original author and source are credited.
Data Availability Statement: Sequences generated in this study may be downloaded from the NCBI Sequence Read Archive, accession number SRP106715.
Funding: Funding was provided by the National Science Foundation Division of Biological
Oceanography,https://www.nsf.gov/funding/pgm_
for determining microbiome function, such as denitrification, by comparing inference results with qPCR gene quantification and rate measurements.
Introduction
Chesapeake Bay, the largest estuary in the United States, is one of many systems that has expe-rienced the detrimental effects of excess nitrogen (N) and cultural eutrophication, including bottom water hypoxia, reduced fisheries harvests, and loss of submerged aquatic vegetation [1,2]. Over the last several years, restoration of the eastern oyster (Crassostrea virginica) to the Bay has gained momentum as a potential means to enhance N removal and mitigate eutrophi-cation by increasing rates of denitrifieutrophi-cation [3,4]. Denitrification is the microbially-mediated stepwise reduction of nitrate (NO3-) and nitrite (NO2-) to gaseous nitric oxide (NO), nitrous oxide (N2O) and dinitrogen (N2) [5].
The majority of studies addressing denitrification associated with oysters have primarily focused on whether oysters enhance denitrification in sediments within and adjacent to oys-ter reefs [6–9]. Oysters may stimulate denitrification by supplying organic carbon (C) and N in the form of biodeposits to denitrifying communities in sediments [4,10,11]. Ammonium (NH4+) remineralized from oyster biodeposits and excretions can be nitrified to NO3-, which supports denitrification [3,12]. In addition, the oyster itself can provide a microbial habitat for denitrification (oyster denitrification). Live oysters have been shown to have significantly higher rates of denitrification than sediments [13]. Oyster gut organs in particular, may be hotspots for denitrification, as gut organs of several invertebrates including insects, earth-worms, and mussels have shown to exhibit denitrification activity [14–17]. Denitrification in the invertebrate gut is thought to be a result of the anoxic conditions and availability of labile organic carbon provided within the gut environment [15,18]. Oyster shells were also found to have denitrification activity even though the rates were much lower than those measured in live oysters [19]. Shell denitrification may be influenced by factors similar to those impact-ing sedimentary denitrification. Like oyster reef sediments, the shell microbiome is exposed to increased C and N from biodeposits and excretions, which may enhance denitrification. Both the gut and shell microbiomes are likely important contributors to oyster denitrifica-tion, however, no previous studies have identified denitrifying taxa or genes in the oyster microbiome.
Studies investigating the composition of oyster microbiomes are also limited compared to those regarding sediment microbiomes. Previous examinations of oyster microbiomes by cloning and sequencing of 16S rRNA genes, DNA fingerprinting and fluorescent in situ hybridization (FISH) revealedProteobacteriaandFirmicutesas dominant taxa in different oys-ter species, but were restrictive in scale or resolution [20–25]. King et al. [26] was one of the first studies using high-throughput next-generation sequencing (NGS) of 16S rRNA gene amplicons to characterize the intestine and stomach microbiome of the eastern oyster. This study showed a dominance ofMollicutesorPlanctomycetesin the oyster stomach, while intes-tines were found to be more species rich and largely composed of the phylaChloroflexi, Proteo-bacteria,VerrucomicrobiaandPlanctomycetes[26]. Follow-up microbiome studies using 16S NGS included further examination of the oyster gut microbiome, as well as microbiomes of oyster gills, mantle and hemolymph [27–30]. For example, in Lokmer et al. [28] higher abun-dances ofGammaproteobacteriawere reported in the gut, gill, mantle, and hemolymph micro-biomes compared to the surrounding seawater. However, none of the studies to date have
grant number 1233327 to MP; National Science Foundation Division of Polar Programs,https:// www.nsf.gov/div/index.jsp?div=PLR, grant number 1641019 to JSB; as well as contributions from the National Science Foundation, the Commonwealth of Virginia Equipment Trust Fund and the Office of Naval Research. The funders had no role in study design, data collection and analysis, decision to publish, or preparation of the manuscript.
attempted to connect the oyster microbiome structure to its function using NGS of 16S rRNA gene amplicons.
Exploring the linkage between the structure and function of microbiomes presents a finan-cial and logistical challenge. Whole-genome shotgun metagenomics offer the ability to identify community structure and functional genes related to metabolic processes in an environment, such as those of microbiomes. Wide-scale, whole-genome metagenomic studies however, are often prohibitively costly and may not be sufficient for large sample sets or for samples where prokaryotic genetic contribution to the metagenome is low [31]. As a result, many microbiome studies rely on much less expensive and accessible 16S rRNA gene based amplicon sequencing, which traditionally has offered little insight into functionality. To address this shortcoming with 16S rRNA gene sequencing, bioinformatic programs, Phylogenetic Investigation of Com-munities by Reconstruction of Unobserved States (PICRUSt) [32], and more recently PAthway PRediction by phylogenetIC plAcement (paprica) [33], have been developed to infer metabolic pathways from 16S rRNA gene sequences. Several recent studies have used metabolic inference programs to infer microbial metabolisms in marine microbiomes such as those of macrobiota biofilms [34], sponges [35], and corals [36]. Some key differences in the programs are in the assignment of pathways and user flexibility. PICRUSt uses ancestral state reconstruction to infer the probable metabolism (according to the KEGG ontology [37]) of extant Greengenes operational taxonomic units (OTUs) [38]. In comparison, paprica describes community struc-ture through phylogenetic placement with pplacer [39] onto a reference tree created from all completed genome in Genbank [40]. Paprica then uses a pre-computed database to assign genomic features (including genes and metabolic pathways via the MetaCyc ontology [41]). Paprica is designed to maximize user flexibility and has options for adding reference draft genomes and customizing the enzyme commission (EC) numbers associated with reference genomes.
We combined a customized database of genomes and denitrification genes with the paprica program to link the oyster digestive gland (gut), shell, and reef sediment microbiome struc-tures to denitrification by characterizing the composition of microbiomes and identifying potential denitrifiers from 16S rRNA amplicon sequences. Our main objectives were to (1) compare the oyster microbiomes’ taxonomic classifications determined by paprica and other taxonomic databases, (2) examine the structure and diversity of the oyster microbiomes using a taxonomically independent OTU analysis, and (3) connect the oyster microbiome to rates of denitrification by comparing the relative abundances and composition of denitrification genes in each microbiome to measured N2fluxes. A customized paprica database was constructed with dissimilatory nitrite reductase genes (nirS andnirK), and nitrous oxide reductase gene (nosZ) identified from completed or draft genomes.NirS andnirK encode enzymes responsi-ble for the reduction of nitrite (NO2-) to nitric oxide (NO), whilenosZ encodes for enzyme in the reduction of nitrous oxide (N2O) to nitrogen gas (N2) in the denitrification pathway. The
nosZ gene classification was further divided into two separate clades; clades I (nosZI) and II (nosZII). Gene cladesnosZI andnosZII differ based on variations in signaling peptides, phy-logeny [42], and responses to environmental conditions [43,44]. Continuous flow experiments were performed with live oysters, empty shells, and reef sediments to measure the associated denitrification activity.
Materials and methods
Sample collection and flow-through experiment
Creek (Latitude 34.706483, Longitude 76.751931), a tidal creek located in Atlantic Beach, NC, and immediately transported to the University of North Carolina Institute of Marine Sciences (UNC IMS). Oysters samples were acquired according to conditions detailed in UNC IMS’s research collection permit from NC Division of Marine Fisheries. Temperature, salinity, dis-solved oxygen (DO) were measured using a YSI water quality sonde (YSI, Inc.). Water was fil-tered through Whatman GF/F filters (25 mm diameter, 0.7 l m nominal pore size) and the filtrate was analyzed with a Lachat Quick-Chem 8000 automated ion analyzer for NO3-.
Sediment cores were left in a water bath overnight with continuous aeration with air stones. Oysters and shells were stored overnight in raceway flumes and then added to individual cores and capped the following morning. Continuous, flow-through core incubation experiments to measure N2fluxes were conducted under dark conditions in an environmental chamber held at constant site water temperatures using each of the collected samples. The treatments con-sisted of: (1) live oyster, (2) oyster shells only, and (3) sediment. Samples from the bypass line (flowed directly from reservoir to 5ml ground glass vial) and each core’s outflow were collected following the acclimation period. Inflow water and outflow water leaving the cores were ana-lyzed for dissolved N2, O2and Ar using a Balzers Prisma QME 200 quadruple mass spectrome-ter [46]. Concentrations of O2and N2were determined using the ratio with Ar [46,47]. Following the experiment, oysters, oyster shells, and 50 mL of sediment from the cores were frozen and shipped to the Virginia Institute of Marine Science, where they were stored at -80˚C.
Whole oysters were partially thawed at room temperature for approximately 30 minutes before dissection. Dissections were carried out using sterile scalpel blades. Digestive glands were carefully excised, transferred to 2.0 mL microcentrifuge tubes, and frozen at -80˚C. Fol-lowing dissection, the remaining oyster tissue was removed from its shell, and the interior of the shell was scrubbed with 75% ethanol. Oyster shells from live oysters (shell (live)) and paired oyster shells collected from the reef (shell (only)) were crushed into roughly 0.5–5.0 mm sized pieces using sterilized hammers to homogenize the exterior shell biofilm. Shell frag-ments were then transferred to 50 mL falcon tubes, and frozen at -80˚C.
DNA extraction and amplification
DNA was extracted from 0.25–0.30 grams of digestive gland using the Qiagen DNA stool mini kit (Qiagen, Hilden, Germany) following the pathogen detection protocol. Shell (0.40–0.60 grams) and sediment (0.50–0.75 grams) extractions were conducted using MoBIO Powersoil extraction kits (Mo-Bio Laboratories, Inc., Carlsbad, CA) following the manufacture’s proto-col. As a result of variation in the source material, different kits were used to extract DNA from the oyster digestive gland and the oyster shell or reef sediment in order to optimize DNA quality and DNA yield for PCR and sequencing efficiency. While this may introduce some bias, these biases tend to have a minimal impact on 16S NGS microbiome studies [48]. Overall, 12 DNA samples were extracted: triplicate DNA samples from (1) oyster digestive gland, (2) shell from live oysters, (3) collected (empty) paired shells, and (4) oyster sediment.
complete amplification. The amplified products were gene cleaned using the UltraClean Gel-Spin DNA Purification Kit (Mo-Bio Bio Laboratories, Inc., Carlsbad, CA). The resulting amplicon libraries were then used as templates for sequencing with the Ion S5 platform follow-ing the manufacture’s instruction (Thermo Fisher Scientific, Waltham, MA). Sequences gener-ated in this study may be downloaded from the NCBI Sequence Read Archive, accession number SRP106715.
Bioinformatic analyses
An overview of the bioinformatic pipeline used for the 16S rRNA based microbiome analyses is shown in supplementary materials (S1 Fig). Removal of barcodes and primers from raw sequences and trimming of sequence length were conducted using the Ribosomal Database Project (RDP) pipeline initial process [50] (http://rdp.cme.msu.edu) with a minimum quality score of 20, minimum length of 200 bases, and a maximum length of 500. Mothur v1.35.1 [51] was used to further trim sequences against the SILVA v123 [52] alignment template, preclus-ter, and screen for chimeric sequences using the uchimedenovoprogram [53]. Unknown taxa, mitochondria, chloroplast, archaea, and eukaryotic sequences were removed from analysis using SILVA v123 reference taxonomy and the Wang classification method [54] with an 80% minimum identity. Archaea were excluded from this analysis due to their low abundances; archaea comprised<1.0% of the total overall sequencing reads and made up<3.8% of the reads in any one sample. Further analyses focused on high quality bacterial sequences only.
Phylotype analyses using Mothur were conducted on high quality, trimmed bacterial sequences to determine the taxonomical composition of oyster digestive gland, oyster shell, and oyster reef sediment microbiomes. Sequences were classified with SILVA v123, Green-genes v13_5, or RDP v14 reference taxonomy databases using the Wang classification method described previously. For all phylotype analyses, resulting taxonomic relative abundances from triplicate microbiome samples were averaged together, with oyster shells from live oysters (shell (live)) and collected paired shells (shell (only)) combined together to from the oyster shell microbiome. In addition, an operational taxonomic (OTU) analysis was conducted on the microbiome sequences to assess microbiome diversity. Sequences were clustered into OTUs based on a 97% identity using the average neighbor clustering algorithm. To remove sampling intensity error and normalize samples, individual sample reads were randomly sub-sampled to the lowest number of reads found in the sample data set (n = 66,687). All diversity metrics are based on microbiome averages. For diversity metrics, both shell (live) and shell (only) treatments described previously were combined to form the shell microbiome; for prin-ciple coordinate analysis (PCoA), shell (live) and shell (only) microbiomes were analyzed sepa-rately to determine shell microbiome structure similarity.
the phylogenetic reference tree with pplacer [39]. Taxonomical classification and gene infer-ences were based on edge placement and consensus identity with either internal or terminal nodes as described in Bowman and Ducklow [33]. Resulting abundances from paprica were given as either values normalized to 16S rRNA gene copy number or as uncorrected values. Normalized values were calculated as the measured abundance divided by the number of 16S rRNA gene copies predicted for each taxon. Uncorrected values were used for the phylotype analysis to perform an equivalent comparison with the Mothur phylotype analyses, while nor-malized values were used with gene abundances to better capture potential denitrifiers. Dis-tinctions betweennosZI andnosZII gene abundances and taxonomic classification were based on edge taxonomies only.
Quantitative PCR
Quantitative PCR (qPCR) assays were performed on oyster and sediment samples to deter-mine the relative abundance ofnosZI genes. Relative abundances ofnosZI genes in each sam-ple were calculated using the ratio ofnosZI abundance to the abundance of 16S rRNA genes. Gene abundances fornosZI and 16S rRNA were determined using the 6 Flex Real-Time PCR system (Thermo Fisher Scientific, Waltham, MA). 16S rRNA gene qPCR assays were carried out in a volume of 20μL consisting of 10μL of 2X SYBR green based GoTaq qPCR Master Mix, 0.05μL CXR reference dye (Promega Corporation, Madison, WI), 0.01 mg/mL BSA (Pro-mega Corporation, Madison, WI), 0.5μM each of 16S rRNA specific primers EU341F and 685R targeting hypervariable regions V3, and 1 uL of template DNA. Thermal cycling condi-tions consisted of an initial denaturing step at 95˚C for 10 min, followed by 30 cycles of 95˚C for 15 s, 55˚C for 30 s, and 72˚C for 30 s with fluorescence detection. Quantification ofnosZI was performed using the same reaction volumes and components described for 16S, with
nosZI specific primers nosZ1F and nosZ1R [55]. Thermal cycling conditions fornosZI qPCR were the same as 16S with the exception that total cycle number was increased to 50 cycles, elongation step at 55˚C was increased to 45 s, and additional step at 80˚C with fluorescence detection was added. All reactions were performed on 96-well plates with duplicate negative controls and standards. Standards were prepared by serially diluting plasmids carrying either the 16S ornosZI gene and quantified with the Agilent 220 TapeStation System (Agilent Tech-nologies, Santa Clara, CA). Standard curves and gel electrophoresis were used to confirm reac-tion specificity.
Statistical analyses
conducted to compare the relative abundances ofnosZI measured by qPCR and the uncor-rectednosZI gene abundances predicted by paprica; uncorrected paprica values were used so that equivalent comparisons between gene abundances and qPCR relative abundances could be made. Unless otherwise stated all statistics were conducted in R and significance was based on p<0.05.
Results
Phylotype comparison of microbiomes
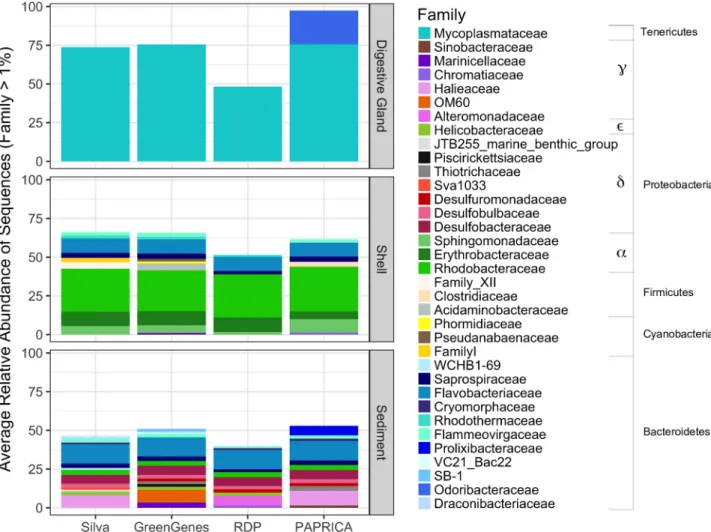
A total of 982,504 trimmed, high quality 16S rRNA gene sequences were obtained from the oyster and sediment microbiome samples. Sequencing depth averages for each micro-biome were 85,640±1.5x10⁴for oyster digestive gland, 86,745±1.6x10⁴for shell, and 68,378±1.5x10³for sediment. Among the 4 databases, paprica classified the greatest number of sequences at the family level (85.4±9.8%), followed by Silva (76.5±18.9%), Greengenes (75.8±18.5%), and RDP (57.2±18.7%). All four databases showed an overall similar pattern at the family classification level for the average relative abundance of sequences1% (Fig 1). With the exception of one shell in the shell (only) treatment having a slightly different profile
Fig 1. Average relative abundances of bacterial families in the oyster-related microbiomes, classified by different reference databases. Families with1% relative abundance in samples are shown. Shell microbiome consists of shell (live) and shell (only) treatments.
(S2 Fig), phylotype comparisons between the shell (live) and shell (only) microbiomes were similar in taxonomy and relative abundance, and were thus combined together to form the shell microbiome. Of the oyster-related microbiomes, the sediment microbiome showed the greatest number of families (n = 12.5±1.7) and the lowest percent of sequences identified (47.7±6.7%), the oyster digestive gland microbiome showed the lowest number of families (n = 1.3±0.5) and the highest number of sequences identified (73.1±24.5%), and the oyster shell microbiome fell somewhere in the middle (n = 8.8±2.5; 59.7±7.7%) (Fig 1). Each of the four databases consistently identified familyMycoplasmataceaefrom phylumTenericutesas the dominant family in the digestive gland microbiome. Paprica was the only method to also include the classification ofOdoribacteraceaeas another dominant family member in the digestive gland microbiome. Within the oyster shell microbiome, all four databases showed a dominance of familiesSphingomonadaceae,Erythrobacteraceae, andRhodobacteraceaefrom phylumProteobacteria, andFlammeovirgaceae,Flavobacteriaceae, andSaprospiraceaefrom phylumBacteroidetes.DesulfobacteraceaeandRhodobacteraceaefrom phylumProteobacteria, andFlavobacteriaceaeandSaprospiraceaefrom phylumBacteroidetes, were the dominant fami-lies consistently identified in the sediment microbiomes across all four databases. The greatest variation among the databases in the classification of families occurred in paprica’s identifica-tion of sequences from phylumBacteroidetesand Greengenes’s identification of sequences from phylumProteobacteria. However, at the phylum level, identification of sequences for each phylum was relatively consistent among the four databases.
Diversity comparison of microbiomes using OTU analysis
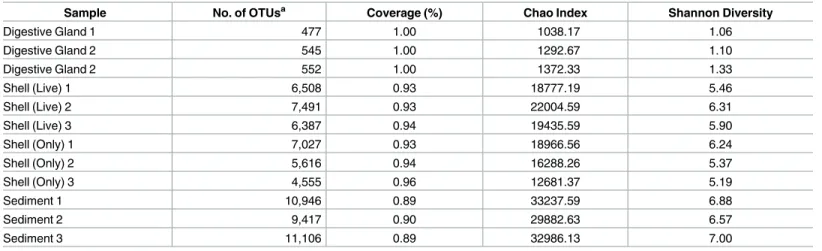
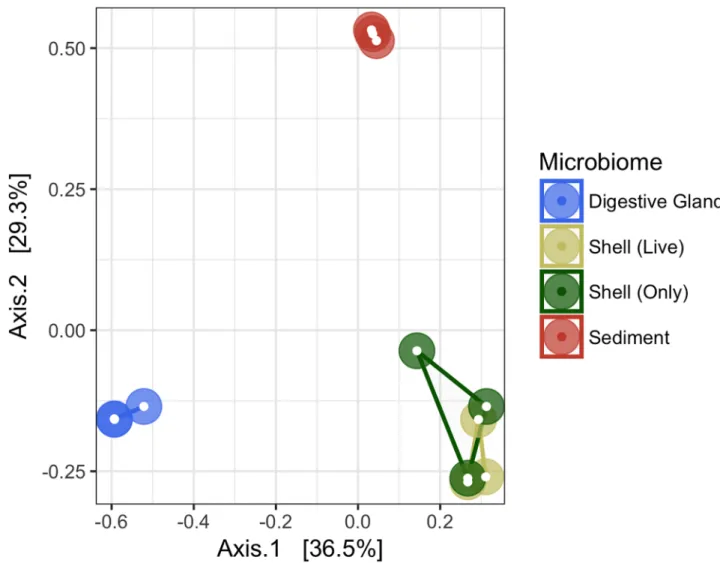
All 12 microbiome samples were subsampled to 66,687 sequences to conduct an OTU diversity analysis (Table 1andFig 2). Average coverage of sequences ranged from 89.1±0.9% in the sedi-ment microbiome to 99.6±0.0% in the oyster digestive gland. Significant differences among the microbiomes were detected with Permanova (F2,11= 8.19, p = 0.001) and demonstrated using PCoA (Fig 2), which explained 65.8% of the variation found. The oyster digestive gland, shell, and sediment samples, formed distinct microbiomes, clustering separately based on sample type. The greatest dissimilarity occurred between the oyster digestive gland and the sediment microbiome. There were no differences between the shell microbiomes, whether the shell came
Table 1. Summary statistics of 16S rRNA gene amplicon sequencing for oyster-related microbiomes.
Sample No. of OTUsa Coverage (%) Chao Index Shannon Diversity
Digestive Gland 1 477 1.00 1038.17 1.06
Digestive Gland 2 545 1.00 1292.67 1.10
Digestive Gland 2 552 1.00 1372.33 1.33
Shell (Live) 1 6,508 0.93 18777.19 5.46
Shell (Live) 2 7,491 0.93 22004.59 6.31
Shell (Live) 3 6,387 0.94 19435.59 5.90
Shell (Only) 1 7,027 0.93 18966.56 6.24
Shell (Only) 2 5,616 0.94 16288.26 5.37
Shell (Only) 3 4,555 0.96 12681.37 5.19
Sediment 1 10,946 0.89 33237.59 6.88
Sediment 2 9,417 0.90 29882.63 6.57
Sediment 3 11,106 0.89 32986.13 7.00
All metrics are based on subsamples of n = 66,687. a
OTUs are based on 97% sequence identity using Mothur’s average neighbor clustering algorithm
from a live oyster or a discarded, empty shell. Similar trends were found among the micro-biomes regarding Chao I richness, Shannon diversity, and OTU abundances (Table 1). Sediment microbiomes had the highest level of diversity and richness than all other microbiomes (Chao 1 = 32,035±1.8x10³, Shannon = 6.8±0.2), and an average OTU abundance of 10,489±9.3x10². Shell microbiome had moderate diversity and richness (Chao 1 = 18,025±3.2x10³, Shan-non = 5.7±0.5) with an average OTU abundance of 6,264±1.5x10³, and the oyster digestive glands had the lowest levels of diversity and richness (Chao 1 = 1,234±1.7x10², Shan-non = 1.2±0.1) with an average OTU abundance of 525±4.1x101.
Microbiome denitrification gene inferences with the paprica database
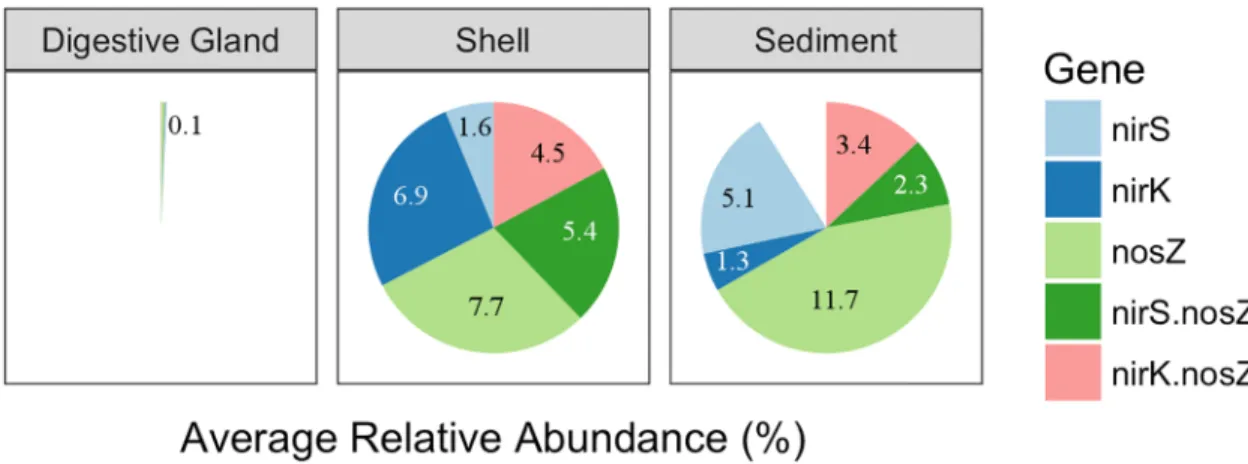
The sediment and shell microbiomes had an inferred average relative abundance of
23.8±2.8% and 26.1±3.0%, respectively, of denitrification genes (Fig 3). The digestive gland microbiome was comprised of a0.1% relative abundance of denitrification genes. The great-est differences among the microbiomes were found in the relative abundances of thenirK,
nirS, ornosZ genes only. Combined, organisms carrying one of these genes were more
Fig 2. Principal coordinate analysis (PCoA) of oyster-related microbiomes. PCoA based on 16S rRNA gene sequences using
Bray-Curtis similarity matrix.
dominant than organisms carrying bothnirS andnosZ ornirK andnosZ genes. Between the shell and sediment microbiomes, the shell microbiome had a significantly higher relative abundance of bacteria carrying thenirK only gene (unpaired t-testt5= 6.48, p = 2.6x10⁻⁵), while the sediment had a significantly higher abundance of thenirS only (unpaired t-testt7= 8.75, p = 2.6x10⁻⁵) and a higher, but not significant, abundance ofnosZonly (unpaired t-test
t7= 2.74, p>0.05) genes. Among the microbiomes, the average relative abundance of organ-isms carryingnosZII gene was overall higher than those carrying thenosZI gene (Fig 4). In the sediment microbiome, this difference was significant (paired t-testt= 7.14, p = 9.5x10⁻³), but it was not significant in the shell or digestive gland microbiomes. Taxonomically,nosZI bacte-ria were primarily from classAlphaproteobacteria, whilenosZII bacteria were from classes
CytophygiaandFlavobacteriiain the shell, andGammaproteobacteria,Cytophygia, and Flavo-bacteriiain the sediments (S3 Fig).
N
2flux experiments
Site water physical and chemical parameters used in the flux experiments were as follows: 30˚C temperature, 30 ppt salinity, 6.8 mg/L dissolved oxygen (DO), and 0.51μmol N/L NO3-. Live oyster cores had the highest average flux of N2at 364.4±23.5μmol N-N2m-2h-1, followed by the shell only cores at 355.3±6.4μmol N-N2m-2h-1, and sediment cores with the lowest at 270.5±20.1μmol N-N2m-2h-1(Fig 5). There were no significant differences in the N2fluxes between the live oyster and shell, but both were significantly higher than the sediment cores (ANOVA,F2,6= 23.7, p = 1.4x10⁻³; Tukey HSD, p<0.05).
Microbiome nosZI gene inference comparison to flux measurements and
qPCR
The rates of N2fluxes followed a similar trend to the average relative abundance ofnosZI genes inferred in oyster, shell, and sediment microbiomes (Figs5and6B). Oysters and shells had similarly high N2flux rates andnosZI genes, while sediment samples had lower rates of N2 flux and lower abundances ofnosZI genes. This trend was not found in the average relative abundance of thenosZII genes or in overallnosZgene abundance (Figs5,6A and 6C). A signif-icant, positive linear correlation was determined between the copy number ofnosZI genes quantified in the shell and sediment microbiomes by qPCR and the relative abundance of
Fig 3. Predicted average relative abundances of denitrification genes by paprica for oyster-related microbiomes.
Shell microbiome includes shell (live) and shell (only) treatments. Each full circle represents a relative abundance of 26.1%.
nosZI genes inferred from paprica (F1,7= 14.7, p = 6.0x10⁻³,R2= 0.68) (Fig 7). Predicted values were on average 3.5±1.7% x higher than those determined by qPCR. Copy numbers ofnosZI genes from oyster digestive gland microbiome samples were below detection level, and thus were excluded from the regression analysis.
Discussion
Paprica’s taxonomical classification of the oyster digestive gland, oyster shell and sediment microbiomes was comparable to other reference databases regarding the pattern of dominant families found within each microbiome (Fig 1). All four phylotype analyses in this study showedMycoplasmataceae, from phylumTenericutes, to clearly be dominant in the oyster digestive gland. While studies on oyster gut-related microbiomes are relatively small in num-ber, several studies including Green and Barnes [22], Lokmer et al. [28], and King et al. [26] foundMycoplasmato be highly abundant in digestive glands of Sydney rock oysters ( Saccos-trea glomerata), gut tissues of pacific oysters (Crassostrea gigas), and stomachs of eastern oys-ters, respectively. Even less is known about the oyster shell microbiome. While no known studies to date have examined the structure of the oyster shell microbiome, a related study
Fig 4. Predicted relative abundances of genes nosZI and nosZII by paprica in oyster-related microbiomes. Shell microbiome includes both shell (live) and shell (only) treatments.
conducted on mussel (Mytilus californianus) shell surface communities found in the Pacific Northwest showedGammaproteobacteriato be the dominant class [34]. In comparison, our study foundAlphaproteobacteriato be the dominant class in the oyster shell microbiome, whileGammaproteobacteria(andDeltaproteobacteria) were more dominant in the sediment microbiome.Alphaproteobacteria, in particularRoseobacterfrom familyRhodobacteraceae, have been shown to rapidly colonize surfaces in Atlantic temperate waters and may produce antibacterial components, preventing other bacteria from growing [58]. This may explain our findings in the shell microbiomes, which were dominated by familyRhodobacteraceae. In the sediment,Gamma-andDeltaproteobacteriahave been shown to be highly abundant in surface sediments [59–61], which is consistent with our findings. In addition toProteobacteria, Bacter-oideteswas another dominant phlyum in both shell and sediment microbiomes.Bacteroidetes
are common in the marine environment [62], and thus likely to be present in marine samples exposed to the environment.
Diversity of the microbiome determined by the paprica phylotype analyses was compared with a taxonomically independent OTU analysis performed by the Mothur program. The PCoA analyses (Fig 2) verified that the oyster digestive gland, shell, and sediment microbiomes were structurally different from each other, but also that the variation within each microbiome was relatively low. Interestingly, the microbiome structure between shells from live oysters vs. those from shells only was highly similar. Shells used in the shell only treatment grew and were collected on the same oyster reef from which the whole oysters were collected. Further studies
Fig 5. N2flux measurements from oysters, shell only, and sediment treatments using a continuous flow through design. For each treatment n = 3 and error bars represent±s.d. (*) significance p<0.05.
Fig 6. Average predicted relative abundances of total (A) nosZ, (B) nosZI, and (C) nosZII by paprica for oyster-related microbiomes. Digestive gland combined with shell (live) to form oyster microbiome. Shell (only) forms shell
microbiome. For each treatment n = 3 and error bars represent±s.d.
would need to be conducted to see if mere proximity to an oyster or oyster reef influences the shell microbiome, or if once an oyster’s shell microbiome is established, the microbiome remains after the animal has expired. The high similarity between samples within each micro-biome provided a realistic ability to measure differences between the micromicro-biomes despite the small number of samples analyzed, and a sufficient justification to assess microbiome structure based on pooled averages. Similarly, the diversity and richness patterns (Table 1) determined by the OTU analysis followed the same pattern as the taxonomical diversity demonstrated in the phylotype analyses (Fig 1). In the sediments, for example, high diversity and richness cor-responded to a greater number of taxonomical families and a more even distribution of those families. Additionally, coverage of the microbiomes was determined to be89% in the most OTU rich samples (Table 1), indicating that the microbiome structure was adequately sam-pled, and inferences drawn from the microbiomes were representative of the community
Fig 7. Linear regression comparing predicted and quantified relative abundances of nosZI genes for shell (live), shell (only) and sediment microbiomes. Predicted relative abundances based on paprica inferred nosZI gene
abundances relative to 16S gene abundances. Quantified relative abundances based on qPCR of nosZI gene copy numbers relative to 16S gene copy numbers.
structure. All of these factors combined demonstrated that the taxonomical classifications determined by the paprica database accurately and thoroughly described the microbiome structures. This allowed for reasonable confidence in using the modified paprica database to infer the abundance and distribution of denitrification related genes in the oyster digestive gland, shell, and sediment microbiomes.
Despite having different taxonomical profiles (Fig 1) and distinct microbiome structures (Fig 2), The average relative % abundances of bacteria carryingnirS,nirK,nosZ, or a combina-tion of those genes, were similar in the shell and sediments, making up between ~ 23–26% of the overall community (Fig 3). This suggests the abundance and distribution of denitrifying bacteria carrying these genes may be conserved between microbiomes. However, this pattern changed with respect to individual gene abundances. Both shell and sediment microbiomes had relatively similar overall abundances ofnironly genes, yetnirK only was significantly more abundant in the shell microbiome, whilenirS only was significantly more abundant in the sediment microbiome. In estuarine systems,nirS has been generally shown to be more abundant thannirK [63,64]. However,nirK has been shown to be dominant in environments associated with animal hosts [43] and in zones of high oxygen and pH fluctuation, like those found in microbial mats [65]. The higher abundance ofnirK carrying bacteria versusnirS in oyster shells may be evidence of the shell microbiome’s (current or past) connection to an oys-ter host, or a result of the potentially more oxic environment provided by the shell surface, compared to the marine sediment. Also interesting, is that in both microbiomes the predicted relative abundances of complete denitrifiers, those carrying thenirandnosgenes together, were less than those carrying either thenirornosgenes separately. This indicates that the com-plete transformation of NO2-to N2in of these microbiomes may be highly modular and dependent on community interaction and not individual denitrifiers.
RegardingnosZ gene abundances, all oyster-related microbiomes, showed the predicted rel-ative abundance ofnosZII bacteria were higher thannosZI carriers (Fig 4). This is consistent with other studies that have shownnosZII denitrifiers to be dominant overnosZI denitrifiers in a variety of different environments [42,66]. Microbes with thenosZII gene have been shown to be more taxonomically and ecophysiologically diverse than those withnosZI genes [67]. This was evident in the shell and sediment microbiomes in our study. Among the shell and sediment microbiomes, the primary driver ofnosZI abundances belonged to bacteria from a single class,Alphaproteobacteria, whilenosZII abundances were mainly driven by bacteria belonging to classesCytophygia, andFlavobacteriiain the shell andGammaproteobacteria,
Cytophygia, andFlavobacteriiain the sediments (S3 Fig). Additionally, among all three micro-biomes, as diversity increases in the microbiome, the differences betweennosZI andnosZII abundances became much greater. This may suggest thatnosZII abundances may be positively linked to microbiome diversity.
Predicted relative abundances ofnosZ (combinednosZI andnosZII), the gene responsible for transforming N2O to N2(Fig 6A) and thus expected to be highest in microbiomes with the greatest denitrification, showed the opposite trend. The highest relative abundances ofnosZ genes were found in the reef sediments with the lowest N2fluxes, while the lowest relative abundances ofnosZ genes were found in the oyster shell (only) and in the oyster (combination of shell (live) and oyster digestive gland) with the highest N2fluxes. This may be a result of DNA-based gene abundances failing to correlate with gene expression. However, whennosZI and II are analyzed separately, a pattern similar to the flux rates emerges withnosZI abundance (Fig 6B and 6C). A significant positive correlation betweennosZI abundance measured by qPCR and the predicted relative abundances ofnosZI verified that as denitrification flux rates increased, so did the abundances ofnosZI (Fig 7). This pattern was not seen in the more domi-nantnosZII gene abundances, suggesting thatnosZI carriers may be more important to deni-trification in oyster microbiomes thannosZII carriers. As mentioned previously, many organisms may carry thenosZ gene, but do not necessarily express thenosZ gene. Organisms carrying thenosZII gene are more likely than those withnosZI to also carry genes relating to dissimilatory nitrate reduction to ammonium (DNRA), a competing reduction pathway to denitrification [67]. Thus, the predicted abundance ofnosZI genes may be a better indicator of denitrification potential in oyster and sediment microbiomes than overallnosZ gene abundance.
Similar to other gene-based metabolic inference analyses, limitations exist regarding the quality and scope of the reference database being used as well as the understanding of the gene and metabolic pathways themselves. Our reference database was constructed with 5,445 complete and 222 draft bacterial genomes and curated for denitrification genes using KEGG or draft genome annotations. While the combination of these genomes covers a wide taxo-nomic range of bacteria, a great number of bacteria in many environments still remain unclassified or have identified genomes that are either incomplete or of low quality. Further-more, caution must be used in inferring metabolic processes from gene presence in a bacte-rial genome. Often metabolic processes are extremely complex and require the coordinated expression of several different genes. While results from our study indicated that the relative abundance of thenosZI gene is linked to denitrification potential of the oyster microbiomes, our study was small in scale and from only one season and location. Additional studies com-bining 16S rRNA gene studies and metabolic data are necessary to further validate the use of gene-based metabolic inferences as a reliable method for assessing the metabolic potential of microbiomes.
Conclusions
16S rRNA gene based metabolic inference as an alternative to whole genome sequencing in an effort to assess microbiome structure and connect microbiome function to the environment.
Supporting information
S1 Fig. Flowchart of bioinformatic pipeline.
(TIF)
S2 Fig. Relative abundances of bacterial families in shell (live) and shell (only) treatments.
(TIF)
S3 Fig. Relative abundances ofnosZI andnosZII by taxonomical class.
(TIF)
S1 Table. Complete and draft bacterial genomes.
(CSV)
S2 Table. Customized gene database user file.
(CSV)
Acknowledgments
Suzanne Thompson, Caitlin Magel, and Luke Dodd provided excellent field and laboratory support. This work was performed in part using computing facilities at the College of William and Mary, which were provided by contributions from the National Science Foundation, the Commonwealth of Virginia Equipment Trust Fund and the Office of Naval Research. This paper is Contribution No. 3664 of the Virginia Institute of Marine Science, College of William and Mary.
Author Contributions
Conceptualization: Ann Arfken, Bongkeun Song.
Data curation: Ann Arfken.
Formal analysis: Ann Arfken, Michael Piehler.
Funding acquisition: Bongkeun Song.
Investigation: Ann Arfken, Bongkeun Song, Michael Piehler.
Methodology: Ann Arfken, Bongkeun Song.
Project administration: Bongkeun Song.
Resources: Bongkeun Song, Jeff S. Bowman, Michael Piehler.
Software: Jeff S. Bowman.
Supervision: Bongkeun Song.
Visualization: Ann Arfken.
Writing – original draft: Ann Arfken, Bongkeun Song.
References
1. Glibert PM, Hinkle DC, Sturgis B, Jesien RV. Eutrophication of a Maryland/Virginia coastal lagoon: a tip-ping point, ecosystem changes, and potential causes. Estuaries and Coasts. 2014; 37(S1):128–46. https://doi.org/10.1007/s12237-013-9630-3
2. Cerco CF, Noel MR. Can oyster restoration reverse cultural eutrophication in Chesapeake Bay? Estuar-ies and Coasts. 2007; 30(2):331–43.
3. Newell RIE, Cornwell JC, Owens MS. Influence of simulated bivalve biodeposition and microphyto-benthos on sediment nitrogen dynamics: A laboratory study. Limnol Oceanogr. 2002; 47(5):1367–79.
4. Kellogg ML, Smyth AR, Luckenbach MW, Carmichael RH, Brown BL, Cornwell JC, et al. Use of oysters to mitigate eutrophication in coastal waters. Estuar Coast Shelf Sci. 2014; 151:156–68.
5. Zumft WG. Cell biology and molecular basis of denitrification. Microbiol Mol Biol Rev. 1997; 61(4):533– 616. PMID:9409151
6. Humphries AT, Ayvazian SG, Carey JC, Hancock BT, Grabbert S, Cobb D, et al. Directly measured denitrification reveals oyster aquaculture and restored oyster reefs remove nitrogen at comparable high rates. Front Mar Sci. 2016; 3(May):74.https://doi.org/10.3389/fmars.2016.00074
7. Kellogg ML, Cornwell JC, Owens MS, Paynter KT. Denitrification and nutrient assimilation on a restored oyster reef. Mar Ecol Prog Ser. 2013; 480:1–19.
8. Hoellein TJ, Zarnoch CB, Grizzle RE. Eastern oyster (Crassostrea virginica) filtration, biodeposition, and sediment nitrogen cycling at two oyster reefs with contrasting water quality in Great Bay Estuary (New Hampshire, USA). Biogeochemistry. 2015; 122(1):113–29. https://doi.org/10.1007/s10533-014-0034-7
9. Smyth AR, Geraldi NR, Thompson SP, Piehler MF. Biological activity exceeds biogenic structure in influencing sediment nitrogen cycling in experimental oyster reefs. Mar Ecol Prog Ser. 2016; 560:173– 83.
10. Newell RIE, Fisher TR, Holyoke RR, Cornwell JC. Influence of eastern oysters on nitrogen and phos-phorus regeneration in Chesapeake Bay, USA. In: Dame R, Olenin S, editors. The Comparative roles of suspension feeders in ecosystems NATO Science Ser IV: Earth and Environmental Sciences. Dor-drecht: Springer; 2005. p. 93–120.
11. Giles H, Pilditch CA, Bell DG. Sedimentation from mussel (Perna canaliculus) culture in the Firth of Thames, New Zealand: Impacts on sediment oxygen and nutrient fluxes. Aquaculture. 2006; 261 (1):125–40.https://doi.org/10.1016/j.aquaculture.2006.06.048
12. Jenkins MC, Kemp WM. The coupling of nitrification and denitrification in two estuarine sediments. Lim-nol Oceanogr. 1984; 29(3):609–19.
13. Smyth AR, Geraldi NR, Piehler MF. Oyster-mediated benthic-pelagic coupling modifies nitrogen pools and processes. Mar Ecol Prog Ser. 2013; 493:23–30.https://doi.org/10.3354/meps10516
14. Svenningsen NB, Heisterkamp IM, Sigby-Clausen M, Larsen LH, Nielsen LP, Stief P, et al. Shell biofilm nitrification and gut denitrification contribute to emission of nitrous oxide by the invasive freshwater mus-sel Dreissena polymorpha (Zebra musmus-sel). Appl Environ Microbiol. 2012; 78(12):4505–9.https://doi. org/10.1128/AEM.00401-12PMID:22492461
15. Stief P, Poulsen M, Nielsen LP, Brix H, Schramm A. Nitrous oxide emission by aquatic macrofauna. Proc Natl Acad Sci U S A. 2009; 106(11):4296–300.https://doi.org/10.1073/pnas.0808228106PMID: 19255427
16. Ngugi DK, Brune A. Nitrate reduction, nitrous oxide formation, and anaerobic ammonia oxidation to nitrite in the gut of soil-feeding termites (Cubitermes and Ophiotermes spp.). Environ Microbiol. 2012; 14(4):860–71.https://doi.org/10.1111/j.1462-2920.2011.02648.xPMID:22118414
17. Wu¨st PK, Horn MA, Henderson G, Janssen PH, Rehm BHA, Drake HL. Gut-associated denitrification and in vivo emission of nitrous oxide by the earthworm families Megascolecidae and Lumbricidae in New Zealand. Appl Environ Microbiol. 2009; 75(11):3430–6.https://doi.org/10.1128/AEM.00304-09 PMID:19346358
18. Depkat-Jakob PS, Hilgarth M, Horn MA, Drake HL. Effect of earthworm feeding guilds on ingested dis-similatory nitrate reducers and denitrifiers in the alimentary canal of the earthworm. Appl Environ Micro-biol. 2010; 76(18):6205–14.https://doi.org/10.1128/AEM.01373-10PMID:20656855
19. Caffrey JM, Hollibaugh JT, Mortazavi B. Living oysters and their shells as sites of nitrification and denitri-fication. Mar Pollut Bull. 2016; 112:86–90.https://doi.org/10.1016/j.marpolbul.2016.08.038PMID: 27567196
21. Herna´ndez-Za´rate G, Olmos-Soto J. Identification of bacterial diversity in the oyster Crassostrea gigas by fluorescent in situ hybridization and polymerase chain reaction. J Appl Microbiol. 2006; 100(4):664– 72.https://doi.org/10.1111/j.1365-2672.2005.02800.xPMID:16553721
22. Green TJ, Barnes AC. Bacterial diversity of the digestive gland of Sydney rock oysters, Saccostrea
glo-merata infected with the paramyxean parasite, Marteilia sydneyi. J Appl Microbiol. 2010; 109(2):613–
22.https://doi.org/10.1111/j.1365-2672.2010.04687.xPMID:20202017
23. Zurel D, Benayahu Y, Or A, Kovacs A, Gophna U. Composition and dynamics of the gill microbiota of an invasive Indo-Pacific oyster in the eastern Mediterranean Sea. Environ Microbiol. 2011; 13(6):1467–76. https://doi.org/10.1111/j.1462-2920.2011.02448.xPMID:21635673
24. Fernandez-Piquer J, Bowman JP, Ross T, Tamplin ML. Molecular analysis of the bacterial communities in the live Pacific oyster (Crassostrea gigas) and the influence of postharvest temperature on its struc-ture. J Appl Microbiol. 2012; 112(6):1134–43.https://doi.org/10.1111/j.1365-2672.2012.05287.xPMID: 22429335
25. Trabal N, Mazo´n-Sua´stegui JM, Va´zquez-Jua´rez R, Asencio-Valle F, Morales-Bojo´rquez E, Romero J. Molecular analysis of bacterial microbiota associated with oysters (Crassostrea gigas and Crassostrea
corteziensis) in different growth phases at two cultivation sites. Microb Ecol. 2012; 64(2):555–69.
https://doi.org/10.1007/s00248-012-0039-5PMID:22450510
26. King GM, Judd C, Kuske CR, Smith C. Analysis of stomach and gut microbiomes of the eastern oyster (Crassostrea virginica) from coastal Louisiana, USA. PLoS One. 2012; 7(12):e51475.https://doi.org/ 10.1371/journal.pone.0051475PMID:23251548
27. Wegner KM, Volkenborn N, Peter H, Eiler A. Disturbance induced decoupling between host genetics and composition of the associated microbiome. BMC Microbiol. 2013; 13(1):252.
28. Lokmer A, Kuenzel S, Baines JF, Wegner KM. The role of tissue-specific microbiota in initial establish-ment success of Pacific oysters. Environ Microbiol. 2016; 18(3):970–87. https://doi.org/10.1111/1462-2920.13163PMID:26695476
29. Lokmer A, Wegner KM. Hemolymph microbiome of Pacific oysters in response to temperature, temper-ature stress and infection. ISME J. 2015; 9(3):670–82.https://doi.org/10.1038/ismej.2014.160PMID: 25180968
30. Trabal Ferna´ndez N, Mazo´n-Sua´stegui JM, Va´zquez-Jua´rez R, Ascencio-Valle F, Romero J. Changes in the composition and diversity of the bacterial microbiota associated with oysters (Crassostrea
corte-ziensis, Crassostrea gigas and Crassostrea sikamea) during commercial production. FEMS Microbiol
Ecol. 2014; 88(1):69–83.https://doi.org/10.1111/1574-6941.12270PMID:24325323
31. Sharpton TJ. An introduction to the analysis of shotgun metagenomic data. Front Plant Sci. 2014; 5 (June):209.https://doi.org/10.3389/fpls.2014.00209PMID:24982662
32. Langille MGI, Zaneveld J, Caporaso JG, McDonald D, Knights D, Reyes JA, et al. Predictive functional profiling of microbial communities using 16S rRNA marker gene sequences. Nat Biotechnol. 2013; 31 (9):814–21.https://doi.org/10.1038/nbt.2676PMID:23975157
33. Bowman JS, Ducklow HW. Microbial communities can be described by metabolic structure: A general framework and application to a seasonally variable, depth-stratified microbial community from the coastal West Antarctic Peninsula. PLoS One. 2015; 10(8):1–18.https://doi.org/10.1371/journal.pone. 0135868PMID:26285202
34. Pfister CA, Gilbert JA, Gibbons SM. The role of macrobiota in structuring microbial communities along rocky shores. PeerJ. 2014; 2:e631.https://doi.org/10.7717/peerj.631PMID:25337459
35. Cleary DFR, de Voogd NJ, Polonia ARM, Freitas R, Gomes NCM. Composition and predictive func-tional analysis of bacterial bommunities in seawater, sediment and sponges in the Spermonde Archipel-ago, Indonesia. Microb Ecol. 2015; 70(4):889–903.https://doi.org/10.1007/s00248-015-0632-5PMID: 26072397
36. Rothig T, Ochsenkuhn MA, Roik A, Van Der Merwe R, Voolstra CR. Long-term salinity tolerance is accompanied by major restructuring of the coral bacterial microbiome. Mol Ecol. 2016; 25(6):1308–23. https://doi.org/10.1111/mec.13567PMID:26840035
37. Kanehisa M, Goto S. KEGG: Kyoto encyclopedia of genes and genomes. Nucleic Acids Res. 2000; 27 (1):29–34.https://doi.org/10.1093/nar/27.1.29
38. DeSantis TZ, Hugenholtz P, Larsen N, Rojas M, Brodie EL, Keller K, et al. Greengenes, a chimera-checked 16S rRNA gene database and workbench compatible with ARB. Appl Environ Microbiol. 2006; 72(7):5069–72.https://doi.org/10.1128/AEM.03006-05PMID:16820507
40. Clark K, Karsch-Mizrachi I, Lipman DJ, Ostell J, Sayers EW. GenBank. Nucleic Acids Res. 2016; 44 (D1):D67–72.https://doi.org/10.1093/nar/gkv1276PMID:26590407
41. Caspi R, Billington R, Ferrer L, Foerster H, Fulcher CA, Keseler IM, et al. The MetaCyc database of met-abolic pathways and enzymes and the BioCyc collection of pathway/genome databases. Nucleic Acids Res. 2014; 44(D1):D471–80.https://doi.org/10.1093/nar/gkt1103PMID:24225315
42. Jones CM, Graf DRH, Bru D, Philippot L, Hallin S. The unaccounted yet abundant nitrous oxide-reduc-ing microbial community: a potential nitrous oxide sink. ISME J. 2013; 7(2):417–26.https://doi.org/10. 1038/ismej.2012.125PMID:23151640
43. Graf DRH, Jones CM, Hallin S. Intergenomic comparisons highlight modularity of the denitrification pathway and underpin the importance of community structure for N2O emissions. PLoS One. 2014; 9 (12):1–20.
44. Domeignoz-Horta LA, Spor A, Bru D, Breuil MC, Bizouard F, Le´onard J, et al. The diversity of the N2O reducers matters for the N2O:N2denitrification end-product ratio across an annual and a perennial crop-ping system. Front Microbiol. 2015; 6(SEP).https://doi.org/10.3389/fmicb.2015.00971PMID:
26441904
45. Piehler MF, Smyth AR. Habitat-specific distinctions in estuarine denitrification affect both ecosystem function and services. Ecosphere. 2011; 2(1):art12.https://doi.org/10.1890/ES10-00082.1
46. Kana TM, Darkangelo C, Hunt MD, Oldham JB, Bennett GE, Cornwell JC. Membrane inlet mass spec-trometer for rapid high-precision determination of N2, O2, and Ar in environmental water samples. Anal Chem. 1994; 66(23):4166–70.
47. Ensign SH, Piehler MF, Doyle MW. Riparian zone denitrification affects nitrogen flux through a tidal freshwater river. Biogeochemistry. 2008; 91(2–3):133–50.https://doi.org/10.1007/s10533-008-9265-9
48. Rubin BE, Sanders JG, Hampton-Marcell J, Owens SM, Gilbert JA, Moreau CS. DNA extraction proto-cols cause differences in 16S rRNA amplicon sequencing efficiency but not in community profile compo-sition or structure. MicrobiologyOpen. 2014; 3(6):910–921.https://doi.org/10.1002/mbo3.216PMID: 25257543
49. Caporaso JG, Lauber CL, Walters WA, Berg-lyons D, Lozupone CA, Turnbaugh PJ, et al. Global pat-terns of 16S rRNA diversity at a depth of millions of sequences per sample. Proc Natl Acad Sci. 2010; 108:4516–22.https://doi.org/10.1073/pnas.1000080107PMID:20534432
50. Cole JR, Wang Q, Fish JA, Chai B, McGarrell DM, Sun Y, et al. Ribosomal Database Project: Data and tools for high throughput rRNA analysis. Nucleic Acids Res. 2014; 42(D1):633–42.
51. Schloss PD, Westcott SL, Ryabin T, Hall JR, Hartmann M, Hollister EB, et al. Introducing mothur: Open-source, platform-independent, community-supported software for describing and comparing microbial communities. Appl Environ Microbiol. 2009; 75(23):7537–41.https://doi.org/10.1128/AEM. 01541-09PMID:19801464
52. Yilmaz P, Parfrey LW, Yarza P, Gerken J, Ludwig W, Pruesse E, et al. The SILVA and “All-species Liv-ing Tree Project (LTP)” taxonomic frameworks. Nucleic Acids Res. 2014; 42(November 2013):D643–8. https://doi.org/10.1093/nar/gkt1209PMID:24293649
53. Edgar RC, Haas BJ, Clemente JC, Quince C, Knight R. UCHIME improves sensitivity and speed of chi-mera detection. Bioinformatics. 2011; 27(16):2194–200.https://doi.org/10.1093/bioinformatics/btr381 PMID:21700674
54. Wang Q, Garrity GM, Tiedje JM, Cole JR. Naive Bayesian classifier for rapid assignment of rRNA sequences into the new bacterial taxonomy. Appl Environ Microbiol. 2007; 73(16):5261–7.https://doi. org/10.1128/AEM.00062-07PMID:17586664
55. Henry S, Bru D, Stres B, Hallet S, Philippot L. Quantitative detection of the nosZ gene, encoding nitrous oxide reductase, and comparison of the abundances of 16S rRNA, narG, nirK, and nosZ genes in soils. Appl Environ Microbiol. 2006; 72(8):5181–9.https://doi.org/10.1128/AEM.00231-06PMID:16885263
56. Anderson. A new method for non-parametric multivariate analysis of variance. Austral Ecol. 2001; 26 (2001):32–46.https://doi.org/10.1111/j.1442-9993.2001.01070.pp.x
57. McMurdie PJ, Holmes S. Phyloseq: An R package for reproducible interactive analysis and graphics of microbiome census data. PLoS One. 2013; 8(4).https://doi.org/10.1371/journal.pone.0061217PMID: 23630581
58. Dang H, Li T, Chen M, Huang G. Cross-ocean distribution of Rhodobacterales bacteria as primary sur-face colonizers in temperate coastal marine waters. Appl Environ Microbiol. 2008; 74(1):52–60.https:// doi.org/10.1128/AEM.01400-07PMID:17965206
60. Feng BW, Li XR, Wang JH, Hu ZY, Meng H, Xiang LY, et al. Bacterial diversity of water and sediment in the Changjiang estuary and coastal area of the East China Sea. FEMS Microbiol Ecol. 2009; 70(2):236–48.https://doi.org/10.1111/j.1574-6941.2009.00772.xPMID:19780829
61. Polymenakou PN, Bertilsson S, Tselepides a., Stephanou EG. Links between geographic location, envi-ronmental factors, and microbial community composition in sediments of the Eastern Mediterranean Sea. Microb Ecol. 2005; 49(3):367–78.https://doi.org/10.1007/s00248-004-0274-5PMID:16003476
62. Thomas F, Hehemann JH, Rebuffet E, Czjzek M, Michel G. Environmental and gut Bacteroidetes: The food connection. Front Microbiol. 2011; 2(MAY):1–16.https://doi.org/10.3389/fmicb.2011.00093PMID: 21747801
63. Mosier AC, Francis CA. Denitrifier abundance and activity across the San Francisco Bay estuary. Envi-ron Microbiol Rep. 2010; 2:667–76.https://doi.org/10.1111/j.1758-2229.2010.00156.xPMID: 23766254
64. Smith CJ, Dong LF, Wilson J, Stott A, Osborn AM, Nedwell DB. Seasonal variation in denitrification and dissimilatory nitrate reduction to ammonia process rates and corresponding key functional genes along an estuarine nitrate gradient. Front Microbiol. 2015; 6(JUN):1–11.https://doi.org/10.3389/fmicb.2015. 00542PMID:26082763
65. Desnues C, Michotey D, Wieland A, Zhizang C, Fourcans A, Duran R, et al. Seasonal and diel distribu-tions of denitrifying and bacterial communities in a hypersaline microbial mat (Camargue, France). Water Res. 2007; 41:3407–19.https://doi.org/10.1016/j.watres.2007.04.018PMID:17590406
66. Orellana LH, Rodriguez-R LM, Higgins S, Chee-Sanford JC, Sanford RA, Ritalahti KM, et al. Detecting nitrous oxide reductase (nosZ) genes in soil metagenomes: method development and implications for the nitrogen cycle. MBio. 2014; 5(3):e01193–14.https://doi.org/10.1128/mBio.01193-14PMID: 24895307