Mathematical model reveals role of nucleotide
signaling in airway surface liquid homeostasis
and its dysregulation in cystic fibrosis
Conner I. Sandefura,b,c,1, Richard C. Boucherb, and Timothy C. Elstonc
aDepartment of Biology, University of North Carolina at Pembroke, Pembroke, NC 28372;bMarsico Lung Institute/University of North Carolina Cystic Fibrosis Center, School of Medicine, University of North Carolina at Chapel Hill, Chapel Hill, NC 27599; andcDepartment of Pharmacology, University of North Carolina at Chapel Hill, Chapel Hill, NC 27599
Edited by Charles S. Peskin, New York University, New York, NY, and approved July 18, 2017 (received for review October 20, 2016)
Mucociliary clearance is composed of three components (i.e., mucin secretion, airway surface hydration, and ciliary-activity) which function coordinately to clear inhaled microbes and other foreign particles from airway surfaces. Airway surface hydration is maintained by water fluxes driven predominantly by active chloride and sodium ion transport. The ion channels that mediate electrogenic ion transport are regulated by extracellular purinergic signals that signal through G protein-coupled receptors. These purinoreceptors and the signaling pathways they activate have been identified as possible therapeutic targets for treating lung disease. A systems-level description of airway surface liquid (ASL) homeostasis could accelerate development of such therapies. Accordingly, we developed a mathematical model to describe the dynamic coupling of ion and water transport to extracellular purinergic signaling. We trained our model from steady-state and time-dependent experimental measurements made using normal and cystic fibrosis (CF) cultured human airway epithelium. To reproduce CF conditions, reduced chloride secretion, increased potassium secretion, and increased sodium absorption were re-quired. The model accurately predicted ASL height under basal normal and CF conditions and the collapse of surface hydration due to the accelerated nucleotide metabolism associated with CF exacerbations. Finally, the model predicted a therapeutic strategy to deliver nucleotide receptor agonists to effectively rehydrate the ASL of CF airways.
airway surface liquid
|
cystic fibrosis|
mathematical modeling|
purinergic signalingF
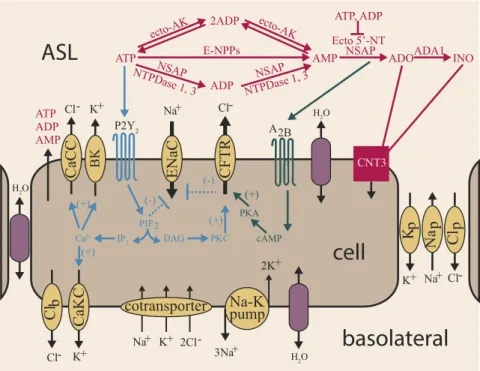
ailure to maintain airway surface liquid (ASL) homeostasis adversely impacts normal mucociliary clearance (MCC), producing pulmonary diseases such as cystic fibrosis (CF) (1). Chloride (Cl−) ion transport is disrupted in CF due to mutations in the CF transmembrane regulator (CFTR), an anion channel protein. In pulmonary epithelia, CFTR mutations result in a reduced ability for transcellular Cl− secretion, reducing ionic gradients that generate water flow (1). ASL rehydration, there-fore, is a goal of CF therapies but remains difficult to achieve due to the complexity of the regulatory systems that maintain ASL homeostasis.Experimental evidence suggests that a dominant mechanism used by human airway epithelial cells to maintain ASL homeo-stasis is the regulation of transepithelial ion fluxes by extracel-lular purinergic signaling pathways (2, 3) (Fig. 1). The key signaling molecules involved in the regulation of ASL volume are ATP and adenosine (ADO). UTP also can initiate signaling. However, because UTP concentrations in ASL are significantly lower than ATP, UTP is not thought to play a major role in ASL homeostasis. Qualitatively, ASL volume regulation can be un-derstood as follows. As pulmonary surfaces become dehydrated, increased concentrations of ATP and ADO are generated as a function of cilia–mucus interactions (4), and these agonists ac-tivate G protein-coupled receptors that regulate the conductance
of ion channels located in the apical cell membrane. This regu-lation leads to a net flux of ions from the cell into the ASL, creating an osmotic driving force that draws water into the ASL and rehydrates pulmonary surfaces. Increased ASL volume re-duces the concentrations of ATP, mucus, and ADO, modulating signaling intensity.
Specific aspects of nucleotide regulation of ASL volume are well-characterized. Extracellular ATP activates signaling via P2Y2 purinoreceptors. In normal airway epithelia, activation of P2Y2-R purinoreceptors cleaves phosphatidylinositol 4,5-bisphosphate (PIP2), via a phospholipase C-dependent mecha-nism, which inhibits by the epithelial sodium channel (ENaC) that mediates Na+ absorption (5, 6). In parallel, the PIP2 cleavage product, IP3, stimulates a rise in intracellular Ca2+and Cl− secretion through CFTR and calcium-activated chloride channels (CaCCs). Rises in intracellular calcium also activate apical and basolateral potassium effluxes through calcium-activated potassium channels (BKs and CaKCs, respectively) (7, 8). ATP is released from airway epithelial cells onto pul-monary surfaces via regulated vesicular and channel-mediated pathways. Enzymes located on the airway surface modulate ATP levels via the metabolism of extracellular ATP, which produces a second agonist, ADO. This second agonist, ADO, signals via the A2b receptor, leading to the generation of the second messenger cAMP, which stimulates Cl−secretion via the CFTR channel (3). Collectively, purinergic signals generate transepithelial osmotic (ion) gradients that drive water fluxes between the basolateral compartment and the airway surface (2, 9). In turn, this movement of water changes ASL volume and, at
Significance
The intrapulmonary airways conduct air to the alveoli and are defended from inhaled pathogens by a highly regulated pro-tective system of mucus, cilia, and liquid. In healthy lungs, a well-hydrated mucus layer is cleared by cilia from airway sur-faces. In cystic fibrosis (CF), airway surfaces are dehydrated, leading to a failure of cilia-mediated mucus clearance and ac-cumulation of pathogen-infected mucus. In this study, we created a mathematical model of airway surface liquid regu-lation in normal and CF cells and used the model to investigate a potential therapy to rehydrate CF airways and restore proper mucus clearance.
Author contributions: C.I.S., R.C.B., and T.C.E. designed research; C.I.S. performed re-search; C.I.S., R.C.B., and T.C.E. analyzed data; and C.I.S., R.C.B., and T.C.E. wrote the paper.
The authors declare no conflict of interest.
This article is a PNAS Direct Submission.
Freely available online through the PNAS open access option.
1To whom correspondence should be addressed. Email: [email protected].
This article contains supporting information online atwww.pnas.org/lookup/suppl/doi:10.
least transiently, extracellular mucus and nucleotide concentrations. Thus, ASL homeostasis is maintained by a complex system in which purinergic signaling and ion/water transport are dynam-ically coupled.
Mathematical models have proven to be useful tools for un-derstanding and quantifying the different components of the system that govern ASL homeostasis, including ion and water transport and nucleotide regulation. Most available ion transport models (10–13) focus on experiments performed in continuously perfused Ussing chambers, where extracellular ion concentra-tions are held constant and the ASL volume is maintained at a level much larger than found in vivo. More recently, airway liq-uid interface (“thin-film”) cultures have been used to study dy-namic changes in ASL volume under conditions similar to those found in human lungs (14). Most available models of ASL transport (15–17) capture ion-driven water fluxes but do not account for channel regulation or ASL volume by extracellular signaling molecules.
As a step toward achieving a systems-level understanding of ASL homeostasis we developed and validated a mathematical model that coupled ion and water transport to purinergic sig-naling. Specifically, our model coupled the conductance of CFTR, ENaC, CaCC, CaKC, and BK channels to signaling by extracellular nucleotides and nucleosides. To estimate model parameter values we fitted our model to experimental data from both normal and CF human airway epithelial cells. To validate the model we used the model to predict changes in ASL height by varying sodium absorption and chloride secre-tion rates and removing nucleotide regulasecre-tion of ion transport. The model was then used to elucidate the episodic failure of mucus transport in CF-associated clinical exacerbations and develop strategies to restore airway surface hydration and mucus clearance in CF.
Mathematical Model
Our model of dynamic ASL regulation couples ion and water transport with purinergic signaling (Fig. 1). A description of the model variables and their corresponding units is given in Table 1. The starting point for our investigation was our previous model of ion transport with dynamic cell volumes under conditions of constant ASL volume (11). To model changes in both cellular and ASL volume due to water fluxes driven by osmotic gradients we updated the model to include the following equation for the height of the apical compartment (HA, in meters):
d
dtHA=VH2O
h
ppH2OðOSMA−OSMBÞ−paH2OðOSMC−OSMAÞ
i
,
[1]
whereVH2Ois the molar volume of water (in units of cubic meters
per mole),ppH2Oandpa
H2Oare the paracellular pathway and apical
membrane permeabilities to water (in units of meters per sec-ond, often denoted Pf), respectively, andOSMIis the osmolarity
of compartmentI[ASL (A), basolateral (B), cellular (C), in units of millimolar]. We assumed a constant surface area so that the changes in ASL height related directly to the changes in ASL volume. Cell volume was a function of basolateral and apical water fluxes and is modeled as previously described (11).
The osmolarity of the ASL compartment (OSMA), was
de-fined as
OSMA=ΦA
½Na+A+½K+A+½Cl−A+½OIA, [2]
whereΦAis the osmotic coefficient of the ASL,½Na+A,½K+A,
and ½Cl−A are the concentrations of sodium, potassium, and chloride in the ASL, respectively, and½OIAis the concentration of all other ions and impermeable osmolytes within the ASL. Compounds captured by ½OIA were assumed to reside only in
cotransporter
Na-K
pump
ATP ADP
AMP A2B
CaCC
Cl-ATP
ecto-AK
E-NPPs NSAP
NTPDase 1
, 3 ADP
NSAP NTPDase 1, 3
AMP ecto-AK 2ADP
Ecto 5’-NT NSAP ATP, ADP
ADOADA1 INO
ENaC
Na+
CFTR
Cl-BK
K+
CaKC
K+ K+
2K+
Na+ 2Cl-3Na+ H2O
H2O
H2O
CNT3
P2Y2
K
p
K+
Na
p
Na+
Cl
p
Cl-Cl
b
Cl-PIP2
IP3 DAG PKC
PKA
Ca2+ cAMP
(+)
(+) (+)
(+)
(-) (-)
ASL
cell
basolateral
Fig. 1. Schematic diagram of ASL regulation. Extracellular ATP and ADO dynamically regulate four apical membrane channel permeabilities, calcium-acti-vated chloride channels (CaCCs), calcium-acticalcium-acti-vated voltage-dependent potassium channels (BKs), epithelial sodium channels (ENaCs), and CF transmembrane conductance regulator (CFTR) channels, and one basolateral membrane channel permeability, CaKCs. Changes in membrane permeabilities drive ion and water movement, modulating ASL height. The directionality of ion flux across the membrane of a resting cell is denoted by arrows. ATP and ADO signaling pathways via P2Y2and A2b receptors are denoted in blue and dark green, respectively. Extracellular ATP metabolism is regulated by a network of membrane-bound ectonucleotidases, which are denoted in pink and drawn above the cell due to space restrictions.
BIO
PHYSICS
AND
COMPU
TATIONAL
BIOLOGY
PNAS
the ASL and not transported into the cell or via the paracellular pathway. The cellular compartment also contains an imperme-able osmolyte as previously described (11). The cellular and ASL impermeable osmolyte are each composed of two components: (i) a negatively charged impermeable osmolyte representing neg-atively charged constituents not specifically represented in the model (e.g., bicarbonate and mucins), which maintain the elec-troneutrality of the system, and (ii) an uncharged component, which includes neutral compounds that contribute to the total osmolarity of the compartment, such as glucose.
The activities of the three mobile ions within the ASL were modeled using ion transport equations that capture the molar abundance per unit surface area of each ion within the ASL:
d dtN
A
i =J
p
i −Jia, [3]
whereJipandJa
i are fluxes per unit surface area of ioni(Na+, K+,
or Cl−) via the paracellular pathway and across the apical mem-brane, respectively. The form of the flux term for an ionimoving across the apical (a) or basolateral (b) membrane or through the paracellular (p) pathway from compartment Y toX due to an electrochemical gradient was described by Goldman’s constant field equation (18):
JY→X
i =
pm i ziμ
eziμ−1
aY i −aXi eziμ
, [4]
where pm
i is the permeability of the apical membrane (pai) or
paracellular pathway (pip) (in units of meters per second), zi is
the ion valence of ioni,μ=FVm=RTis the nondimensional
mem-brane potential which is dependent on the Faraday constant (F, in units of coulombs per mole), Vm=Va and Vm=Vb are the
apical or basolateral membrane potential (in units of volts), re-spectively, Ris the gas constant (in units of joules per mole× kelvin), T is the absolute temperature (in units of kelvin), and aiis the activity of ioniin each compartment. Membrane
poten-tials (Vm), which are functions of ion currents, were calculated as
in ref. 11 with one exception. The paracellular ion current (Ip) is a
function of the paracellular fluxes of the three mobile ions cap-tured by our model and was described by the following equation:
Ip=F−JNap ++JClp+−JKp+
. [5]
The permeability of the membrane (pm
i ) is dependent on both
the number of ion channels in the membrane and the probability that a given channel is open. The probability of a channel’s being
open is regulated by signaling pathways initiated by extracellular ATP and ADO. To model the effect of purinergic signaling on the permeabilities of ion channels we used phenomenological mathematical relations based on Hill functions. Because these general functional forms were sufficient for the model to capture the experimental data, we did not investigate more complicated mathematical relationships. Extracellular ATP activates chloride secretion by increasing the permeability of apical CaCCs and the CF transmembrane conductance regulator (CFTR). The perme-ability due to CaCCs is described by the following expression:
pCaCC=pmaxCaCC
.h
1+KATP CaCC
½ATPn
ATP
CaCCi, [6]
wherepCaCCis the apical permeability to chloride due to CaCC
(in units of meters per second), pmax
CaCC is the maximum CaCC
permeability (in units of meters per second),KCaCC is the
con-centration (in micromolar) of ATP at which the permeability is half its maximum, andnCaCCis the Hill coefficient.
CFTR-mediated Cl transport is activated both by ATP and ADO, which is formed by the hydrolysis of ATP by extracellular enzymes. The permeability of the apical membrane to Cl−due to CFTR channels was described by the following equation:
pCFTR=pmaxCFTR
.h
1+KCFTRADO
½ADOn
ADO
CFTR+KATP
CFTR
½ATPn
ATP CFTRi
,
[7]
wherepCFTRis the apical permeability to chloride due to CFTR
channels (in units of meters per second),pmax
CFTRis the maximum
CFTR channel permeability (in units of meters per second), KATP
CFTR is the concentration (in micromolar) of ATP at which
the permeability is half its maximum in absence of ADO, KADO
CFTR is the concentration (in micromolar) of ADO at which
the permeability is half its maximum in absence of ATP, and nATP
CFTRandnADOCFTRare the Hill coefficients. In simulations of CF,
pCFTRwas assumed to be zero.
Apical membrane-localized calcium-activated voltage-dependent potassium channels (BKs) transport K+out of epithelial cells and are regulated by ATP as follows:
pBK=pmaxBK
b1+ðKBK=½ATRÞnBKc, [8]
where pBK is the apical permeability to potassium (in units of
meters per second),pmax
BK is the maximum apical potassium
per-meability (in units of meters per second),KBK is the
concentra-tion (in micromolar) of ATP at which the permeability is half its maximum, andnBK is the Hill coefficient.
Variables and units Description
HC, m Cell height
NaC, mol/m2 Cellular molar abundance of sodium ions per unit cell culture surface area
KC, mol/m2 Cellular molar abundance of potassium ions per unit culture surface area
ClC, mol/m2 Cellular molar abundance of chloride ions per unit culture surface area
Va, V Apical membrane potential
Vb, V Basolateral membrane potential
HA, m ASL height
NaA, mol/m2 ASL molar abundance of sodium ions per unit cell culture surface area
KA, mol/m2 ASL molar abundance of potassium ions per unit culture surface area
ClA, mol/m2 ASL molar abundance of chloride ions per unit culture surface area
ATPA,μM ASL concentration of adenosine triphosphate
ADPA,μM ASL concentration of adenosine diphosphate
AMPA,μM ASL concentration of adenosine monophosphate
ADOA,μM ASL concentration of adenosine
The permeability of the apical membrane to sodium ions is pri-marily governed by the epithelial Na+channel (ENaC). In normal airway cells, Na+absorption is inhibited by extracellular ATP, via activation of P2Y2receptors, which hydrolyze phosphatidylinositol PIP2, an anionic phospholipid demonstrated to regulate ion chan-nels and transporters (5, 6). Additional evidence suggests ENaC inhibition both by ADO-activated CFTR channels via protection from proteolytic cleavage (19) and decreasing total available ENaC protein levels (20). To describe the dynamic permeability of ENaC in response to extracellular purinergic signals (pENaC) under normal
and CF equations, we used the following equations:
pNLENaC=pmaxENaC
.h
1+½ATPKENaCATP
nATP ENaC+½
ADOKENaCADO
nADO ENaC
i
[9]
pCFENaC=pmaxENaC
.h
1+½ATPKENaCATP
nATP ENaCi
, [10]
wherepNL
ENaCandpCFENaCare the apical permeability to sodium due
to ENaCs in normal and CF airway cells (in units of meters per second), respectively, pmax
ENaC is the apical sodium permeability
through ENaCs in absence of extracellular ATP and ADO (in units of meters per second),KATP
ENaCandKENaCADO are the
concentra-tions (in micromolar) of ATP and ADO, respectively, that gen-erate half the maximum permeability, andnATP
ENaCandnADOENaC are
the Hill coefficients. In simulated CF cells, which lack ADO-activated CFTR channels which normally inhibit ENaCs, we as-sumed no ENaC inhibition via ADO.
Within the basolateral membrane, CaKCs are coupled to the intracellular calcium concentration (8), which is regulated by extracellular ATP. To describe this coupling, we used the fol-lowing equation:
pCaKC=pmaxCaKC
b1+ðKCaKC=½ATPÞnCaKCc, [11]
wherepCaKCis the basolateral permeability to potassium (in units
of meters per second),pmax
CaKCis the maximum basolateral
potas-sium permeability due to CaKCs (in units of meters per second), KCaKC is the concentration (in micromolar) of ATP at which the
permeability is half its maximum, andnCaKCis the Hill coefficient.
Also in the basolateral membrane is a non-CFTR Cl− con-ductance. In addition, two types of transporters are localized to the basolateral membrane that function to maintain membrane potentials and intracellular ion activities: sodium–potassium pumps and Na-K-2Cl cotransporters. The basolateral sodium– potassium pump was modeled as previously described (11). There are several available microscopically detailed models of the Na-K-2Cl cotransporter (21–23), and we elected to implement the model reported by Marcano et al. (22). The paracellular pathway connects the ASL to the basolateral compartment and is perme-able to Na+, Cl−, and K+ as well as water and was modeled as previously described (11).
The descriptions of the dynamic concentrations of ATP and ADO were based on a model of nucleotide regulation (24, 25) that captures ATP dephosphorylation to ADP, AMP, and ADO and ADO deamination to inosine. Additionally, the nucleotide regulation model includes terms for ATP, ADP, and AMP release as well as cellular uptake of ADO and inosine through CNT3 proteins. The full set of ASL model equations and the parameter values and estimation method are described in Tables S1–S3, Parameter
Esti-mation, andASL Model Equations.
Results
Model Evaluation: Resting Normal Airway Cells.We performed pa-rameter estimation by simultaneous fitting of the model to steady-state and time-series data obtained from experiments with normal and CF human airway epithelium (Experimental Data). Our model showed good agreement with steady-state ion con-centrations and ASL and cellular height data from both normal and CF epithelium studied under static conditions where ATP levels are low (<2 nM) and ADO levels ∼100–200 nM (Fig. 2 andFig. S1).
In resting normal airway epithelium, a steady-state ASL height of∼7μm is maintained through a complex balance of ion fluxes across the cell membranes and through the paracellular pathway
[K+]
A= 30 mM [Na+]A= 116 mM [Cl-]A= 105 mM
[K+]
C= 105 mM [Na+]C= 30 mM [Cl-]C= 57 mM
HeightASL= 7.6 μm
DFK+
A= 8 mV DFNa+A= -63 mV DFCl-A= -11 mV
DFK+
B = 41 mV DFNa+B = -80 mV DFCl-B = -19 mV
DFK+ P = 35 mV
DFNa+ p = -17 mV
DF Cl-P = -16 mV
[Cl-] A= 99 mM
[K+]
C= 107 mM [Na
+]
C= 27 mM [Cl-]C= 60 mM
HeightASL= 3.5 μm
DFK+
A= 3 mV DFNa+A= -68 mV DF
Cl-A= -15 mV
DFK+
B = 41 mV DFNa+B = -83 mV DFCl-B= -21 mV
DFK+ P = 38 mV
DFNa+ p = -16 mV
DF Cl-P = -16 mV JBK JENaC JCFTR JCaCC
JCaKC
JKp
JNap
JClp JKp
JNap JClp
JClb J
Clb
Jpump Jco
JBK JENaC JCaCC
JCaKC
Jco Jpump
Normal Airways
-0.01 2.9 -0.22
-2.2 1.0 -0.14
-0.01 2.9 -0.22
-0.005 0.65 -0.98 -0.01
-1.4 0.59 0.41 -0.09
-0.005 0.65 -1.0
CF Airways
[K+]
A= 33 mM [Na+]A= 116 mM ASL
CELL
BASOLATERAL ASL
CELL
BASOLATERAL
0.18
Fig. 2. Predicted ion fluxes and driving forces in resting normal (Left) and CF (Right) airway cells. Orange, yellow, and purple arrows denote movement of K+, Na+, and Cl−ions, respectively, in units of micromoles per second×square meters. Ion electrochemical driving forces (DF) across the apical and basolateral membranes and the paracellular pathway were calculated as the difference of the total potential of the given electrical membrane and equilibrium potentials for the respective ion. Values to which the model were fit are denoted by square boxes. All other values are mean predictions of the model using 2,000 parameter sets obtained using a Monte Carlo method (detailed inParameter Estimation).
BIO
PHYSICS
AND
COMPU
TATIONAL
BIOLOGY
PNAS
tion into the ASL and basolateral uptake into the cell via the Na-K-2Cl cotransporter. Our model predicts that the largest ion flux across the normal apical cellular membrane is cellular Cl− secretion onto the airway surface through CFTR channels. A smaller Cl−efflux occurs via CaCCs. The net Cl−absorption at the basolateral membrane results from the inward movement of two chloride ions through Na-K-2Cl cotransporters (Jco) for
ev-ery one chloride ion excreted from the cell through basolateral chloride channels (JbCl).
In normal cells, the dominant Cl−flux is balanced in part by a net flux of Na+ cycling in the opposite direction as chloride. Sodium is absorbed from the ASL into the cell through ENaCs contained within the apical membrane. This absorption is bal-anced by a net extrusion of Na+from the cell across the baso-lateral membrane. To achieve net Na+ extrusion, three molecules of Na+are extruded through the Na–K pump (Jpump)
for every one Na+cation trafficked inwards through the Na-K-2Cl cotransporter (Jco). The result is a net flux of Na+from the
cell to the basolateral compartment.
The model predicts that potassium ions, K+, cycle in the same directions as chloride. Across the apical membrane, potassium is secreted through BK channels at a rate less than that of the total apical chloride flux. The activation of the BK conductance drives apical membrane potential (Va) to hyperpolarize, increasing driving forces for both Cl− secretion and Na+ absorption. To maintain steady-state potassium concentrations in the ASL, potassium exits the ASL via the paracellular pathway into the basolateral compartment. Across the basolateral membrane, three modes of potassium transport contribute to net potassium flux (i): conductive po-tassium transport, (ii) Na–K ATPase pumps, and (iii) Na-K-2Cl cotransporters. Net cellular potassium uptake is achieved by uptake of K+ions through the Na–K pump (Jpump) and the
Na-K-2Cl cotransporter (Jco), which would be at an excess in the cell
if not for the conductive extrusion of potassium out of the cell through basolateral potassium channels (Jb
K).
Model Evaluation: Resting CF Airway Cells.In CF, the CFTR protein is either functionally defective or is completely missing, depending on the genetic mutation(s) in the CFTR gene. We first simulated CF conditions by setting the CFTR Cl− permeability to zero. However, this change to the model was not sufficient to reproduce the experimentally observed steady-state conditions in CF human airway epithelium. This observation is in agreement with a recent mathematical model of CF airway cells in a perfused Ussing chamber, which required increased apical Na+and basolateral K+ and Cl−permeabilities, increased Na–K pump, and decreased Na-K-2Cl cotransporter fluxes, in addition to absent CFTR Cl−fluxes to model CF physiology (12). Accordingly, we performed pa-rameter estimation keeping CFTR Cl−permeability at zero and allowing all other parameters to change relative to normal con-ditions to investigate which additional changes were necessary to fit our CF ASL model to experimental data (Fig. 2,Right). The steady-state height (volume) of the ASL under static conditions in CF airways was about half that of normal airways but CF ASL composition remained isotonic (Fig. 2, Right). As expected, the model predicted that the net cycle of Cl−was reduced in CF cells. This net reduction was the result of a reduced secretion of Cl− across the apical membrane which was limited to secretion through CaCCs in simulated CF cells (JCaCC, Fig. 2,Right). To
maintain a steady-state Cl−concentration in the ASL, the model predicted reduced cellular Cl−secretion balanced by a reduced flux of Cl−ions through the paracellular pathway. A steady-state intracellular Cl−concentration was maintained by a decrease in the net absorption of Cl−across the basolateral membrane. The model predicted that conductive basolateral chloride secretion modestly increased and cellular uptake of Cl− via Na-K-2Cl
cotransporters was reduced in CF, resulting in a reduced net uptake of Cl−via the basolateral membrane.
In contrast to normal cells, our model predicted that Na+flux is the predominant apical membrane ion flux in CF cells, and that this flux is greater in magnitude compared with normal cells. To maintain a steady-state ASL Na+ concentration, the increased sodium absorption drives an increased paracellular Na+flux, as more Na+is moved from the basolateral compartment into the ASL (JNap, Fig. 2,Right). In CF, the steady-state cellular
concen-tration of Na+is maintained in normal ranges by an increased flux through the Na-K ATPase pump, which moves a greater quantity of Na+out of the cell. Additionally, the inward flux of the Na-K-2Cl cotransporter was reduced. The net result is an overall in-crease in net sodium extrusion across the basolateral membrane. The model predicts that potassium fluxes are also disturbed in CF cells, although disturbances occur at relatively lower magni-tudes compared with sodium and chloride fluxes. An increase in potassium secretion across the apical membrane (JBK, Fig. 2,
Right) is predicted to offset in part the increased Na+absorption. The steady-state ASL concentration of K+ is balanced by an increased paracellular K+ flux. To maintain a steady-state in-tracellular K+concentration, the net absorption of K+across the basolateral membrane was increased. This net increase was predicted to primarily reflect the increase in Na–K pump activity (Jpump, Fig. 2,Right), which drives K+into the cell.
Collectively, the model predicts that at rest CF cells exhibit re-duced chloride secretion, increased sodium absorption and an in-crease in potassium secretion, and a volume-depleted, isotonic ASL.
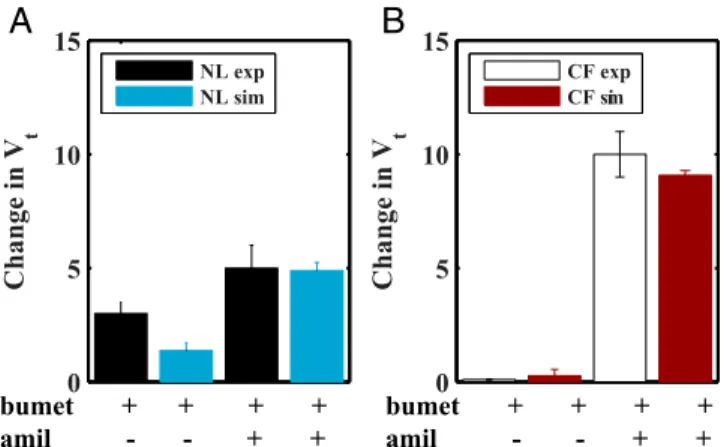
Model Validation.To test our model we simulated blocking ion channels with pharmacological agents and compared those out-puts to experimental data (Fig. 3). The contribution of Na+and Cl− transport to transepithelial potential (Vt) in NL and CF airway cells has been measured by the administration of bume-tanide or bumebume-tanide and amiloride, respectively, and reported to differ in normal vs. CF airway epithelia (Fig. 3). Bumetanide blocks the basolateral sodium–potassium–chloride cotransporter that provides cellular Cl−for secretion. To simulate bumetanide block, the flux through the transporter was set to zero (Jmax
co =0),
which reduced basolateral chloride uptake, lowered intracellular chloride concentrations, and inhibited apical chloride secretion. In normal cells, simulated block with bumetanide led to a small
0 5 10 15
Change in V
t
NL exp NL sim
0 5 10 15
Change in V
t
CF exp CF sim
bumet + + + + amil - - + +
bumet + + + + amil - - + +
A
B
Fig. 3. Model simulation of disruption of ion transport pathways in (A) normal and (B) CF airway epithelia. Experimental data for normal and CF airway epithelia are denoted by black and white bars, respectively. Simu-lated addition of bumetanide (bumet) alone or with amiloride (amil) for normal and CF airway epithelia are denoted by blue and red bars, re-spectively. Bars represent mean values for experimental data. Model pre-diction bands denote mean and±2 SDs (dotted lines) of the mean using 2,000 parameter sets obtained using a Monte Carlo method (detailed in
decrease in the transmembrane potential magnitude due to the reduction in apical Cl− secretion, somewhat smaller than ob-served experimentally (3) (Fig. 3A). In experiments with CF airway epithelia with little apical Cl− secretion, blocking with bumetanide had little impact on Vt, and the model accurately captured these data (3) (Fig. 3B).
Amiloride blocks apical sodium channels, which was simulated in our model by setting the apical ENaC sodium permeability to zero (pNL
ENaC=0 or pCFENaC=0). Amiloride exposure alone can
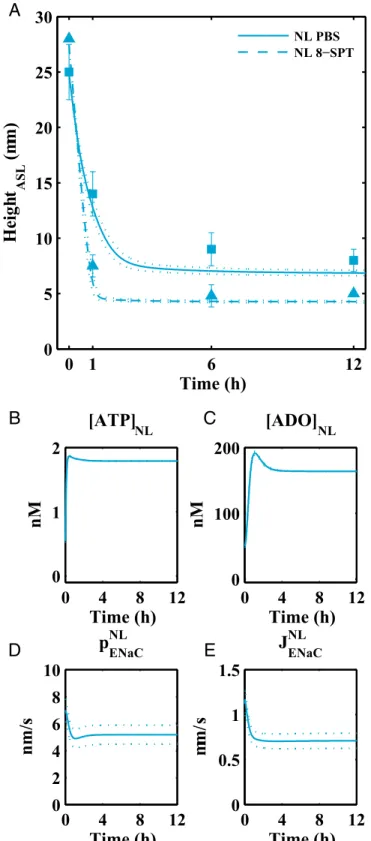
underestimate the block of Na+absorption in normal cells be-cause increases in apical driving forces for Cl−are produced that generate accelerated Cl− secretion. Accordingly, the effects of amiloride on Na+transport are experimentally tested by expos-ing cells to bumetanide (to limit induced Cl−secretion) followed by amiloride. The model captured in normal airway epithelia the observed experimental changes in transepithelial electrical po-tential difference via“blocking”with amiloride and bumetanide (Fig. 3A, blue). Sodium absorption is the major contributing variable to Vtin CF cells, and in accordance with experiments, the change in Vtafter simulated block with amiloride was much greater in CF relative to normal airway epithelia (Fig. 3B, red). Model evaluation of regulation of ASL volume by extracellular nucleotide/ nucleosides. To evaluate the parameters in the expressions cou-pling purinergic signals in the ASL to ion transport we fitted the model first to experiments in which nucleotide concentrations were reduced. When 20 μL of isotonic fluid, such as PBS, is applied to human airway epithelial cells under“thin-film”(7μm) conditions, the ambient 1μL of ASL is acutely diluted/expanded, following which airway epithelia rapidly absorb the added fluid. The model reproduced the experimental maneuver (Fig. 4A) and described volume-induced dilution of ATP (Fig. 4B) and ADO concentrations in the ASL (Fig. 4C) following volume (PBS) addition. Dilution of ATP/ADO acutely increased the Na+ per-meability and flux absorption through ENaCs (Fig. 4DandE), decreased Cl− secretion, and generated osmotic gradients fa-voring fluid absorption from the ASL into the cell and, ulti-mately, to the basolateral compartment to restore the pre-PBS ASL height of 7μm (Fig. 4A, solid blue line).
We also validated the model by testing for the effects of puri-noreceptor activity on the pattern of ion transport. It is thought that normal airway epithelia under resting conditions metabolize most ATP to ADO and use ADO to maintain the 7-μm ASL heights. This notion has in part arisen from the observations that (i) ADO is the major purine nucleoside in ASL under static conditions and (ii) blocking activation of A2b receptors by ADO using eight-SPT reduced ASL height in normal airway epithelia (26). We simulated A2b receptor block by increasing the Michaelis–Menten constants associated with ADO activation. In the“absence”of ADO activation of A2b and consequent absence of CFTR activation and ADO inhibition of ENaC, the model captured the more rapid rate of absorption and reduced steady-state ASL height observed experimentally in normal cells follow-ing A2b blocker addition (Fig. 4A, dotted blue line).
Modeling in vivo ASL conditions.In vivo there is phasic motion during tidal breathing that imposes stresses on airway surfaces that are not captured by static cell culture conditions. However, tidal breathing can be mimicked in vitro via experimental systems that apply cyclic compressive stress (CCS) to cultures (3). These ex-periments have shown CCS-induced shear stresses (i) increase the rate of ATP release into the ASL, (ii) increase ASL volume se-cretion via activation of CFTR and CaCCs and inhibition of ENaCs, and (iii) that the response of ASL height to CCS quanti-tatively differs between NL and CF airway epithelia. We simulated
0 1
6
12
0
5
10
15
20
25
30
Time (h)
Heigh
t
ASL(m
m)
NL PBS NL 8−SPT
0
4
8
12
0
1
2
nM
[ATP]
NLTime (h)
0
4
8
12
0
100
200
nM
[ADO]
NLTime (h)
0
4
8
12
0
2
4
6
8
10
nm/s
p
ENaCNLTime (h)
0
4
8
12
0
0.5
1
1.5
mm/
s
J
ENaCNLTime (h)
A
B
C
D
E
Fig. 4. Model results for isotonic liquid addition to normal cells.Ashows experimental data (blue squares denote isotonic volume addition; blue tri-angles denote isotonic volume addition with eight-SPT) and corresponding model fits for changes in ASL height over time in normal cells for isotonic solution addition (solid) and simulated blocking of ADO receptors by eight-SPT (dashed).BandCshow predicted recovery of ATP and ADO concen-trations following dilution by the addition of an isotonic solution in normal cells, respectively.Dshows model results for the apical membrane sodium permeability in normal cells.Edepicts model results for the sodium flux through apical ENaC channels in normal cells. Symbols (squares and trian-gles) denote mean experimental data and error bars represent SD.
Pre-diction bands denote mean and±2 SDs (dotted lines) of the mean using 2,000 parameter sets obtained using a Monte Carlo method (detailed in
Parameter Estimation).
BIO
PHYSICS
AND
COMPU
TATIONAL
BIOLOGY
PNAS
addition of 20μL PBS followed by 3 h of CCS-mediated shear stress by increasing the rate of ATP release to a rate that achieves a concentration of 40 nM ATP in ASL. This ATP level closely mimics the concentration of ATP that was experimentally mea-sured after CCS shear stress was delivered at a magnitude mim-icking that experienced during normal tidal breathing (26).
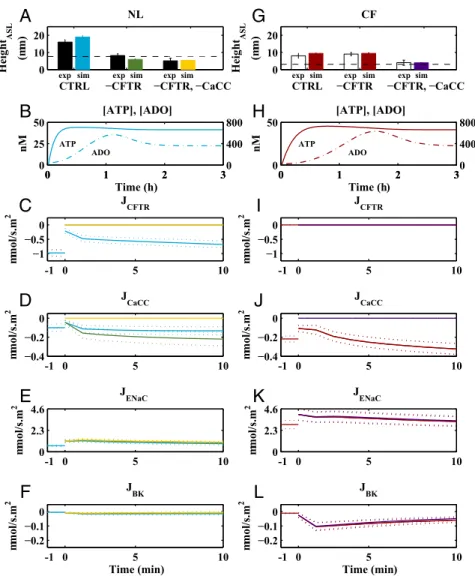
The model accurately captured steady-state changes in ASL volume (height) after isotonic fluid addition under CCS condi-tions in normal and CF cells (Fig. 5). At time 0, upon addition of PBS, nucleotide concentrations are depleted. The model then predicts that CCS-induced increases in extracellular ATP con-centration (Fig. 5B) are sufficient to activate Cl− secretion by CFTR (Fig. 5C) and CaCCs (Fig. 5D) and inhibit Na+absorption by ENaCs (Fig. 5E) in normal cells. Additionally, apical potas-sium channels were activated, increasing K+secretion (Fig. 5F). After a few minutes, a fraction of the increased ATP was hy-drolyzed to ADO (Fig. 5B), which, in normal cells, further ac-tivated CFTR (Fig. 5C), resulting in additional Cl− secretion. The steady-state effect of increased ATP release due to CCS was to maintain ASL heights of∼14 μm in normal epithelia. Based on recent biophysical models of the airway surface compartment,
we predict the liquid in excess of 7 μm on normal epithelial surfaces will be“stored”in the mucus layer (27).
CCS postisotonic fluid addition resulted in a steady-state ASL height in CF epithelia of 7μm (Fig. 5G). The smaller ASL height in CF than in normal epithelia reflected the absence of regulated CFTR Cl−secretion and the increased rate of Na+net absorption. Importantly, the CCS-induced increase in ATP release rates produced, via activation of CaCCs, an ASL height in CF epithelia (∼7 μm) consistent with adequate hydration to sustain mucus transport. These results are consistent with data that decreased MCC in CF is heterogeneous, with many areas of the CF lung exhibiting apparently normal mucus transport in areas where airflow is preserved and CCS-induced ATP release operative (28). We tested the notion that the reduced ASL height response to CCS reflected the absence of CFTR Cl−secretion by running simulations in normal cells under CCS-exposed CFTR channel inhibitors (−CFTR, Fig. 5A). Under these conditions, the ASL height fell to∼7μm, mimicking CF cells under CCS. This de-crease in normal airway ASL height under CCS conditions reflected the absence of CFTR-mediated Cl− secretion across the apical membrane coupled to persistent ATP-mediated
CTRL −CFTR −CFTR, −CaCC
0 10 20
Height
ASL
(m
m)
CTRL −CFTR −CFTR, −CaCC
0 10 20
Height
ASL
(m
m)
-1 0 5 10
0 2.3 4.6
mmol/s.m
2
J
ENaC
-1 0 5 10
0 2.3 4.6
mmol/s.m
2
J
ENaC
-1 0 5 10
−0.2 −0.1 0
mmol/s.m
2
JBK
Time (min) -1 0 5 10
−0.2 −0.1 0
JBK
mmol/s.m
2
Time (min)
-1 0 5 10
−1 −0.5 0
mmol/s.m
2
J
CFTR
-1 0 5 10
−1 −0.5 0
J
CFTR
mmol/s.m
2
-1 0 5 10
−0.4 −0.2 0
mmol/s.m
2
J
CaCC
-1 0 5 10
−0.4 −0.2 0
J
CaCC
mmol/s.m
2
0 1 2 3
0 25 50
Time (h)
nM
[ATP], [ADO]
ATP ADO
0 1 2 30
400 800
0 1 2 3
0 50
Time (h)
nM
[ATP], [ADO]
ATP
ADO
0 1 2 30
400 800
exp sim expsim expsim expsim expsim expsim
A
B
C
D
E
F
H
I
J
K
L
G
Fig. 5. Effect of CCS-induced ATP release on normal (Left) and CF (Right) airway epithelia. Normal (A–F) and CF (G–L) models were simulated in response to isotonic fluid addition and increased ATP release at time=0 (blue and red, respectively), increased ATP release without CFTR function (green and red, re-spectively), and increased ATP release without CFTR and CaCC function (yellow and purple, respectively). Channel responses (CFTR, CaCC, ENaC, and BK) for each simulation are illustrated in panelsC–F(NL) andI–L(CF). In the topmost panels (AandG), experimental data (NL in black and CF in white) are depicted where error bars represent SDs. The black dashed lines inAandGdenote steady-state ASL height in absence of CCS (Fig. 2). Prediction bands inB–FandH–L
inhibition of sodium absorption. To test the requirement for Cl− secretion to maintain ASL height of 7 μm in CFTR-blocked normal cells we simulated block of both CaCC and CFTR channels (−CFTR and −CACC, Fig. 5A). The resulting ASL height was 3μm. Note that CCS did inhibit ENaC (Fig. 5E) via ATP–P2Y2 receptor mechanisms, but the resulting reduction in Na+absorption was not sufficient to overcome the complete block of Cl−secretion in normal cells with CaCC and CFTR channel blockers. Accordingly, blocking all apical Cl−secretion in normal cells after isotonic fluid addition under CCS produced an ASL height below steady-state values observed in static normal cultures. The result occurred despite persistent ENaC inhibition, demon-strating the need for some Cl−secretory capacity to generate ASL. We next tested the role of CaCC in maintaining the ASL height in CCS-exposed CF cells. In simulated CF cells under CCS, CFTR channel inhibitors did not alter ASL height compared with CCS alone, as expected (Fig. 5G). In the presence of both the CFTR and CaCC inhibitors, a large reduction in ASL volume resulted, reflecting a complete block of apical Cl−secretion.
Simulation of CF pulmonary exacerbations.It has been observed ex-perimentally that respiratory tract viral infections (e.g., respiratory syncytial virus up-regulates extracellular ectonucleotidases) reduce ASL ATP concentrations and reduce ASL volume in cultured CF epithelia under CCS conditions (26). Based on these findings, it has been speculated that local virally induced ATP depletion, ASL collapse, and failed mucus clearance may trigger CF lung disease exacerbations (29). Accordingly, we simulated the effects of in-duced ecto-ATPase up-regulation by the addition of increased ectonucleotidase activity to our model.
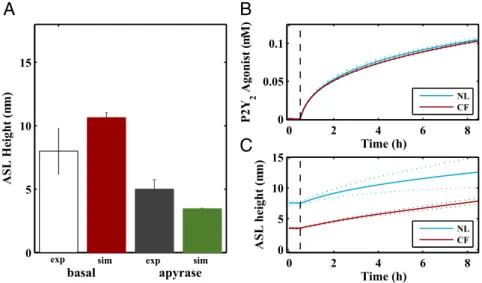
Apyrase is an ectonucleotidase that can be experimentally added to ASL to increase the rate of ATP conversion to AMP. Notably, apyrase depletes CF airway epithelial ASL of ATP and reduces basal ASL height under CCS conditions (26). We simulated apyrase additions to ASL by increasing theVmaxvalues related to ATP and ADP hydrolysis. In simulated CF cells under basal CCS conditions (Fig. 6A, red bar), the height of the ASL decreased with apyrase treatment (Fig. 6A, green bar), as observed experimentally. As CF cells lack both ADO-mediated signaling of CFTR activation and ENaC inhibition observed in normal cells, they are particularly vulnerable to depletion of the sole active purinoceptor agonist, ATP. Thus, the model captured a potential mechanism for the
collapse in MCC that may be a feature of some virus-induced CF exacerbations.
Rehydration Mechanism for CF Airways.Based on the observation that CCS-induced increases in ATP release produce ASL heights in CF airway epithelia (7 μm) sufficient to mediate normal mucus transport (Fig. 5G), aerosolized nucleotides have been proposed as therapy for CF patients. To slow the hydrolysis of nucleotides, and prevent ADO formation, a slowly hydrolyzing pyrimidine-based P2Y2 receptor agonist, Denufosol, was de-veloped (30, 31). To achieve drug concentrations on lower airway surfaces sufficient to activate P2Y2receptors for approximately 8 h after administration, high concentrations of Denufosol (15 mg/mL) were delivered from nebulizers over 15-min inter-vals. After promising phase-II studies, Denufosol was not found to have sufficient clinical benefit for approval. Subsequent studies suggested that the high initial deposited dose caused P2Y2-receptor desensitization, limiting airway surface hydration to short intervals (4). This observation raised the question of whether Denufosol administered over a prolonged period, at a dose designed to achieve activity but lower than P2Y2-receptor desensitizing concentrations, would restore the ASL height.
Recent advances in drug delivery technology have led to trans-nasal aerosal delivery devices, which allow for administration of drugs through nasal passages over an extended period (e.g., while a patient is sleeping). To test whether low-dose, prolonged transnasal aerosol delivery of Denufosol might be therapeutically effective, we first developed an ordinary differential equation model of Denu-fosol metabolism and transnasal delivery to the airway surface (Table S4andDenufosol Model). We used this model to predict the quantity of Denufosol in the transnasal delivery device necessary to maintain 100 nM of drug on the airway surface, which is close to the EC50value of P2Y2receptor and should avoid desensitization (31) (Fig. 6B). The concentration of a Denufosol solution in the trans-nasal delivery device, with a delivery rate of 32μL/min and a de-position efficiency of 40% into a 10-mL ASL volume, required to achieve this concentration was calculated to be 5μM.
Next, we asked how this prolonged administration of low-dose Denufosol would impact ASL height in simulated normal and CF airway surfaces. For this simulation, we coupled our model of Denufosol delivery to our model of purinergic regulation of ASL
0 5 10 15
ASL Height (m
m)
0 2 4 6 8
0 5 10 15
Time (h)
ASL height (
mm)
NL CF
0 2 4 6 8
0 0.05 0.1
Time (h)
P2Y
2
Agonist (
mM)
NL CF
A
B
C
exp sim exp sim
basal apyrase
Fig. 6. Model results for airway surface height during acute exacerbations and therapeutic purinoreceptor agonist administration.Ashows experimental data and corresponding model fits for basal ASL height during CCS and CF exacerbation-induced increased ectonucleotidase activity under CCS conditions. White and gray bars denote mean experimental data, and error bars represent SD. Model fits denote mean (red and green bars) and±2 SDs using 2,000 parameter sets (detailed inParameter Estimation).Bshows the concentrations of a slowly hydrolyzing P2Y2receptor agonist on normal and CF airway surfaces delivered via a nasal prong device.Cdepicts the change in ASL heights (normal in blue and CF in red) following P2Y2-receptor agonist administration.
BIO
PHYSICS
AND
COMPU
TATIONAL
BIOLOGY
PNAS
equations similar to ATP (i.e., in Eqs.6–11, [ATP] was replaced by [ATP] + [Denufosol]). Simulated administration of a low-dose continuous Denufosol (Fig. 6B) modestly raised the ASL height in normal epithelial cells (Fig. 6C, blue line) while restoring ASL height in CF epithelial cells (Fig. 6C, red line). CF airway surfaces are heterogeneous with respect to disease expression, meaning the volume of ASL in vivo varies within the pulmonary system. Our model predicts that a P2Y2receptor-agonist therapy is effective on CF cells but would not likely flood regions with more normal ASL heights.
Discussion
Airway epithelia dynamically regulate ASL volume to optimize mucus transport by balancing hydration of secreted mucus with minimization of ASL volume (height) to reduce airflow sistance. A systems-level understanding of ASL homeostasis re-quires a model that accurately describes the dynamic coupling between purinergic signaling and ion/water transport. This dy-namic regulation of ASL volume by soluble purinergic mediators contained within ASL has not been previously modeled.
Accordingly, we developed a model of airway liquid homeostasis regulated via purinergic signaling. Notably, the permeabilities of sodium, chloride, and potassium ions were coupled to the extracel-lular concentrations of ATP and ADO. Model parameters were estimated by fitting the model to experimental data from ATP- and ADO-mediated changes to ASL height in human bronchial epithe-lial cells from normal subjects and CF patients. The model was validated by comparing model simulations to experimental data describing the effects of ATP/ADO dilution and ENaC, cotrans-porter, and A2b receptor block. Our model is consistent with the experimental observations that ATP and ADO signaling modulates Na+ and Cl− ion transport and regulates surface liquid volume (height) on airway epithelial surfaces (26).
With respect to disease pathogenesis, our model predicted that an isotonic ASL of∼7μm in normal and∼3μm CF cells under resting (static) conditions was associated with low extracellular ATP (2 nM) and higher ADO (∼200 nM) concentrations. Both decreased Cl−secretion and increased Na+absorption contributed to the decrease in ASL height in CF. Potassium secretion across the apical and basolateral membranes via conductive transport was also predicted to be disrupted in CF cells. Importantly, the model reproduced the low ASL volume (“dehydration”) without significant perturbation of the transepithelial potential difference that has been demonstrated to be characteristic of CF bronchial epithelia in in vitro conditions (3).
Under conditions reprising those in vivo, for example phasic motion and associated mechanical forces/shear-induced ATP release, ASL height rose in normal and, significantly less, CF airway epithelia, as observed in in vitro experiments (26). Both responses reflected increased ATP release. In normal epithelia, the ATP activation of P2Y2and ADO activation of A2b recep-tors produced inhibition of ENaC, activation of CaCCs and CFTR, and increased ASL volume. In CF epithelia, the smaller increase in ASL height in response to phasic motion reflected the sole dependence of ASL height on ATP-P2Y2receptors, and not ADO-A2b-CFTR pathways. However, the ASL effects were sufficiently large in CF to predict relatively normal mucus transport as observed in“normal”regions of CF lungs (28).
frequency and severity of acute exacerbations. The triggers for exacerbations are multiple but are likely dominated by viral in-fections. We have speculated that acute exacerbations reflect failure of mucus transport in areas of viral infection (29). The breakdown of mucus transport reflects the virus-induced up-regulation of ecto-ATPases, reduction in ATP levels, and ASL depletion (26). Our model data quantitatively mimicked this sce-nario and emphasize that the increased severity of viral infections in CF vs. normal individuals reflects the sole dependence of ASL height regulation on ATP in CF, whereas in normal subjects the metabolic product of ectoenzymes (i.e., ADO) is also active in maintaining ASL height during infection. This sole dependence on ATP signaling for ASL height regulation describes in part the vulnerability of CF airways to viral insults.
Finally, we simulated the therapeutic strategy of delivery of a low-dose, prolonged aerosol administration of a slowly hydro-lyzed P2Y2 receptor binding compound, Denufosol. Clinical trials of Denufosol used high doses (concentrations) delivered to the lungs for short time periods via a jet nebulizer and did not produce positive results in phase-3 trials due to suspected P2Y2 receptor desensitization (4, 30, 32). Our model predicts that transnasal delivery of a low dose of Denufosol over prolonged intervals to CF subjects can activate the P2Y2 receptors at a concentration sufficient to increase ASL height but not produce P2Y2 receptor desensitization (31). Collectively, our model of ASL homeostasis suggests prolonged delivery of a low dose of a slowly hydrolyzing P2Y2agonist such as Denufosol as a possible treatment avenue for patients with CF.
In summary, we have developed an integrated model of normal human ASL homeostasis that incorporates both the ion transport and nucleotide/nucleoside pathways important in this process. The model accurately captured experimental data from normal and CF airway epithelia to predict ASL volume and, hence, mucus clearance in health and disease. Our model allows computational analysis of complex regulatory interac-tions involved in airway surface hydration and should provide a starting point for developing novel strategies for treating lung disease.
Methods
Our model consists of 15 differential equations (ASL Model Equations) [and 23 differential equations for P2Y2-agonist simulations (Denufosol Model)]. All simulations were performed in MATLAB using the ode15s solver (33). The model consists of 47 fixed parameters obtained from the literature (Table S1). Values for the free parameters [17 for normal cells and 13 for CF cells (Table S1)] were obtained by sampling parameter space using a Monte Carlo method (11, 34). The goodness of fit between the model and the experi-mental data were determined by calculating the sum of squares differences between the experimental data and model simulations for each candidate parameter set (Figs. S2andS3). Experimental data for ion transport and ASL homeostasis used for model fitting were obtained from the literature; de-tails are inExperimental Data.
ACKNOWLEDGMENTS.This work was supported by postdoctoral training Grant GM00678 from the National Institutes of General Medical Sciences (to C.I.S.), National Institutes of General Medical Sciences Grant GM079271 (to T.C.E.), NIH Grants P30DK065988, P01HL110873, and UH2HL123645 (to R.C.B.), and Cystic Fibrosis Foundation Grant BOUCHE15R0 (to R.C.B.).
1. Boucher RC (2007) Airway surface dehydration in cystic fibrosis: Pathogenesis and
therapy.Annu Rev Med58:157–170.
2. Novak I (2011) Purinergic signalling in epithelial ion transport: Regulation of secretion
and absorption.Acta Physiol (Oxf)202:501–522.
3. Tarran R, Button B, Boucher RC (2006) Regulation of normal and cystic fibrosis
airway surface liquid volume by phasic shear stress.Annu Rev Physiol68:543–
561.
4. Button B, Okada SF, Frederick CB, Thelin WR, Boucher RC (2013) Mechanosensitive
ATP release maintains proper mucus hydration of airways.Sci Signal6:ra46.
5. Ma HP, Saxena S, Warnock DG (2002) Anionic phospholipids regulate native and
expressed epithelial sodium channel (ENaC).J Biol Chem277:7641–7644.
6. Ma HP, Eaton DC (2005) Acute regulation of epithelial sodium channel by anionic
phospholipids.J Am Soc Nephrol16:3182–3187.
7. Manzanares D, et al. (2011) Functional apical large conductance, Ca2+-activated, and
voltage-dependent K+channels are required for maintenance of airway surface liquid
volume.J Biol Chem286:19830–19839.
8. Mall M, et al. (2003) Modulation of Ca2+-activated Cl−secretion by basolateral K+
9. Willumsen NJ, Boucher RC (1989) Activation of an apical Cl−conductance by Ca2+
ionophores in cystic fibrosis airway epithelia.Am J Physiol256:C226–C233.
10. Hartmann T, Verkman AS (1990) Model of ion transport regulation in chloride-secreting airway epithelial cells. Integrated description of electrical, chemical, and
fluorescence measurements.Biophys J58:391–401.
11. Garcia GJ, Boucher RC, Elston TC (2013) Biophysical model of ion transport across
human respiratory epithelia allows quantification of ion permeabilities.Biophys J
104:716–726.
12. O’Donoghue DL, Dua V, Moss GW, Vergani P (2013) Increased apical Na+permeability
in cystic fibrosis is supported by a quantitative model of epithelial ion transport.
J Physiol591:3681–3692.
13. Falkenberg CV, Jakobsson E (2010) A biophysical model for integration of electrical,
osmotic, and pH regulation in the human bronchial epithelium.Biophys J98:1476–1485.
14. Tarran R, Grubb BR, Gatzy JT, Davis CW, Boucher RC (2001) The relative roles of passive surface forces and active ion transport in the modulation of airway surface
liquid volume and composition.J Gen Physiol118:223–236.
15. Novotny JA, Jakobsson E (1996) Computational studies of ion-water flux coupling in
the airway epithelium. I. Construction of model.Am J Physiol270:C1751–C1763.
16. Novotny JA, Jakobsson E (1996) Computational studies of ion-water flux coupling in
the airway epithelium. II. Role of specific transport mechanisms.Am J Physiol270:
C1764–C1772.
17. Warren NJ, Tawhai MH, Crampin EJ (2009) A mathematical model of calcium-induced
fluid secretion in airway epithelium.J Theor Biol259:837–849.
18. Goldman DE (1943) Potential, impedance, and rectification in membranes.J Gen
Physiol27:37–60.
19. Gentzsch M, et al. (2010) The cystic fibrosis transmembrane conductance regulator
impedes proteolytic stimulation of the epithelial Na+channel.J Biol Chem285:
32227–32232.
20. Rubenstein RC, et al. (2011) Regulation of endogenous ENaC functional expression by
CFTR andΔF508-CFTR in airway epithelial cells.Am J Physiol Lung Cell Mol Physiol
300:L88–L101.
21. Weinstein AM (2010) A mathematical model of rat ascending Henle limb. I.
Co-transporter function.Am J Physiol Renal Physiol298:F512–F524.
22. Marcano M, Yang HM, Nieves-González A, Clausen C, Moore LC (2009) Parameter
estimation for mathematical models of NKCC2 cotransporter isoforms.Am J Physiol
Renal Physiol296:F369–F381.
23. Benjamin BA, Johnson EA (1997) A quantitative description of the Na-K-2Cl
co-transporter and its conformity to experimental data.Am J Physiol273:F473–F482.
24. Zuo P, et al. (2008) Mathematical model of nucleotide regulation on airway epithelia.
Implications for airway homeostasis.J Biol Chem283:26805–26819.
25. Garcia GJ, et al. (2011) Computational model for the regulation of extracellular ATP
and adenosine in airway epithelia.Subcell Biochem55:51–74.
26. Tarran R, et al. (2005) Normal and cystic fibrosis airway surface liquid homeostasis.
The effects of phasic shear stress and viral infections.J Biol Chem280:35751–35759.
27. Button B, et al. (2012) A periciliary brush promotes the lung health by separating the
mucus layer from airway epithelia.Science337:937–941.
28. Donaldson SH, et al. (2006) Mucus clearance and lung function in cystic fibrosis with
hypertonic saline.N Engl J Med354:241–250.
29. Boucher RC (2015) On the pathogenesis of acute exacerbations of mucoobstructive
lung diseases.Ann Am Thorac Soc12:S160–S163.
30. Accurso FJ, et al.; TIGER-1 Investigator Study Group (2011) Denufosol tetrasodium in
patients with cystic fibrosis and normal to mildly impaired lung function.Am J Respir
Crit Care Med183:627–634.
31. Yerxa BR, et al. (2002) Pharmacology of INS37217 [P(1)-(uridine 5′)-P(4)- (2′-deoxy-cytidine 5′)tetraphosphate, tetrasodium salt], a next-generation P2Y(2) receptor
ag-onist for the treatment of cystic fibrosis.J Pharmacol Exp Ther302:871–880.
32. Ratjen F, et al.; TIGER-2 Study Investigator Group (2012) Long term effects of
denu-fosol tetrasodium in patients with cystic fibrosis.J Cyst Fibros11:539–549.
33. The MathWorks Inc. (2013) MATLAB and statistics toolbox release 2013a (The MathWorks, Inc., Natick, MA).
34. Battogtokh D, Asch DK, Case ME, Arnold J, Schuttler HB (2002) An ensemble method for identifying regulatory circuits with special reference to the qa gene cluster of
Neurospora crassa.Proc Natl Acad Sci USA99:16904–16909.
35. Willumsen NJ, Boucher RC (1991) Sodium transport and intracellular sodium activity
in cultured human nasal epithelium.Am J Physiol261:C319–C331.
36. Willumsen NJ, Boucher RC (1991) Transcellular sodium transport in cultured cystic
fibrosis human nasal epithelium.Am J Physiol261:C332–C341.
37. Willumsen NJ, Davis CW, Boucher RC (1989) Cellular Cl−transport in cultured cystic
fibrosis airway epithelium.Am J Physiol256:C1045–C1053.
38. Willumsen NJ, Davis CW, Boucher RC (1989) Intracellular Cl−activity and cellular Cl−
pathways in cultured human airway epithelium.Am J Physiol256:C1033–C1044.
39. Knowles MR, et al. (1997) Ion composition of airway surface liquid of patients with
cystic fibrosis as compared with normal and disease-control subjects.J Clin Invest100:
2588–2595.
40. Zimmermann H (1996) Extracellular purine metabolism.Drug Dev Res39:337–352.
41. Picher M, Boucher RC (2000) Biochemical evidence for an ecto alkaline
phosphodi-esterase I in human airways.Am J Respir Cell Mol Biol23:255–261.
42. Matsui H, Davis CW, Tarran R, Boucher RC (2000) Osmotic water permeabilities of
cultured, well-differentiated normal and cystic fibrosis airway epithelia.J Clin Invest
105:1419–1427.
43. Levin MH, et al. (2006) Hypertonic saline therapy in cystic fibrosis: Evidence against
the proposed mechanism involving aquaporins.J Biol Chem281:25803–25812.
44. Lindenmayer GE, Schwartz A, Thompson HK, Jr (1974) A kinetic description for
so-dium and potassium effects on (Na+plus K+)-adenosine triphosphatase: A model for
a two-nonequivalent site potassium activation and an analysis of multiequivalent site
models for sodium activation.J Physiol236:1–28.
45. Danahay H, et al. (2006) Membrane capacitance and conductance changes parallel
mucin secretion in the human airway epithelium.Am J Physiol Lung Cell Mol Physiol
290:L558–L569.
46. Robinson RA (1959)Electrolyte Solutions: The Measurement and Interpretation of
Conductance, Chemical Potential and Diffusion in Solutions of Simple Electrolytes,
ed Stokes RH (Butterworths, London).
47. Willumsen NJ, Boucher RC (1989) Shunt resistance and ion permeabilities in normal
and cystic fibrosis airway epithelia.Am J Physiol256:C1054–C1063.
BIO
PHYSICS
AND
COMPU
TATIONAL
BIOLOGY
PNAS