FROM GARAGE INVENTOR TO GARAGE ENTREPRENEUR
Kevin Anthony Miceli
A dissertation submitted to the faculty of the University of North Carolina at Chapel Hill in partial fulfillment of the requirements of the degree of Doctor of Philosophy in Business Administration from the Kenan-Flagler Business School in the Strategy and Entrepreneurship
area.
Chapel Hill 2016
Approved By: Atul Nerkar Scott Rockart Richard Bettis
ii © 2016
iii
ABSTRACT
Kevin Anthony Miceli: From Garage Inventor to Garage Entrepreneur (Under the direction of Atul Nerkar)
The American garage serves as the backdrop for the image of the independent entrepreneur. However, literature highlights the importance of resources for entrepreneurs that are derived from experience in firms, universities, or markets. This dissertation
investigates how theories from those entrepreneurship studies can be applied in the context of independent (“garage”) invention that results in garage entrepreneurship. In studying the process used by garage entrepreneurs, it elucidates how the technological, social, and
geographical opportunity spaces present in the pre-venture period could affect the decision to form a new venture.
iv
v
Dedicated to my family:
My wife, Caroline,
vi
ACKNOWLEDGEMENTS
Someone once told me that you should write with the end in mind. This section is the last part of my dissertation to be written and I have frequently said that I looked forward to writing such acknowledgments. That excitement and longing was true not only because it meant that I will have written a dissertation at the point, but because I have longed to express my immense gratitude and love for the people who have made this possible. Even before it was done, I have long wanted to recognize their support.
I want to thank my family. In particular, my incredible spouse and partner, Caroline. “Acknowledgments” and “thanks” cannot even begin to express my feelings towards
Caroline as I conclude the PhD. She has supported me whole-heartedly through all of this. It is going on seven years since I told her that I wanted to quit my job, move, and go back to school for a full-time MBA program. And as soon as I got back into school, I thought about staying to earn a PhD. This was not intended to be a two-year/five-year bait-and-switch, even though she will joke about that sometimes. After all this time, I still do not know what to say to her. We have journeyed together through time and space and I believe it has been incredible. Caroline has supported me, kept our lives organized so I could do what I needed, and has been raising our two loving children. She has made everything in our life possible. Certainly this dissertation would not be what it is without her.
vii
The evenings were mostly protected for this reason. They also knew this was temporary and encouraged me with the things we will do “when daddy graduates,” while still offering me smiles, laughter, requests for train time, and enjoyment of our life right now.
While Logan was technically born before I went back to school while I was still working at GE, essentially his entire life so far has been lived with me in school. This journey has been more meaningful to me because he has been with us. Logan has journeyed through all the different cities, states, countries, schools, houses, and apartments. Connor was a gift during the doctoral program. The benefits of academic life were reinforced as I could stay home with him when needed or he could come with me. Connor has come to school with me when necessary, enjoying blue lollipops and the occasional iPad time, and played dinosaurs and trains when we met Atul at his house. He has dissertated with me much more than he realizes.
viii
There have been so many other people during program. My teachers: Atul, Rich Bettis, Nandini Lahiri, Scott Rockart, Chris Bingham, Howard Aldrich, Jeff Edwards, Rich Burton, Ashish Arora, and Wes Cohen. Rich, Howard, Chris, and Scott all served on my dissertation committee and I thank them for their perspectives. Rich brought me into this program, serving as advisor in the first year, and offering many conversations on academia over the years. His mentoring and constant presence has been a gift. Scott is a consummate academic who has provided me countless hours both as an advisor and co-author. I am grateful for his time, knowledge, and the opportunity to work with and learn from him.
I would be remiss without thanking all my friends and colleagues in the program that I spent so much time and conversation with – both productively and unproductively – particularly CH Kim and Tian Chen. This is what I will really remember about my time in on the fifth floor of McColl. I would also like to thank Amol Joshi, Songcui Hu, Susan Cohen, Jim Berry, Virginia Stewart, Deirdre Snyder, Karthik Natarajan, Erin Cooke, Tali Kapadia, Aleks Rebeka, Rajat Khanna, Alex Wilson, and Colleen Cunningham. Each offered friendship and a unique perspective that has helped me during the program.
Finally, I would like to thank my parents, Susan and AJ Miceli. They instilled a love of education and the pursuit of knowledge. They have inspired me throughout my years. And while my father, who is a professor and a tech entrepreneur, would not qualify under my strict definition of garage inventor and garage entrepreneur for this dissertation, he has been a personal model for me throughout my life and I have thought about his professional
ix
remember my mother going back to school to complete her Master’s degree when I was a child. Together, they set me on this path and provided examples of academics before I even knew what I was learning from them. Similarly, I would like to thank my in-laws, Mary Ann and Robert Granahan. They have provided significant support to me and my family through this process which has helped to make this possible and it is greatly appreciated.
To all the other faculty and staff at UNC, I thank you. Additionally, this work has benefitted from the comments of many of these individuals, as well participants at AOM and SMS conferences, CCC Boston, and my job-talks. I thank all those scholars.
x
PREFACE
What if everyone could have one of these amazing machines in their own house? There's just one problem: They're as big as a house. The solution comes in, of all places, a garage in California. Young people with a passion for shaping the future put the power of the computer in everyone's hands. Together, we form a super network that glows with billions of
interactions, and once again we stand on the brink of a new Renaissance.
… For the first time in history, all of us can have a say about the kind of world we want to live in. The choices we have made for the past 30,000 years have been inventing the future one day at a time. And now, it's your turn.
Spaceship Earth, EPCOT
A Garage and an Idea: What More Does an Entrepreneur Need?
Audia and Rider (2005)
xi
TABLE OF CONTENTS
LIST OF TABLES ... xiii
LIST OF FIGURES ... xiv
LIST OF ABBREVIATIONS ... xv
CHAPTER 1: INTRODUCTION ... 1
CHAPTER 2: RESEARCH PHENOMENON ... 4
Classic Debates ... 4
Recent Literature ... 5
Garage Inventor to Garage Entrepreneur ... 10
CHAPTER 3: THEORY AND HYPOTHESIS DEVELOPMENT ... 13
Social Opportunity Space ... 13
Technological Opportunity Space ... 15
Geographical Opportunity Space ... 17
Experience ... 18
CHAPTER 4: DATA AND METHODOLOGY ... 20
Sample and Data ... 20
Model Specification ... 23
Dependent Variable ... 24
Independent Variables ... 24
Controls ... 28
xii
Summary Statistics ... 31
Main Results ... 32
Subsample Analyses ... 35
Alternative Specifications ... 38
CHAPTER 6: DISCUSSION AND CONCLUSION ... 41
Contributions ... 41
Limitations and Future Directions for Research ... 43
Implications ... 45
TABLES ... 47
FIGURES ... 63
APPENDIX: COMPANY VERIFICATION ... 68
Identification ... 68
Example Search Process and Vignettes ... 71
Paice, LLC ... 71
Denecke, Inc. ... 73
Braintexter Inc. ... 74
Dietrick Sports Products ... 74
Stamps.com, Inc. ... 75
Metcast Associates ... 76
3Sixty Technologies, LLC ... 79
Innovative Sports, Inc. ... 81
Example Technologies Never Associated with New Firms ... 83
xiii
LIST OF TABLES
Table 1: Initial Statistics from Patent Data ... 47
Table 2: Descriptive Statistics ... 48
Table 3: Correlation Table (a) ... 49
Table 4: Correlation Table (b) ... 50
Table 5: Descriptive Statistics by Entrepreneurship Condition ... 51
Table 6: Garage Invention and Entrepreneurship Statistics by State ... 52
Table 7: Results (a) – Cox Proportional Hazard Models ... 54
Table 8: Results (b) – Cox Proportional Hazard Models ... 56
Table 9: Results (c) – Cox Proportional Hazard Models ... 58
Table 10: Interaction Model with Post-Firm Affiliation (Cox Model) ... 60
Table 11: Robustness Test – Logit Model ... 62
Table 12: Firm Founding Verification Table by Year ... 70
Table 13: Summary of Firm Founding Verification ... 71
xiv
LIST OF FIGURES
Figure 1: Basic Model of Garage Entrepreneurship ... 63
Figure 2: USPTO Patents by Independent Inventors: 1980 –2004 ... 63
Figure 3: Firm Foundation Delay from Last Patent for Garage Inventors ... 64
Figure 4: Example of Survival Analysis Data Structure ... 65
Figure 5: Garage Inventors by State ... 66
Figure 6: Garage Inventors Weighted by State Population (per million) ... 66
Figure 7: Garage Entrepreneurs by State ... 67
Figure 8: Garage Entrepreneurs Weighted by State Population (per million) ... 67
Figure 9: Donald Cech’s Invention of "Releasable Axle Assembly for Skate Wheels" ... 75
Figure 10: Mohan Ananda LinkedIn Profile - Stamps.com ... 76
Figure 11: Daniel Groteke Garage Patent ... 77
Figure 12: Daniel Groteke Entrepreneur Patent ... 77
Figure 13: Example Search Result Showing Metcast Associates Founding Date ... 78
Figure 14: Example Founding Information for 3sixty Technologies, LLC ... 80
Figure 15: Brent Jones Garage Patent 5,678,344 ... 81
Figure 16: Innovative Sports Garage Entrepreneurial Patent 6,119,388 ... 81
xv
LIST OF ABBREVIATIONS
HHI Herfindahl–Hirschman Index
hr Hazard Ratio
IAP Inventor’s Assistance Program
IRR Internal Rate of Return
MSA Metropolitan Statistical Area
NBER National Bureau of Economic Research
or Odds Ratio
se Standard Error
SMS Simple Messaging Service
UIA United Inventors Association
USPTO United States Patent and Trademark Office
1
CHAPTER 1: INTRODUCTION
Where do new organizations come from and who is at risk of founding those organizations? These are two of the fundamental questions in organizational and
entrepreneurship research (Aldrich and Ruef, 2006; Gartner, 1985; Krueger, 2002; Shane and Venkataraman, 2000). An enduring image in American culture is the heroic “garage
inventor” turned entrepreneur (Audia and Rider, 2005; Cohen, 2011; Engber, 2013). This study, starting with the metaphorical garage, clearly identifies a set of individuals at risk of starting a firm in order to isolate and address the first question in the technological space, a phenomenon addressed as the “garage entrepreneur” for this study.
The garage has served as the setting for new entrepreneurs like such as Roy and Walt Disney leading to the Walt Disney Company, Ruth Handler who created the Barbie Doll and founded Mattel, Steve Jobs and Steve Wozniak of Apple, and Bill Hewlett and David Packard for Hewlett-Packard (Cohen, 2011). Hewlett and Packard’s story was so important that the garage they worked in is a designated historic landmark as the birthplace of Silicon Valley (Engber, 2013).
2
In addressing the phenomenon, I will be investigating problems at the intersection of strategy, technology, and entrepreneurship. With respect to innovation, Teece (1986) highlights the difference between value creation and value capturing in technological innovation. Having overcome the challenge of creating a new technology, these inventors still face great obstacles in identifying means of protecting and profiting from their ideas (Gans, Hsu, and Stern, 2002). Prior research in technological venture formation frequently focus on knowledge sources for entrepreneurship that include firm spin-offs and employee entrepreneurship (Chatterji, 2009; Klepper, 2007; Klepper and Sleeper, 2005), university transfer (Katila and Shane, 2005; Shane, 2001a; Stuart and Ding, 2006), and user
entrepreneurship (Shah and Tripsas, 2007; Tripsas, 2008). In each setting, the entrepreneur is able to overcome the complementary asset problem using different resources from his or her experience.
I am interested specifically in the perspective of the non-affiliated inventor(s) and the technology and context around them. Rather than from the perspective of the incumbent fearing disruption (Christensen, 1997), I explore the garage inventors and how the
technological, social, and geographical environmental characteristics affect entrepreneurship. In doing so, I connect with recent research efforts that encourage investigation into the
entrepreneurship processes not affiliated with firms or universities (Åstebro, 1998; e.g. independent inventors ‒ Åstebro and Dahlin, 2005; ‘Edisons or Hobbyists’ ‒ Dahlin, Taylor, and Fichman, 2004; ‘user entrepreneurs’ ‒ Shah and Tripsas, 2007).
3
necessarily whether it is yet successful. In doing so, I am able to highlight a step in an evolutionary process for which inventors select themselves (or are selected) into entrepreneurship. This selection mechanism allows an insight into the options that are presented for later market selection.
In order to answer the question, I consider theories developed in other settings that resulted in entrepreneurial startups such as through university and firm spin-offs. While I draw from the logic that proved valuable in those settings, it is not immediately known if all the theories will hold in the same manner, and complement the theories with inventor independence. Independent inventors do not have access to the same resources or networks and may not develop technologies in line with those sources. I specifically develop
4
CHAPTER 2: RESEARCH PHENOMENON
“Face it: Out there in some garage, an entrepreneur is forging a bullet with your company’s
name on it.” – Gary Hamel (1999: 72)
The role of independent inventors and/or small firms have been debated in the literature (e.g. Amesse et al., 1991; Cohen, 2010; Fontana et al., 2012) for some time.
Classic Debates
Joseph Schumpeter is frequently seen as arguing on both sides and starting the debate of the importance of entrepreneurs and technological development, which is the engine of economic growth in his models. Schumpeter’s gales of creative destruction are either
primarily the realm of innovative entrepreneurs developing new technologies through radical new combinations of existing ideas and destabilizing the incumbents (Schumpeter, 1934) or are the product of the large R&D laboratories (Schumpeter, 1942) where large firms play a very important role. In economics, this argument has frequently been evaluated as
determining the firm size (Cohen and Klepper, 1996b; Prusa and Schmitz Jr., 1991) or market structure that promotes innovation – i.e. do large monopolists have the incentive to innovate to avoid future competition (Cohen and Levin, 1989; Scherer and Ross, 1990)?
5
14% percent of the inventors assigned their patent to themselves or unassigned rather than a firm or the government. Additionally, he found that 7% of the inventions by technologists were “Not Part of [the] Job” (Schmookler, 1957: 332).
Jewkes, Sawer, and Stillerman (1971) similarly studied great inventions of the early twentieth century. In a study of sixty major inventions, half of them were invented by individual inventors without the support of research institutions. They evaluate that studies “continue to provide evidence of the important role of the independent inventor” (Jewkes et al., 1971: 205). They do however include university researchers in the independent category as long as the invention could clearly be linked to the efforts of the specific inventor and as long as the inventors were working autonomously, even within the university context. In more recent years, university spin-offs, that could have been some of those represented as independent in their sample, have received attention in academic literature (Foray and Lissoni, 2010; Jaffe, Fogarty, and Banks, 1998; Katila and Shane, 2005; Nerkar and Shane, 2003; Shane, 2001a). At the time of the Jewkes, Sawer, and Stillerman study, the rate of patenting amongst independent inventors had been declining. They acknowledge that the type of invention going forward may yet make laboratories and firms the source of invention, but conclude that it is still important to keep researching all avenues of such invention.
Recent Literature
6
firms did start in garages, basements, dorm rooms, or kitchens. However, these were temporary locations early on and the authors highlighted that 91% of the companies were related to the founders’ prior industry experience and prior social ties were important in 66% of the companies. They state that entrepreneurs are organizational products and feel that the image can be detrimental to individuals trying to become entrepreneurs by not emphasizing the social and knowledge source aspects and policy makers, business schools, and popular press should not highlight the phrase. Audia and Rider conclude that research on individual entrepreneurship should focus on identifying access to organizations, which can provide information on opportunities, role experience, social contacts, and access to key resources.
Other recent scholars have been calling for more studies in relation to independent inventors and innovation (e.g. Åstebro, 1998; Dahlin et al., 2004; Shah and Tripsas, 2007). Åstebro performed a survey of Canadian inventors who sought help from the Inventor’s Assistance Program (IAP). With 1,095 responses, he was therefore able to study a sample of inventors with information at the time of IAP application as well as measures of performance from his independent survey. He reported the results in a series of articles.
7
inventors were told by the IAP not to pursue their idea commercially, 50% of those continued working on it (Åstebro and Gerchak, 2001).
Evaluating the characteristics of success in his sample, Åstebro reported that of 36 characteristics of innovation, technology, and the market, four stand out as being related to eventual success: expected profitability, technological opportunity, development risk, and
appropriability conditions (Åstebro, 2004). Clarifying further, technological opportunity is related to commercialization if the inventor believed his or her invention had high technical performance and low technical uncertainty (Åstebro and Dahlin, 2005). They suggest that the independent inventors applied for patents without taking into account commercialization considerations based on their survey results. Lastly, Åstebro and Dahlin find that the
dominant mode (82%) of sales is through self-commercialization with the inventor involved. Regarding profitability expectations, the significant characteristics were price required for profitability and anticipated stable demand (Åstebro and Michela, 2005).
In a different study, Dahlin, Taylor, and Fichman (2004) took up the debate whether independent inventors were “future Edisons or weekend hobbyists.” They sought to answer whether there was significant technical content and merit to encourage policy support of independent inventors. In the specific setting of tennis racket patents, they found that 65% of patents were held by independent inventors as compared to corporates and 59% of the
independent inventors held multiple patents in the area. Analyzing the nature of independent inventions as compared to those developed by firms, the authors found that there is
significant variation in the quality of inventions by independent inventors. They found that independent inventors are over-represented in both the most important and the least
8
Singh and Fleming (2010) address the debate on the importance of variance in independent inventor outcomes as well, coming to different conclusions. Following literature that suggests variance is the important measure for creative outcomes (Fleming, 2001, 2007; Girotra, Terwiesch, and Ulrich, 2010), Singh and Fleming seek to test whether variance and mean performance are positively related in a large sample of patented
inventions. Rather than suggesting that merely having variance is a good thing, they suggest that independent inventors will be more highly represented in the lower tail and less highly represented in the upper tail as compared to corporate inventors. They argue that corporate and team-based inventions will be better selected so as to eliminate poor outcomes prior to patenting. Additionally, corporate and team invention carry benefits such as access to a greater variety of knowledge to recombine – thus increasing the likelihood of creating breakthrough ideas. They supported this argument using quantile regression on over half a million patents that independent inventors are more likely to produce very poor outcomes and simultaneously less likely to create breakthroughs as compared to their corporate
partners. They do not address entrepreneurship or commercialization but aim to enhance the debate on the (non-)importance of independent inventors based on their comparative
inventive output.
In another study, Sirilli (1987) completed a study on over 500 inventors who filed patents under the Italian patent system in 1981. He found that 60% of the respondents were associated with a firm and the other 40% were “individual” inventors, although the
9
nearly three-quarters of the inventors claimed their invention would have been developed even in the absence of the patenting institution. However, he still found patenting important and necessary for protecting their inventions.
Weick and Eakin (2005) repeat the call for more studies of independent inventors. In a short survey, they sought to investigate who these inventors are, measure the level and direction of their inventive activity, analyze how frequently these inventors take their
products to market and in what manner, and test the correlations between sales achieved and market choices such as outright invention sale, start-ups, or licensing. Surveying individuals on the mailing list of the United Inventors Association (UIA) and the Inventors’ Digest, they received 351 responses to a questionnaire on biographical and invention details, which represented a 9% response rate as measured over the total size of the mailing list. Most of their responses tended to work on hardware/tool, household products, industrial/commercial products, novelty items, and toys/games/hobbies. They found that 39% of their population generated some sales and 20% made a profit. In this sample, higher likelihood of achieving any sales was associated with starting their own business but a higher level of sales was associated with licensing rather than outright invention sale or starting their own business.
Lastly, a rising area of interest in the literature is highlighting user entrepreneurship
10
significantly overlaps, especially with end-users or consumer goods and sports products, which has been tested under the user entrepreneurship model (Fauchart and Gruber, 2011; Shah, 2005). However it also includes physicians using medical devices and providing their feedback to the manufacturers (Chatterji and Fabrizio, 2012). Shah and Tripsas (2007: 123– 124) specifically call for increasing the study of entrepreneurship out of the regular contexts of firm and university spin-offs which leads them to the area of demand-use and user
entrepreneurship. I repeat the call for study outside of university, firms, or other
organizations but suggest that the alternative category is broadly independent invention. I then do not yet assume characteristics of the motivations of the inventors and entrepreneurs but define the scope of this study based on their working relationship, primarily through a clear patenting relationship with an existing organization prior to the inventor become independent.
To wrap up the question of significance, a recent study on the acquisition and commercialization of invention suggests that 49% of manufacturing firms that innovated during 2007 – 2009 did so with a product that originated outside the focal institution, namely through customers, suppliers, and “technology specialists” that included independent
inventors (Arora, Cohen, and Walsh, 2014). They found that while customers were the most frequent source of such inventions, technology specialists provided inventions that were more economically valuable.
Garage Inventor to Garage Entrepreneur
11
outside the context of a firm, university, government, or other formal organization. Specifically, the inventors own the technologies themselves rather than assigning it to another organizational entity. It is important to note that this definition does not include all independent inventors where a technology is not assigned to an organization. The “garage” status of an inventor is defined at the time of his or her first patent. Inventors who first develop technologies for an existing firm may later have independent (i.e. non-assigned) patents but they will not be considered “garage” under this definition. Additionally, this status is limited to independence of an organizational affiliation but not limited by “lone wolf” inventive status where the inventor does not work with anyone in the invention stages. In fact, the co-inventing relationships will prove to be important substitutes for working relationships. A “garage entrepreneur” is the garage inventor who subsequently starts a new technological firm after such invention. A garage entrepreneur will therefore be a subset of garage inventors for this context. This differentiates from inventor/entrepreneurs associated with other new technological entities in the patent database. To test knowledge use and development for garage entrepreneurship, I focus solely on the venture formation conditional on having developed a new technology. This results in the study highlighting this type of technological entrepreneurship where technologies were not spun out from previous entities. See Figure 1 for an evolutionary model of the Garage Entrepreneurship that I study.
12
affect the process after opportunity identification as the inventor decides to form a new venture or not in order to capitalize on the invention. Following this decision, the market acts as the retention mechanism and provides feedback whether the firm should continue to exist and how successful it will be. This leads to evaluating the selection mechanisms that expand the technological variations into entrepreneurial ventures.
13
CHAPTER 3: THEORY AND HYPOTHESIS DEVELOPMENT
Entrepreneurship is based on identification and exploitation of opportunities (Shane and Venkataraman, 2000). The discovery or creation of a new technology creates the opportunity. Given the model under evaluation, the inventor has shown awareness of the opportunity but different factors can increase the awareness of market value and potential opportunity (Kirzner, 1973) or otherwise prompt the inventor to action in attempting to commercialize the technology (Mollick, 2012).
To answer the question of what factors prompts the garage inventor to become a garage entrepreneur (Amit, Glosten, and Muller, 1993), I first investigate characteristics of the social environment in which the potential entrepreneurs are embedded. I then develop arguments on the product and competitive environment at the time of the invention.
Social Opportunity Space
14
developed the technology outside of a work relationship with a firm, university or other organization that can claim ownership over the focal technology.
The focal invention is developed outside of these affiliations. However, it can be developed by a team or by individuals who have worked in teams prior to the focal
independent technology. Leveraging knowledge gained from prior affiliations can help them overcome tacitness of external knowledge (Kogut and Zander, 1993), a valuable condition as most knowledge will be outside of the individual inventor without a formal affiliation. The knowledge required for successful innovations that are more likely to be radical and valuable as described above can therefore come from the size of the network even if not directly from the focal technology. For technologies actually developed by multiple inventors, each inventor can have unique knowledge and experiences (Gruber, MacMillan, and Thompson, 2013; Haas and Hansen, 2007).
If the inventors are strongly linked, the inventors will have access to nearly the same knowledge (Granovetter, 1973) and the invention could be limited in its value. However, if the inventors have different networks, one new path can open access to very different new knowledge that can be turned into value. As knowledge from different areas are recombined together, the likelihood of success increases. Focusing on more than just the size of the network, garage entrepreneurs will have networks of co-inventors with a variety of knowledge expertise. As the number of inventors increase, the likelihood of having new knowledge increases (Jones, 2009). Therefore, I hypothesize the positive effects of the size of the inventive network:
Hypothesis 1: Garage inventors are more likely to become garage entrepreneurs as
15
Technological Opportunity Space
“I fear someone in a garage who is devising something completely new.”
Bill Gates (1998: as described by Grossman, 2012) in response to a question as to which competitor he feared most.
The innovative process is frequently seen as recombining prior knowledge in order to achieve novel combinations (Schumpeter, 1934; Spender and Grant, 1996). Incumbent firms are more likely to start working on process innovations (Cohen and Klepper, 1992, 1996a) and produce technological innovations that are very similar to their existing technologies (Helfat, 1994). Opportunities can also exist when actors specifically hold different views on the value of the technology. Even if incumbents were aware of a potential technological opportunity, they may not pursue it because they do not understand the importance of the technology – which will be more difficult as the technology becomes more radical and harder to evaluate – or that it is not economically important for them.
New technological categories are likely to emerge from new and small firms (Prusa and Schmitz Jr., 1991). Partially, this could be a function of the selection mechanism by inventor/entrepreneurs. Regardless of the technologies the independent inventors actually create, they are more likely to evaluate the opportunity as important if the idea is radical and potentially significant (Gans et al., 2002). If the idea is simple, inventors may recognize some small value but will not pursue the technology commercially. Additionally,
incremental innovations that are not radical are more likely to be tied to existing technologies that are controlled by the existing incumbent firms. This will discourage inventors either cognitively as they evaluate the opportunity or rationally as they understand that the
16
the enhancement. Entrepreneurs are also more likely to commercialize inventions
themselves as the scope of the patents increases (Nerkar and Shane, 2007; Shane, 2001a). Under conditions of broad technological application, the opportunities will increase as the inventor can see markets in different areas (Shane, 2000) that the technology can be applied. Altogether, these arguments suggest that radicalness and significance of the technology will increase the rate of entrepreneurship amongst garage inventors.
Small, entrepreneurial firms, especially those started by independent inventors, will not have significant amounts of excess resources in order to compete broadly. They are best able to enter when small, niche market opportunities are available (Gans and Stern, 2003; Katila and Shane, 2005). By targeting niche markets, the independent inventors will be able to gain experience and perfect their products while not experiencing the full competitive pressures (Christensen, 1997). As the availability of niche markets increase, even if
incumbent firms identify the opportunity, they may not see the profitability compared to their existing market (Bhide, 1992; Christensen and Bower, 1996). As the market concentration increases, existing firms will be more competitive and likely to respond to external events (Turner, Mitchell, and Bettis, 2010). With such concentration, independent firms may not be able to identify the market opportunities for smaller technological products.
17
These niches may exist as a large number of competitors are present in the
environment (Katila and Shane, 2005) and similarly when the industry concentration is small (Nerkar and Shane, 2003). Niches are particularly relevant as incumbents are not able to serve the fringe users and new companies can test their products with little direct competition (Malerba et al., 2007). Therefore, I hypothesize that the presence of market niches, or areas of less competition for inventors, will be related to inventors starting new ventures to commercialize their inventions.
Hypothesis 2: Garage inventors are less likely to become garage entrepreneurs as the
competition in the technological space increases. Geographical Opportunity Space
Another sociological factor includes the startup activity in the area (Konczal, 2013). As the amount of startup activity in the area increases, entrepreneurship is more likely to be visible as their friends or colleagues start to engage in entrepreneurship (Kacperczyk, 2013; Roach and Sauermann, 2015). With increased startup activity, specialized resources
dedicated to supporting such activity could increase which will allow for easier access by other potential startups.
18
Even without the direct connection, a wave of entrepreneurship in the area can equally serve to encourage the inventor to consider firm formation (Freeman, 1986; Thornton, 1999). This has been seen similarly in acquisition waves (Stearns and Allan, 1996; Thornton, 1995). The startup activity and social pressures can serve to promote entrepreneurship regardless of the actual quality difference in the invention. Therefore, I suggest that startup activity will increasingly promote entrepreneurship from the set of garage inventors.
Hypothesis 3: Garage inventors are more likely to become garage entrepreneurs as
incidence of entrepreneurship in their geographical area increases. Experience
Entrepreneurial opportunities exist when the existing actors having different ideas of the potential value of an opportunity (Kirzner, 1973), are cognitively not able to recognize the opportunities, possibly because of their existing knowledge structure (Shane, 2000), or when the opportunities are created by luck or foresight through the recombination of previous ideas (Schumpeter, 1934).
Social and organizational connections serve to cull ideas earlier (Singh and Fleming, 2010) and provide feedback as new ideas develop. Without such connections, the alternative is for the inventor to develop the ideas and obtain feedback once new technologies are developed. This process of experiential learning increases the skill at patenting good
19
Further, organizations are repositories of technologies, associated resources, and stored and tacit knowledge accumulated over time related to their technological portfolio (Spender and Grant, 1996). A single independent patent defines the start of a technological trajectory but the inventor will need a fuller portfolio in order to increase their confidence of survival and economic viability (Somaya, 2012). Therefore, as an inventor both improves on the technology and builds a thicket of patents more capable of protecting the technological area, thereby increasing expected economic returns, the inventor is more likely to engage in entrepreneurship:
Hypothesis 4: Garage inventors are more likely to become garage entrepreneurs as
20
CHAPTER 4: DATA AND METHODOLOGY
In order to study the phenomenon of technological entrepreneurship by garage inventors, I study the transition from inventor to entrepreneur by operationalizing a garage inventor as an inventor in the patent database whose first patent is independently owned by the focal inventor and he or she has no recorded working history with an existing
organization from the patent database. This is likely to capture those firms that have the potential to be vibrant additions to the economy. Patents have been shown as valuable resources for entrepreneurial companies (Hsu and Ziedonis, 2013) and as able to increase likelihood of receiving venture capital funding (Hsu, 2006; Stuart, Hoang, and Hybels, 1999).
Sample and Data
Using the Harvard Patent Dataverse (Lai et al., 2013) from 1980 to 2010, I identify the individuals who develop their first patent without an organizational assignee. This data is useful as it was designed to disambiguate inventors specifically to enable the study of
inventor mobility in the database (Marx, Strumsky, and Fleming, 2009) which is similar to identifying the transition from independent inventor to entrepreneur. Figure 2 represents the trend of independent inventors patenting within the USPTO during a sample of the time under analysis for this dissertation.
21
Lampert (2001) and Nerkar and Paruchuri (2005) by following the entire cohort using a hazard model to allow censoring in yearly spells.
Censoring in this case represents right censored data whereby the entry is known but the exact exit point for the inventor is unknown. Once an inventor becomes an entrepreneur, the exit event is clear. Alternatively, I remove inventors after 20 years from the date of their last patent. After such a time, I have reasonable confidence that they are unlikely to start a firm based on the technology. Not only has a significant amount of time passed but per the legal timeline of the patent grant, their patent has expired. If the technology had value, the inventor no longer has an exclusivity right. While the model could be run as true continuous time, the yearly spells allow for updating the independent variables that vary with time for the inventor. Therefore, any year that ends with no known entrepreneurship event, the inventor is said to be right-censored. The inventor is therefore still in the analysis but the research methodology then allows me to empirically deal with their presence but unknown outcome. This is therefore different from clearly saying that inventor has not founded a firm. Censoring allows for such a distinction empirically.
I follow patenting inventors without corporate pre-history who applied for at least one granted patent after 1980. With a patenting pre-history to 1975, I can examine their
22
The Appendix highlights the part of the process of evaluating firms as brand new entities and providing secondary verification on their founding. After initially matching the data the first-level identification strategy described above, I had a sample of 7,732 new firms in the USPTO data associated with inventors whose first patent had been unassigned to any organization. I went through the list to eliminate assignments that did not match the idea of a new, entrepreneurial firm. Namely, many were assigned to another inventor, especially when multiple inventors were on the patent but it would be owned by one in particular. Some universities’ first patents were present in this sample and were thus eliminated. Foundations, trusts, institutes, and government organizations were removed if they were one of the new patenting organizations. Some international companies with GmbH (Germany) or SpA (Italian) with American inventors were also present and therefore removed. After this process, I was left with 5,780 firms. In the final analysis that relies on full data availability, I have a complete sample of 5,684 new firms in the patent database and 152,092 unique garage inventors.
Without controlling for any characteristics, the cumulative firm foundation
percentage is presented in Figure 3. The percentage is scaled based on the inventors in the data set that do start an entrepreneurial firm, not on the total population of inventors. If scaled to the entire garage inventor list, the figure would asymptote to about 4%. From the figure, we can see that 20% of inventors who start a new firm will do so in the same year as their initial parent. Within five years after the garage patent, 85% of those who will become entrepreneurs have done so. While I will eventually discount inventors who become
23
Model Specification
I used a Cox Proportional Hazard Model of the form: ℎ ( ) = ( )exp { + ⋯ + }
where the baseline hazard function is left unspecified and the results are relative to this unknown and unspecified function. Between two individuals, the ratio of hazards is then:
ℎ ( )
ℎ ( )= exp − + ⋯ + −
Further the ( ) cancels out in the ratio. The analysis then tests a set of covariates on the risk of an event happening – the garage inventor engaging in entrepreneurship by patenting under a new technological entity.
The data is structured as survival analysis with a yearly outcome. I follow every inventor who applied for a patent 1980 onward under the proposed garage status in this study. In each year, I can specify their likelihood of patenting with a new technological entity, whether or not they patent in the following year. This also allows us to incorporate censoring for non-patenting in the outcome year.
Independent variables are defined by the characteristics of the inventor, the patent, or the environment in the year prior to the dependent variable. For yearly changing of
independent variables, the outcome variable is always measured the year after the
24
removed from the analysis 20 years after their last active patent has been filed. This is the length of patent validity and thus highly unlikely that they would rejoin the analysis with any characteristics resembling the expired patent. A simplification of the structure of the data used in the survival model is presented in Figure 4.
Dependent Variable
Garage Entrepreneurship: The dependent variable denotes whether the garage
entrepreneur patents with a new technological entity in the focal year. A new technological entity is the first occurrence of the assignee in the Harvard Patent Dataverse (Lai et al., 2013) as defined by the asgnum indicator which incorporates the NBER (Hall, Jaffe, and
Trajtenberg, 2001) pdpass into their own fuzzy string algorithm for disambiguation. This is similar to a definition used by Malerba and Orsenigo (1999) broadly on technological entry in new classes in the European patent data but is being applied to the first patent ever by a firm. Only the very first patent instance of the assignee is considered the entrepreneurial event and I consider any inventor on that patent to be the entrepreneur on record. If the garage inventor is associated with such a patent, then the dependent variable in the hazard model is triggered. All other outcomes including non-patenting, filing another independent patent, or filing a patent under an existing organization are considered censored events. No characteristics of the entrepreneurial patent are used for the analysis other than its presence or absence and independent variables are not updated when the patent is developed.
Independent Variables
25
Number of Inventors: The first independent variable is the number of inventors on
the patent under analysis. The “garage” status is defined at an inventor level while each patent may have multiple inventors and the analysis is done at the inventor level. Once an inventor has a patent, this is a time-invariant characteristic in the hazard model until the inventor develops a further patent. If the inventor develops a further patent, the characteristic is immediately updated on the basis of his most recent patent and is used going forward. If more than one inventor has “garage status” on the patent, then the first listed inventor is used.
Other Unique Inventor Ties: This variable is the number of unique inventors
directly connected to the team of inventors prior to the patent under analysis. For a patent with one inventor, this represents the total number of other inventors he has worked with prior to this event. For a patent with a team of inventors, this is the cumulative unique inventors, separate from the focal team, that are connected to the inventors on this patent. Together with Number of Inventors, these variables represent a first and second degree strong social connection through which knowledge and information can be transferred. This
variable is only updated with the generation of further patents with different network ties.
Inventor Experience: Experience is measured in the cumulative number of successful
patent applications by the focal inventor. This is automatically set as the value from the previous year until a new patent is developed, at which time the variable is updated through the end of the current observation spell. This value is transformed for the model as
ln(experience).
Firm Herfindahl: To operationalize the concentration in the technological
26
market share for competition and antitrust law but has also been used for technology management. I create the Herfindahl index by examining the ‘market share’ of the different assignees in the technological space in a given year. A higher Herfindahl index would suggest that a few firms are dominant in the technological area. For this analysis, I multiply the traditional calculation by ten in order to scale the variable from 0 to 10 to have a finer understanding of the concentration, especially for interpreting results. The calculation for HHI is:
= ∗ 10,
where i is the primary technological class and j is each existing organization that patented in that technological area in year t; n is the number of patents assigned to the organization and
N is the total number of patents.
Independent Inventors in Technological Area: The complement of current
competition in the technological area is the potential competition in the technological area. Especially from the perspective of a current independent inventor evaluating the
technological opportunity, the inventor can determine how many potential entrants there are by the number of patents assigned to independent inventors – those that are similar to him have the potential to become an entrant. This variable is measured as the log transformed number of independent patents in the technological area in the previous year.
Previous Affiliation: The dummy variable where one in previous affiliation
27
independent of any organization. However, it is possible for garage inventors to join an existing organization prior to becoming an entrepreneur. This dummy captures the transition to employee that may bring resources that non-affiliated inventors still do not have.
Size of Previous Affiliations: To further understand the significance of any prior
organizational affiliations, this variable measures the maximum size of any prior
organizational affiliation as calculated by the log of the number of patents owned by the organization at the time of inventor affiliation. Once an inventor works with a corporate affiliation, this becomes a stable characteristic of the inventor for all future observation spells. Depending on which regression model, this is valued at zero if the inventor has no prior organizational affiliation or is left out of the model as blank when evaluating
organizational affiliation separate from the whole sample.
Venture Capital Deals in the State: One defining characteristic of the geographical
opportunity space is the potential for outside funding which is a significant indicator for technological firms in particular (Hsu and Ziedonis, 2013; Stuart et al., 1999). The data is collected by the National Venture Capital Association (Franklin and Taylor, 2015) and Thomson Reuters that records the information and makes it available in their Stats and Studies Yearbook. This variable is the log of the total number of venture capital deals in the inventor’s state in the focal year.
MSA Entry Rate: Further representing the geographical area, the Census Business
Dynamics Statistics (US Census Bureau Center for Economic Studies, 2015) allows
28
(number establishments entering in the year divided by the average number of establishments in the MSA).
MSA Exit Rate: The exit rate is determined in the same way as the entry rate but is
measured as 100 * (the number of establishments that exited the area divided by the average number in existence in the year). Research highlights the opportunity for new firm
development based on the closing of existing firms, unintentionally allowing existing firms to spin off their knowledge as entrepreneurial firms (Carnahan, 2013; Hoetker and Agarwal, 2007).
Time Since Invention: This variable is measured in years since the inventor’s last
patent. The Hazard Model tests the age of the patent and this time-based likelihood of engaging in technological entrepreneurship.
Controls
Additionally, I control for a few additional characteristics that are related to the independent variables or are theoretically relevant to the experience of the inventors:
Claims: This is the log of the number of claims on the patent. Claims has been used
as a proxy for the significance of the technology and is correlated with the economic value (Nerkar and Paruchuri, 2005; Tong and Frame, 1994).
Five-year Citations: Both as a possible measure of significance and as a feedback
29
Originality: The originality is a characteristic of the technology defined by the
nature of the references on the patent (Hall et al., 2001) which represents the concentration of technological classes in the backward citations of the patent:
= 1 − ,
where denotes the percentage of citations made by patent i that belong to class j. This is similar to the Herfindahl index and describes how broadly this technology connects to different technological areas. This is a time-invariant characteristic but is updated if the inventor develops a further patent.
Backward Citations: The number of backward citations is a relevant control with the originality measure and is another indicator of the amount of knowledge recombined in the focal technology (Fleming, 2001). This is a time-invariant characteristic but is updated if the inventor develops a further patent.
Male: The gender of the inventor is determined by matching the inventor name and
year to the Social Security Administration data on social security applications in each year. (Social Security Administration, 2014). Patenting is predominantly performed by males (Hunt et al., 2013) and gender may affect the decision to engage in entrepreneurship following the invention and patenting (Delmar and Davidsson, 2000; Kuppuswamy and Mollick, 2015).
New Firms in Database: The nature of new startup firms may have a time-varying
30
database. This measures the number of new firms regardless of inventor garage status or whether those firms were directly measured as an outcome for this study.
Lawyer: As a proxy for resources, the lawyer variable is a dummy indicating
whether the inventor utilized a lawyer to file the patent. This expense is not strictly required and the lawyer information is included on the patent. This data is available for all patent grants from 1998 onward and is from the Harvard Patent Dataverse (Lai et al., 2013).
Zillow Estimate of Home Value: Lastly, as another proxy for resources available to
the potential entrepreneur (Jensen, Leth-Petersen, and Nanda, 2015; Kerr et al., 2015), the estimate of the inventor’s personal home was collected using the inventor address and the website Zillow.com which proceeds home value estimates as well as general market
31
CHAPTER 5: RESULTS
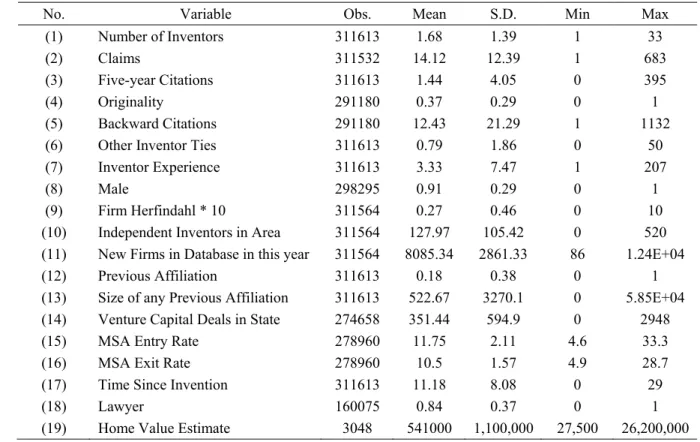
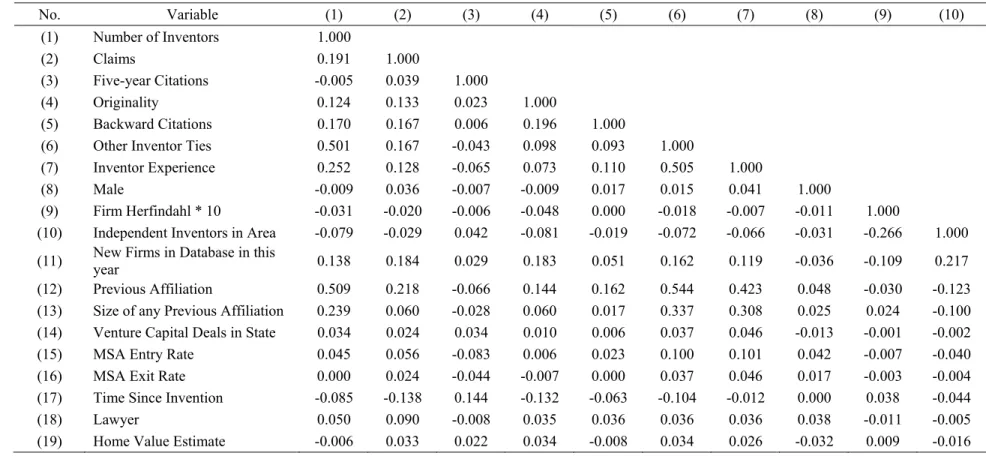
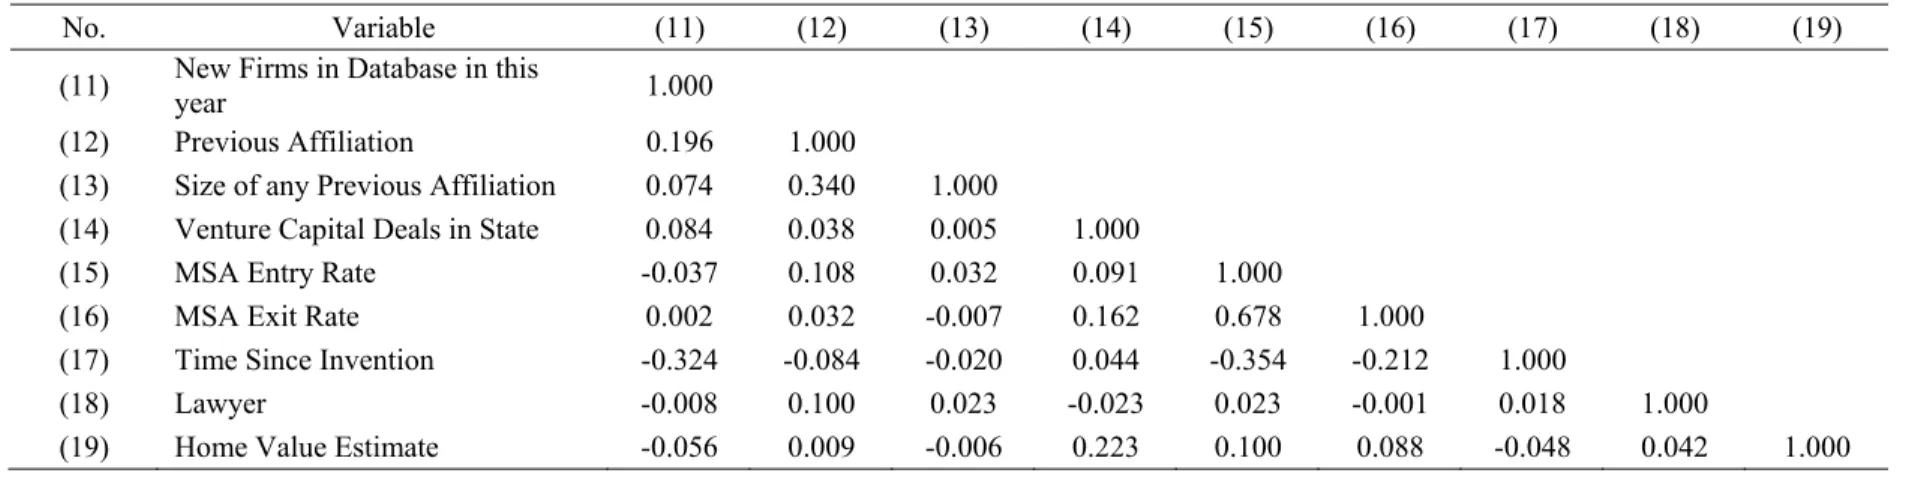
The main summary statistics are presented in Table 2. The correlations are presented in Table 3 and Table 4. The variables presented below are the primary independent
variables. Most count variables will be logged due to the skewness present in their distributions.
Summary Statistics
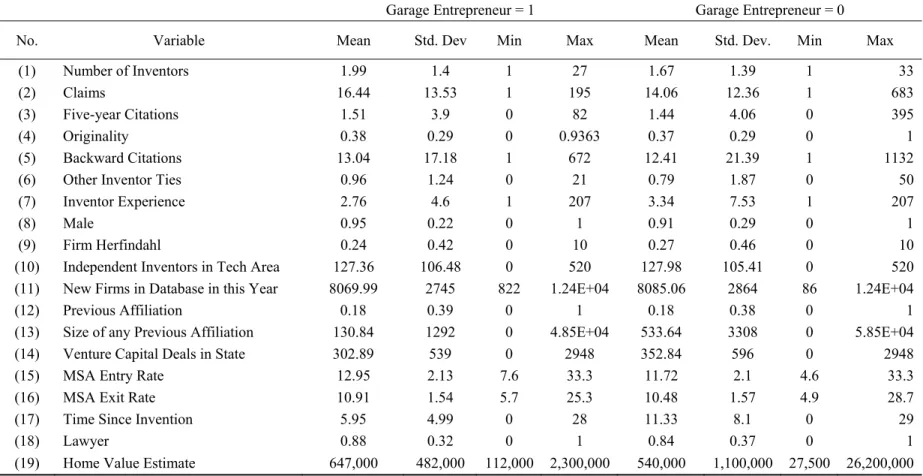
A second set of summary statistics is presented in Table 5 that presents the summary statistics based on entrepreneurship condition. Part of this study is to document and explore the entrepreneurial activity in the patenting database in general related to garage
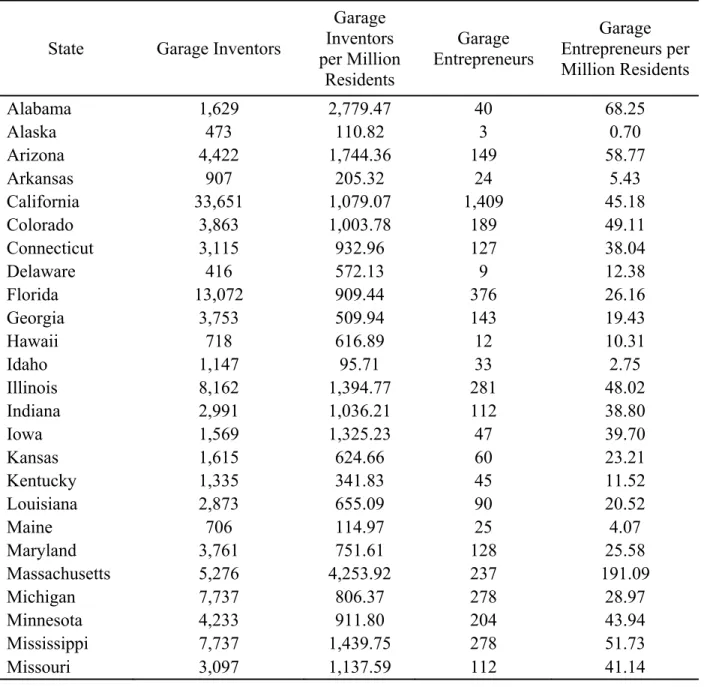
inventorship. Table 6 and Figure 5 through Figure 8 help visualize the location of garage inventors and entrepreneurs representing the total number of inventors or entrepreneurs, respectively, in the state between 1980 and 2009 or the number weighted by the average population of the state during this timeframe. Again, garage inventors are counted if their first patent in the USPTO database is independent of an assignee organization. The garage entrepreneur data is based on the definition within this dissertation of the subset of garage entrepreneurs who subsequently produce the first patent for a brand new assignee within the USPTO data. California, New York, Florida, and Texas are the most prominent areas by raw number of both inventors and entrepreneurs. When weighted by population, New York, Virginia, Massachusetts, New Jersey, Alabama, and North Carolina are the top six
32
above 150 per million residents; and North Carolina, Wisconsin, Alabama, Arizona, Utah and Mississippi all have a rate of garage entrepreneurs above 50 per million residents.
Main Results
The Cox Proportional Hazard Model is a continuous time model that relates how the risk of an event – in this case, the patenting under a new technological entity – to the
underlying hazard function (Allison, 1995). Hazard rates relative to the baseline are
presented. To obtain the coefficients on the variables, calculate the natural log of the hazard rate (i.e., for Inventor Experience in Model 1, the coefficient would be ln(2.068) = 0.727). This is a proportional hazard rate where a value above 1.0 represents an increased likelihood of the event occurring and a value below 1.0 represents a decreased likelihood of the event happening.
Table 7 presents the results of the Cox Hazard Models with Model 1 representing the full analysis period from 1980–2009. I present the asterisks for reference but the tables also contain standard errors to help further understand significance levels (Bettis et al., 2016).
The Number of Inventors is positive with an odds ratio of 1.194 (se = 0.008,
p < 0.001). As the number of inventors on the garage patent increases by 1, the likelihood of the garage inventor becoming an entrepreneur increases by 19.4%. Similarly, as the Prior Unique Ties of Inventors increases, the likelihood of becoming an entrepreneur increases by 15.7% (hazard ratio = 1.157, se = 0.009, p < 0.001). Together, these highlight the positive effect of strong network ties in the social opportunity space, either through direct
33
With regard to the technological opportunity space, the effects of current and potential competitors is most obviously noticed. The Herfindahl concentration is negative with a reduction in likelihood of just over 30%for a one unit change in the concentration in this industry. The Herfindahl index, usually presented from 0 to 1 was rescaled from 0 to 10 to highlight the gradations. Therefore, a unit change is equal to a 10% increase in
concentration, reducing the likelihood of entry by a significant amount (hr = 0.692, se = 0.038, p<0.001). This represents the current competitive landscape in the technological space. Alternatively, garage inventors could look at the area and determine the potential competitors by including the number of garage inventors in their evaluation of the
technological space. The logof the number of independent inventors in the technological space is negative and significant (hr = 0.890, se = 0.014, p<0.001). As the number of potential entrants as independent inventors increases by one standard deviation, the likelihood of entrepreneurship reduces by 11%.
Next, I evaluate the results for the opportunity space as defined by the inventor’s geography. As the number of venture capital deals in the inventor’s state increases by one standard deviation, the likelihood of the inventor generating an entrepreneurial patent increases by 3.5% (hr = 1.035, se = 0.009, p<0.001). This is not a direct measure of capital infusion to businesses but a proxy for financial capital that could be available in the area and interest in technological startups. This still shows a positive effect of the amount of interest in technology businesses around the entrepreneur. Next, as the rate of entry of new
34
se=0.012, p=0.309), suggesting that the entrepreneurial event is not driven by the closing of existing local establishments. This dichotomy in particular highlights the positive benefits of entrepreneurial growth in the area of the inventor.
Next, I discuss the results of increase in experience for the garage inventors. Each inventor under analysis begins with a single patent and no previous organizational
affiliations. As the inventor patents more technologies, they are significantly more likely to become entrepreneurs at a rate of 108% (hr = 2.068, se = 0.056, p < 0.001) as they increase their patent portfolio by one standard deviation. Next, if the focal inventors joins an existing firm, they are also more likely to spin back out and become an entrepreneur with an
increased hazard of 94% (hr = 1.936, se = 0.112, p < 0.001). The characteristic of this process is also started to be tested as the size of the organization’s patent store. Namely, as the number of patents owned by the organization increased by one standard deviation, the likelihood of becoming a garage entrepreneur decreases by 24% (hr = 0.763, se = 0.010, p < 0.001). Lastly, the time since invention is negative with a hazard ratio of 0.935
(se = 0.004, p < 0.001). The likelihood of becoming an entrepreneur decreases with time, which matches the raw pattern seen in Figure 3.
35
patent also slightly increases the likelihood of the inventor becoming an entrepreneur (hr = 1.003, se = 0.001, p < 0.001). Even despite the majority of patentees being male to begin with (91%), males were 119% more likely to move forward toward entrepreneurship
(hr=2.185, se=0.137, p<0.001) than females in this population. Lastly, the presence of new firms in the patent database in that year, representing further patenting and entrepreneurial activity in the times, also significantly increases the likelihood of the inventor producing an entrepreneurial patent by an increase of 198% (hr = 2.975, se = 0.266, p < 0.001) with a one standard deviation increase in the number of new firms in the year.
Note that about 4% of the subjects within this analysis become entrepreneurs (5,684 garage entrepreneurs out of the 152,092 garage inventors included in Model 1). This rate differs from the overall statistics presented in Table 1 based on the availability of data for the full model and decisions to cull as described in the methodology section.
Subsample Analyses
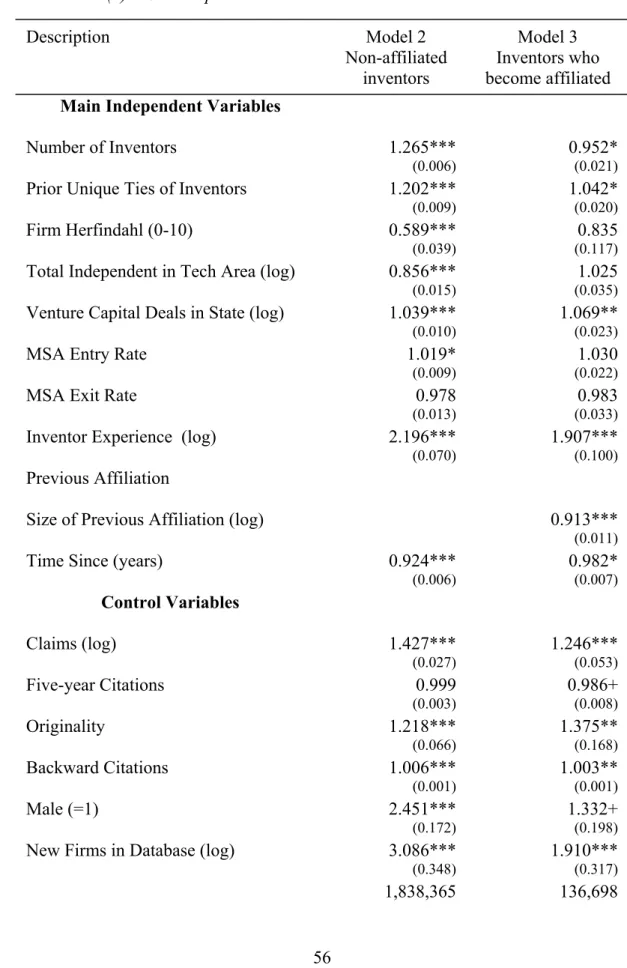
I run four more models to elaborate on the results of Model 1. Specifically, next I break out the analysis as Table 8 into Model 2 and Model 3, which separates inventors who, respectively, never become affiliated with an existing firm prior to their final results from those who do join an existing firm. Model 2 presents the analysis for the garage inventors who do not join an existing firm. The outcome is either an entrepreneurial event, triggering a 1 in the dependent variable, or censored, triggering a zero. Model 3 is for the subset of garage inventors who will join an existing firm at some point prior to their removal from the analysis. The majority of garage inventors (93%) do not join an existing firm as they
36
Model 2 mirrors the effects in model 1 but excludes the firm affiliation variables. Directionally, all the main effects operate in the same predicted manner. The main results are slightly more pronounced without those that will join a firm. For example, there is a slight increase in the importance of the inventor connections, a hazard ratio of 1.265 as compared to 1.194 previously, and inventor experience. A new co-inventor on the focal patent now increases the hazard to 1.265 (se = 0.006, p < 0.001). If one co-inventor is added, the likelihood of the non-affiliated inventors to become an entrepreneur increases by nearly 27% as compared to 19% in the full model. Similarly, a prior outside connection to the patenting team increases the likelihood of a garage inventor becoming a garage
entrepreneur by 20% (hr = 1.202, se = 0.009, p < 0.001) rather than 15.7% from Model 1. These effects start to indicate the effects of the corporate affiliation in the other sample. The importance of inventive experience is slightly enhanced with a 120% benefit (hr = 2.196, se = 0.070, p < 0.001) while it was still a very strong 107% increase in the base model.
Model 3 is the subset of inventors who will become affiliated with an existing organization during their patenting career. This represents about 7% of the garage inventors from the initial sample. The main effect is that corporate affiliation after a garage invention but before the entrepreneurial decision mutes many of the other hypothesized effects. The number of inventors is now negative (hr=0.952, se=0.021, p = 0.022), reducing the
37
se = 0.117, p = 0,198). The total number of other independent inventors in the technological space is positive but with a 95% confidence interval that would range from 0.957 to 1.097. Finally, inventor experience is still positive with a 65% (hr = 1.648, se = 0.112, p<0.001)
rather than 116% in the full model. For this model, I also highlight the size of the affiliation. As the firm size decreases, measured by the log of the number of patents at the time of affiliation, the more likely the initial garage inventor is likely to later become an entrepreneur by nearly 9% (hr = 0.913, se = 0.011, p < 0.001). This suggests that inventors who join larger firms are more likely to stay with their new affiliation, whereas the smaller the firm, the more likely the inventor is to change organizations again, and particularly to a new patenting organization.
When split into the subsamples, 3.3% of the non-affiliated inventors will become entrepreneurs and 8.7% of those that start as garage inventors but then join an established firm are likely to spin back out again and become entrepreneurs in the sample. This could partially be seen by the previous affiliation variable in model 1 but is also present in the raw breakouts from the samples in Models 2 and 3.
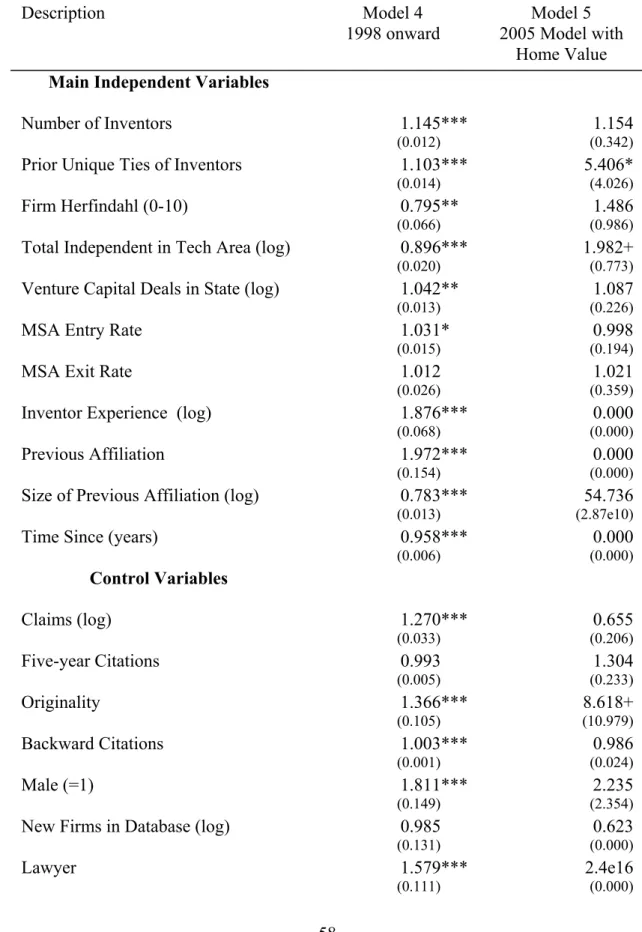
Models 4 and 5, presented in Table 9, are designed to include proxies of personal financial resources available to the garage inventor. Model 4 includes the dummy lawyer
indicating whether the inventor hired a lawyer to file the garage patent. This is not required for patents but could be valuable for the quality. This also demonstrates ability of the
inventor to pay for a lawyer to guide them through the process and may indicate an increased preliminary motivation for a more formal business relationship later. The presence of a lawyer on a garage patent increases the likelihood of becoming an entrepreneur by 58%
38
This information is only available for patents granted after 1998 due to USPTO data availability on the measure and represents half of the initial set of garage inventors from Model 1.
Lastly, Model 5 consists of preliminary results looking at an alternative measure of resources that is not affected by the entrepreneurial intentions at the time of the first patent. Data was collected from the set of garage inventors who began their career in 2005. I was able to identify home value estimates for half of the 5,600 inventors under this condition. The estimate of the inventor’s personal home, allowed to fluctuate each year based on the economic conditions in the inventor’s home zip code, has some evidence for the positive relationship to transition into entrepreneurship (hr = 1.427, se = 0.369, p = 0.100). Due to the extreme reduction in observations, statistical confidence intervals become quite large for nearly all the main effects, dropping below traditional statistical significance levels except for the prior connections of the patenting inventors.
Alternative Specifications
39
an existing organization now decreases the inventor’s likelihood of becoming an
entrepreneur by 24% (hr = 0.761, se = 0.016, p < 0.001). An additional prior connection no longer helps the inventor as each additional prior connection decreases the likelihood a further 16% (hr = 0.840, se = 0.021, p < 0.001). As the inventor becomes embedded in a network of co-authors and connections within an organization, he or she is less likely to spin back out. The interaction with inventor experience is negative but statistically insignificant
(hr = 0.930, se = 0.067, p = 0.312).
Lastly, Model 7 in Table 11 is a time-series logistic analysis on the entrepreneurial outcome by an inventor. All previous models were Cox Proportional Hazard Models that serve to include base time and inventor effects to the rate and likelihood of the
entrepreneurial event. Model 7 alternatively checks this dichotomous option.
Once again, all the effects are qualitatively the same and significance levels are similar for all the main variables. The number of inventors on the patent increases the likelihood by 19% (odds ratio = 1.193, se = 0.008, p < 0.001), which is right in line with Model 1. Prior Unique Ties increase the entrepreneurial likelihood by 14% (or = 1.140, se = 0.010, p < 0.001) as compared to nearly 16% originally. The inventive experience is highly significant with a 146% increased likelihood (or = 2.457, se = 0.052, p < 0.001), whereas it had a hazard rate of 2.068 originally. The previous affiliation is also significantly present in the logistic model with a 150% increased odds (or = 2.491, se = 0.134, p < 0.001) as compared to the still original value of 94%.
This model does not separate out the entry and exit rates in the same manner as Model 1, demonstrating an increased likelihood of entrepreneurship as the general
40
41
CHAPTER 6: DISCUSSION AND CONCLUSION
Contributions
This dissertation started with the notable idea of the heroic “garage entrepreneur”. The image pervades not only the entrepreneurship culture but also the broader American culture that even Cadillac has called on it and its entrepreneurs to represent their message stating “you never know what kind of greatness can come out of an American garage” (AutoMoby, 2013; Ecclestone, 2014). I use the broad construct to determine the ultimate definition of a technological entrepreneur who started through independent invention. This enables me to address entrepreneurship and technology strategy theory with clear data identification mechanisms.
This dissertation overcame some of the classic problems of entrepreneurship research (Low and MacMillan, 1988) by identifying an entrepreneurial risk-set for the level of