CRIMINAL JUSTICE REFORM IN THE UNITED STATES, THE UNITED KINGDOM AND IRELAND
PRE-TRIAL DETENTION AND POST-CONVICTION ACCESS TO LEGAL REPRESENTATION
Paulina Lopez
A thesis submitted to the faculty of the University of North Carolina at Chapel Hill in partial fulfillment of the requirements for the degree of Master of Arts in the Department of Political
Science, Concentration TransAtlantic Studies.
Chapel Hill 2016
Approved by:
Donald Searing
Milada Vachudova
ii
iii ABSTRACT
Paulina Lopez: Criminal Justice Reform In the United States, the United Kingdom and Ireland Pre-Trial Detention and Post-Conviction Access to Legal Representation
(Under the direction of Donald Searing)
There is a serious problem in the US, UK, and Ireland with both lengthy pre-trial
detention, which is often used to persuade guilty pleas, and access to legal aid while incarcerated,
which is a barrier for justice in cases with new and or untested exonerating evidence. Societal
pressures contribute to a legislative and law-enforcement culture that values convictions over
justice, and results in systemic corruption. While this is partially a political culture problem, it
can certainly be ameliorated with targeted legislation. The hypothesis is that differences in these
countries’ laws contribute to lengthy pre-trial detention and limit inmates’ access to legal aid.
This research compares the relative situations of the three countries using quantitative data,
considers literature regarding the effect of caseload pressure on these outcomes, compares the
relevant legislation and implementation thereof, and draws out conclusions and
iv
TABLE OF CONTENTS
LIST OF TABLES...v
THE SIGNIFICANCE OF THESE ISSUES...1
Introduction...1
Existing Literature...5
DATA...10
Comparative Budget Data And Caseload Statistics...11
ANALYSIS OF LEGISLATION AND PRACTICE...32
North Carolina...33
United Kingdom...36
New York...40
Ireland...41
CONCLUSIONS AND OUTLOOK FOR REFORMS...47
v
LIST OF TABLES
TABLE 1 - UK AND IRELAND 2012 OVERALL COURT BUDGET DATA...12
TABLE 2 - ANNUAL PUBLIC PROSECUTION BUDGET IN EUROS
PER INHABITANT IN 2012...13
TABLE 3 - LEGAL AID BUDGET DIVIDED BY CASE IN 2012 IN
EUROS...13
TABLE 4 – PRE-TRIAL DETENTION DATA...17
TABLE 5 – NORTH CAROLINA STATEWIDE CASELOAD AND CASE AGES
– FISCAL YEAR 2011-2012...20
TABLE 6 – NORTH CAROLINA STATEWIDE CASELOAD AND CASE AGES
– FISCAL YEAR 2012-2013...21
TABLE 7 – NORTH CAROLINA STATEWIDE CASELOAD AND CASE AGES
– FISCAL YEAR 2013-2014...22
TABLE 8 – NORTH CAROLINA STATEWIDE CASELOAD AND CASE AGES
– FISCAL YEAR 2014-2015...23
TABLE 9 – NORTH CAROLINA “FINAL JUDGEMENT NO TRIAL”
CASE TOTALS AND PERCENTAGES...24
TABLE 10 – NORTH CAROLINA “FINAL JUDGEMENT NO TRIAL”
E AND SP ONLY...25
TABLE 11 – NORTH CAROLINA COURTS BUDGET...27
TABLE 12 – NEW YORK CITY CRIMINAL COURT CASELOAD
STATISTICS 2011...28
TABLE 13 – NORTH CAROLINA CASELOADS PER JUDGE...29
1
THE SIGNIFICANCE OF THESE ISSUES
Introduction
Criminal Justice reform in the United States has been a highly politicized concern, many
aspects of which have been the subject of heated debate. In the US, judges and prosecutors are
elected, campaigning on their high “success” rates as being tough on crime. Ireland also suffers
from these political problems, as elected officials refuse to pass legislation acknowledging
international human rights laws. The media has highlighted a multitude of cases illustrating
egregious dysfunctionality in the system, largely due to lack of resources, negligence, or blatant
disregard for due process and rights. Many of these systemic issues center around two key issue
areas: pre-trial (and lengthy trial) detention and wrongful conviction. The United States, the
United Kingdom and Ireland will be used in this comparative policy analysis. The United
Kingdom and Ireland share similar historical and cultural roots in their systems, including the
use of Barristers and Solicitors rather than one attorney for both the client and the court.
However, it is the differences in their legislation and implementation that make them excellent
comparative case studies. The United Kingdom has progressive bail laws which allow for time
spent on house arrest and other limiting circumstances to be counted towards one’s sentence.
However, at the same time, it has passed legislative amendments to reduce access to legal aid
while incarcerated. Ireland is an exemplary case study of what not to do. As the following data
2
impossible for someone to seek legal representation while incarcerated or to redress any
malpractice.
A striking example of systemic failures in pre-trial detention and trial lengths in the U.S.
is the case of Kalief Browder, who was detained in Riker’s Island for three years on suspicion of
stealing a backpack (Gonnerman, 2014). While his trial was continually postponed, he suffered
enduring physical punishments and pressure to plead guilty in order to be released, only to have
the case finally be dismissed due to the lack of evidence against him (Gonnerman, 2014). It is
difficult to measure detention resulting from continual postponement of trials, but pre-trial
detention and trial lengths can be measured separately, providing an adequate picture of the
situation. Wrongful conviction cases are also plentiful, with some data available. A recent
example of such a case is that of Luis Vargas, who was convicted in 1999 of three rapes, based
on victim’s identification of a tattoo, which DNA testing has now shown to be the work of a
“serial rapist” with a similar tattoo, who was active in the area at the time; Vargas was finally
exonerated on the 23rd of November 2015, after serving sixteen years in prison (California
Innocence Project, 2015; Associated Press, 2015). Wrongful convictions, unfortunately, are also
difficult to measure, as they are only identified by exoneration; thus, the majority of such cases,
which are still unresolved, are not included in any such exoneration figures. However, one can
use the existing figures to make an estimate. A 2008 study, using data for the percentage of
prisoners who were sentenced to death and then found innocent or exonerated in the 70’s and
80’s, estimated that even if only one percent of the “1.57 million prisoners” in custody at the end
of 2012 were innocent, 15,700 innocent people would be incarcerated (Batts, 2014, p.3). Still,
there is no way to arrive at exact figures. Additionally, the factors which may contribute to
3
evidence are not easily measured or confirmed. However, the rights, resources, and procedures
for incarcerated persons seeking legal representation, or exoneration, as well as the factors which
contribute to long pre-trial detention times, can be examined. In fact, these subjects have been
studied, albeit sporadically and in limited cases, for decades.
The connection between plea bargaining and pretrial detention, to which this thesis has
previously alluded, is that the later induces a strain on the defendant which catalyzes the former.
A 1978 study on plea bargaining found “that plea bargaining is ‘inevitable’” in lower-level
courts (Wheeler & Wheeler, 1980, p.322). Supporting this retroactively, a 1975 study found
“that judges were biased,” assigning more cases to attorneys “who were disinclined to go to trial”
and who charged “low fees” (Wheeler & Wheeler, 1980, p.322). How does this circle back to
pretrial detention? In light of the studies mentioned above, Wheeler analyzed data from courts in
Houston, Texas, and found “that pretrial detention was the most important predictor of prison
disposition,” being correlated more strongly than any other factor considered, including whether
or not the defendant had any prior “conviction[s]” (Wheeler & Wheeler, 1980, p.330). The
findings suggested that “bail decision[s]” effectively pre-sort defendants into two groups: those
who will receive “probation,” and those who will be “imprison[ed]” (Wheeler & Wheeler, 1980,
p.330). This may be due to the fact that bail amounts and conditions are informed by the
seriousness of the charge, locating the defendant on a criminality scale (Wheeler & Wheeler,
1980, p.330) independent of guilt or innocence. Such conditions discriminate against those who
cannot afford to post bail (Wheeler & Wheeler, 1980, p.331). Wheeler concluded that, based on
these results, any “policy” which aims to decrease “pretrial detention” would improve the
“fairness” of case outcomes (Wheeler & Wheeler, 1980, p.330). The Wheelers specifically
4
arrest, which is comprised of “independently assigned” council (Wheeler & Wheeler, 1980,
p.330). They also advised being wary of reforms that only make the system more efficient
without addressing its problems (Wheeler & Wheeler, 1980, p.332). In order to consider and
evaluate reform measures, it is important to identify and support with evidence the factors that
contribute to the problem.
This thesis will examine data and literature with regards to pre-trial detainment, judicial
caseload, and legal budgets. It will compare the US, UK and Ireland in these issue areas.
Quantitative data will be analyzed in conjunction with relevant legislation and existing studies
detailing the requirements for and procedures surrounding the setting of bail, and limitations on
access to legal representation while incarcerated (i.e. post-conviction). My goal is to identify
which factors may be contributing to the problem, and identify changes which may ameliorate
the situation. It is expected that there is a correlation between the budget for courts and legal aid
and the two systemic failures of justice. That is to say, I expect that the countries with
proportionally smaller judicial system budgets will have more problematic policies. A lack of
funding leads to higher caseloads, which presumably delays trials. The funding data will be
compared with the pre-trial detention information. As for the lack of recourse or barriers for
recourse for the incarcerated is concerned, it is presumed that this may also be exacerbated by
small budgets for forensic works, as well as, in some cases, by lack of legislation to provide such
testing. The US has enacted legislation to remedy this budgetary problem, and appears to be
exonerating more people based on DNA evidence than are the UK and Ireland, thereby
supporting this hypothesis. The second hypothesis is that, given the vastly different patterns of
detention and post-conviction access in our three countries, there will be notable differences in
5
should be related to the different outcomes in terms of the two issues of interest. This thesis will
begin with a consideration of the literature, followed by a review of the available data, which
supports the conclusions drawn from the literature. We will conclude with an analysis of the
legislation which affects and is affected by the budgets in the data.
Existing Literature
Since the 1920’s, there has been a scholarly debate over the extent to which pressure
from high caseloads affects the handling of criminal cases (Nardulli, 1979, p.89). In fact, the
earliest study of the subject, entitled “the Cleveland Crime Survey,” found that having
overburdened prosecutors led to many dismissals, higher rates of guilty verdicts, and occasional
wrongful convictions; the report ended by proposing an increase in justice system resources
(Nardulli, 1979, p.89). Studies in the 1950’s had the same findings, with the additional
observation that the drastic differences between plea and trial sentences, designed to encourage
people to plead guilty to avoid the risks and uncertainty of a trial, contributed to “many
substantive injustices” (Nardulli, 1979, p.89). Other studies found the rise of this tactic to be an
industry response to increases in caseloads, some going as far as to extend this to a new
hypothesis as caseloads grow, plea bargain deal provisions would increase in kind (Nardulli,
1979, p.90). In addition to making plea bargaining the default procedure, “caseload pressure”
was also found to contribute to increasing “delays”, treating defendants “inconsistent[ly]”, and
“mishandl[ing]” cases (Nardulli, 1979, p.90). These are not, by any means, new problems.
Other studies on plea bargaining from this decade found that judges assign more cases to
6
presumably to cut costs and increase efficiency. Those studies also touched on the effect of bail
(and by extension, pre-trial detention) on the likelihood of a prison sentence. But what are some
of the factors which play into these decisions?
Scholars study how different factors affect “courtroom operations” by modeling the
processes which occur behind the scenes, in which “dispositional strategy,” the manner in which
cases are processed or disposed, is a key element (Nardulli, 1979, p.90). The nature of these
models is an identification of which actions and “inputs” produce which “outputs” (Nardulli,
1979, p.90). Traditionally, large caseloads were thought to play a key role in the “pervasive
‘dysfunctioning’” of the justice system (Nardulli, 1979, p.89). The essence of this model is that
formal processes directly, and caseload pressures confoundingly, contribute to the dispositional
strategy, which results in the “criminal court outputs” (Nardulli, 1979, p.91). The presumption is
that if caseload pressures were removed from the equation, the outputs would directly follow
from the procedures exactly as intended (Nardulli, 1979, p.90). Of course, this is an
over-simplification of the matter, as the rules and procedures of due process and the pressures of
heavy caseloads are not the only two factors that affect the dispositional strategy and outcome of
a court system. This is where the “legal man assumption” comes into play; the above
input-output model of a court system implicitly assumes that those who pursue careers in law are
inclined to follow all procedures ethically (Nardulli, 1979, p.90). Less blindly optimistic,
another implied assumption is that most courtrooms are struggling under massive caseloads that
preclude the actors from following normal procedures, which they would do otherwise (Nardulli,
1979, p.90-91). However, in reality, the legal man does not always default to procedure. The
7
In a North Carolina criminal case, the preliminary field test was positive for blood
while the more accurate lab test later produced a negative result, but only the preliminary test
was admitted as evidence, a “serologist claimed that lab procedure did not require” her to
report “negative confirmatory tests” (Giannelli, 2012 p.1). Instead, the procedure was to
report positive results “even if more specific tests” contradict them (Giannelli, 2012 p.1). It
was claims such as this which brought into question all lab reports “from 1987-2003” with
potential withholding or misrepresentation of crucial information for the defense (Giannelli,
2012 p.1). This was due to policies which forgo “objectivity” and clarity of reporting
guidelines, in favor of too much individual discretion, and a “lack of transparency…and
oversight” (Giannelli, 2012 p.1). The misreporting happened in the aforementioned way,
ignoring a negative “confirmatory” test, as well as claiming no more tests were done when
they actually were done and were “negative or inconclusive” (Giannelli, 2012 p.1). The
investigation revealed a “prosecutorial bias,” as the aforementioned disparities in reporting
only hid exculpatory evidence (negative results), whereas positive results “were always
included in final laboratory reports” (Giannelli, 2012 p.2). The general consensus was that
the crime labs had a deep-rooted “pro-police bias” which undermined “true scientific
investigation methods” in favor of convictions (Giannelli, 2012 p.2-3). If the police and
prosecutorial culture encourages the hiding and falsification of evidence, then one of the
logical steps is to separate the crime labs from the state, so that they aren’t directly connected
to the police or the prosecution. Luckily, this scandal was large enough that the North
Carolina legislature had to respond with reforms, which will be discussed in the final section.
The aforementioned analytical model of courtroom procedures holds that when caseloads
8
operations and disposition of cases (Nardulli, 1979, p.91). This model holds caseload pressures
to be the cause of “the observed dysfunctioning in criminal courts” (Nardulli, 1979, p.91). This
idea, coupled with the legal man assumption, leads to the conclusion that increasing resources,
thus alleviating caseload pressure, would solve the system’s problems (Nardulli, 1979, p.91). It
is this train of thought that traditionally structured reforms and recommendations (Nardulli,
1979, p.91). The factors which influence a “sentencing decision;” as per the rules “of due
process,” should be “the seriousness of the case, the defendant’s penological needs, and his
conduct since his arrest” (Nardulli, 1979, p.91). Caseload pressure, however, introduces
additional factors that may even override those on which the decision should procedurally be
based; such factors include “guilty plea,” the type of trial (judge or jury), and how well the
defendant adhered to “informal courtroom norms” (Nardulli, 1979, p.91). As alluded to earlier,
the theory holds that as caseload pressure increases, the importance of these new factors
increases with it, and so would increase the sentencing gap between plea bargains and trials
(Nardulli, 1979, p.91). One would expect to find, therefore, a positive correlation between
caseload pressure and guilty pleas and a negative correlation between caseload pressure and
guilty plea sentences. This exacerbates the tendency of “prosecutors and judges” to pressure
defendants to plead guilty in order to alleviate the caseload pressure, for there would not
otherwise be enough resources to bring all cases to trial (Narduli, 1979, p.94).
This perhaps too straight-forward model was the classical school of thought. In 1975,
Malcolm Feeley published an empirical study suggesting that reducing caseload pressure alone
does not result in a higher proportion of cases going to trial (as opposed to plea bargaining)
(Nardulli, 1979, p.91-92). Specifically, Feeley found no difference in “trial rates…release
9
courts (Nardulli, 1979, p. 92). However, he did find a significantly more guilty pleas for lesser
charges “in the high-volume court,” which was even higher when the original charges were
felonies (Nardulli, 1979, p. 92). Of the cases that went to trial, both the low and high volume
courts spent the same average amount of time hearing each trial (Nardulli, 1979, p.92). It is also
important to note that, although Feeley did control for “manpower,” he examined the outputs
without controlling for different inputs (Nardulli, 1979, p.93). This increases uncertainty about
the degree of influence which caseload pressure has on the observed differences in outcomes.
Overall, these findings indicate that, although caseload pressure does have some impact on
procedural trends (offering lesser charges in exchange for guilty pleas), it is not in itself a
sufficient explanation for dysfunction in the system.
A comparative analysis of the other factors considered in this thesis leads to the
preliminary conclusion that budget shortfalls are the most important factor contributing to
dysfunction in the legal system. However, the existing literature and historical studies strongly
suggest that money alone does not solve the problem. Hence, the primary focus of this research
is to identify differences in the statutes themselves, which may affect the output of these justice
systems. However, before analyzing the laws themselves, the pressures and strains which drive
10 DATA
Data for the UK and Ireland comes from the CEPEJ Report on European Judicial
Systems 2014 report, which is based on 2012 figures from 45 countries (European Commission
for the Efficiency of Justice, 2014, p.5-7). Throughout the report, the UK statistics are often
divided into three sections: England and Wales, Northern Ireland, and Scotland; Since Northern
Ireland and Scotland have different judicial systems, the England and Wales totals will be used
as representative of the UK considered here. Additionally, as it is a European report, the figures
are in Euros. As this CEPEJ report covers only the two European countries to be studied, the US
data will come from US domestic sources and UN sources. In its budgetary analysis, the CEPEJ
subdivides the “judicial system” into three sections which are “court budget” (salaries and
operational expenses), “legal aid,” and “prosecution services” (European Commission for the
Efficiency of Justice, 2014, p.19). This budget for the “judicial system” is part of a larger overall
“justice system” budget which also includes “prison,” “forensic[s],” and “probation,” among
other things, depending on the country (European Commission for the Efficiency of Justice,
2014, p.19). United Nations data tables used for the U.S. data will be described in more detail
when they appear in the following section. It is important to note, however, that while the
European Commission does not include U.S. data, some of the U.N. data tables do not include
both the U.K. and Ireland. The different statistics available, and the different presentations of
11
amongst those countries for which it is provided by the same source and against international
averages where applicable.
Additionally, with regards to the U.S., although the U.N. data tables show data for the
nation as a whole, when we turn to the analysis of legislation later in the thesis we will need to
narrow the focus to the state level, because state laws vary a great deal. North Carolina and New
York were chosen as exemplars of a more reformist state and a more non-reformist state,
notwithstanding that both states have a mix of reformist and non-reformist tendencies in their
political culture. Overall, New York has taken more reformist measures, albeit in response to
widespread systemic failures. Interestingly enough, North Carolina has a vast database of
statewide detailed statistics, going back many years, whereas New York has only the current
fiscal budget and one year of caseload statistics for New York City available. The biggest asset
which the North Carolina data provides is the ages of pending cases and resolved cases. These
data are presented in the next section, after the E.U. and U.N. data. This caseload and budget
data, although not comparable to the other nations, provides support and context for the
legislation discussion which follows it.
Comparative Budget Data and Caseload Statistics
This section will begin by examining the available budget statistics for the countries in
question, to identify any striking differences in funding that may be contributing to systemic
12
TABLE 1 - UK AND IRELAND 2012 OVERALL COURT BUDGET DATA
Total Justice System Budget (in Euros)1
Justice System Budget as % of
National Budget2
% of Justice Budget allocated to Court System3
Annual Court Budget per Inhabitant (in
Euros)4
Annual Court Budget as % of GDP per capita5
Ireland 2 346 727 000 3.4 9.8 23.3 0.07
UK England
and Wales 10 582 637 899 1.8 51.6 42.2 0.14
1 (European Commission for the Efficiency of Justice, 2014, p.21-22)
2 (European Commission for the Efficiency of Justice, 2014, p.24)
3 (European Commission for the Efficiency of Justice, 2014, p.25)
4 (European Commission for the Efficiency of Justice, 2014, p.30)
5 (European Commission for the Efficiency of Justice, 2014, p.31)
The first statistic to consider is the overall budget for the justice system as a whole. It is
important to note that different countries include different things in their definition of the Justice
System; for the UK and Ireland, the most important difference to note is that Ireland included
prosecution in these budget figures while the UK did not (European Commission for the
Efficiency of Justice, 2014, p.22). At first glance, this appears to mean that the Irish justice
system is even more under-funded compared to the UK than the numbers suggest. However, the
overall percentage of the national budget is nearly the same. The percentage of the Justice
System budget allocated to the court system is a much still telling comparison. Although the UK
and Ireland allocate about the same percentage of their national budgets to the justice system, of
that percentage, the UK allocates, on average, a third to the courts, while Ireland provides less
than 10%. To clarify further the meaning of these figures, per capita or per inhabitant figures
13
In both the court budget per inhabitant and as a percent of GDP per capita, Ireland
budgeted half as much as the UK. These numbers leave no doubt that Ireland falls short of its
neighbors in terms of courtroom spending. As the later analysis of laws and procedures will
show, Ireland is also the worst offender at failing to meet the rights of its defendants and
inmates. However, budgetary differences, although they certainly impact what can be
accomplished with the given resources, are not sufficient to explain the vast systemic differences
in practices and outcomes observed in later sections. The information, particularly about Ireland,
will illustrate that there is a larger political culture problem at play.
One final statistical comparison to make is between the prosecution budgets in these
countries versus their budgets for legal aid.
TABLE 2 - ANNUAL PUBLIC PROSECUTION BUDGET IN EUROS PER INHABITANT IN
2012
2012 Public Prosecution Budget (in Euros per Inhabitant)
Ireland 8.8
UK England and Wales 12.8
Data from: (European Commission for the Efficiency of Justice, 2014, p.42)
TABLE 3 - LEGAL AID BUDGET DIVIDED BY CASE IN 2012 IN EUROS
2012 Legal Aid Budget (in Euros by case)
Ireland 1,373
Germany 434
Italy 803
14
For this statistic, the UK did not provide per case data, but it does specify that in the UK, minus
Scotland, for which data was not available, 4,411 cases which were brought to trial were
awarded legal aid (European Commission for the Efficiency of Justice, 2014, p.76). This
number could be used along with the budget figures to arrive at an approximate per-case
calculation; however, such method would assume that all of the money budgeted for legal aid
was used. Rather than make such an assumption, here, in the table, are the figures for two other
European countries, to provide a bit of comparison.
These numbers seem counter-intuitive. While Ireland was near the bottom of the list,
well below average on budget allotments as measured in the statistics above, especially with
regards to its courts, it bizarrely seems to spend more than average on legal aid for each case.
When coupled with qualitative data on Ireland’s systemic failures, this is puzzling. Perhaps the
inherent difficulties in the Irish judicial system make it more expensive to attempt to defend a
client. Even so, this does not discount the effect of the smaller, overall budget on the system.
The US data is aggregated from both international and domestic sources; the data
available are different and in different formats than the previous report, and thus, exact
comparisons cannot readily be made on this level. One data source is a study on Pretrial
Detention and Misconduct between 1995 and 2010 (Cohen, 2013 p.1). Major findings include
that pretrial detention increased by 184% in this time, largely due to a 664% surge in
“immigration caseloads,” and that only around 5% of those released on bail during this time
violated their bail in any way (Cohen, 2013 p.1). The data tables also show that, over time, as
15
which were detained pretrial (Cohen, 2013 p.1). The percentage of defendants which are
detained pretrial also varies according to the type of offense; the data in the Bureau of Justice
Statistics report includes figures to control for this disparity.
While overall, in 2010, 80% of defendants in district courts were detained while awaiting
trial, the detention rate of the violent charges was 87%, property charges was 41%, drug charges
were detained at a rate of 84%, public-order offences at 50% weapons charges at 86% and
immigration charges at 88% (Cohen, 2013, p.1-3). It is logical that the violent offences, and the
offence which usually involves capture and deportation, have the highest rates of pretrial
detention. As for the effect of criminal history on the likelihood of pretrial detention, in 2010,
people with no prior arrests had a pretrial detention rate of 64%, which rose nine points to 73%
for those with one arrest, to 79% for those with 2 to 4 arrests, to 85% for those with 5 or more
arrests (Cohen, 2013, p.6). This gradual increase is in line with what one would expect, although
the detention rate for those with no prior arrests, the starting point, seems quite high. A similar
pattern was observed for increasing numbers of convictions, but with a slightly larger jump of
eleven points from the group with no convictions at 67% to the group with one conviction at
78%, followed by 2 to 4 convictions at 82%, and 5 or more at 87% (Cohen, 2013, p.6). The rates
also differed in terms of the types of criminal records; with those who have prior misdemeanor
convictions detained only 75% of the time, as opposed to those with prior felony convictions at
an average of 85% (Cohen, 2013, p.6). The report further divides felonies into three categories,
nonviolent offenses, which were detained 79% of the time, drug offenses, which were detained
86% of the time, and violent offenses, which were detained 89% of the time (Cohen, 2013, p.6).
16
appeared in court and those who have not, with the former being detained at a rate of 75% and
the latter at 82% and 86% for one appearance or more respectively (Cohen, 2013, p.6).
Are such high rates of pretrial detention really necessary? Given how long it can take for
a case to be heard and to be completed, it would be prudent, both for the defendant’s sake and for
the budget’s sake to release as many defendants on bond as possible. How can one assess the
necessity for pretrial detention? One place to look would be the recidivism rate of those released
on bond. Of 35,564 defendants released on bail in 2010, only 17% had any kind of violation;
15% were simply “technical violations,” and only 1% “failed to appear” (Cohen, 2013, p.8).
Additionally, only 2% were rearrested for felony offences and also only 2% were rearrested for
misdemeanors (Cohen, 2013, p.8). This shows that, overall, the rate of bail violation, recidivism,
and failure to appear is incredibly low. However, this cannot, unfortunately, provide an accurate
picture of what recidivism and violation rates would be for a larger sample size, as the people
chosen to be released on bond, which are, given the high pretrial detention rates, a select few, are
the ones which the judges had deemed to be the least likely to commit these infractions. This
diminishes the value of the low violation rates, as the sample is a hand-picked selection of
precisely those individuals who are most cooperative.
An international source of additional statistics for the U.S. is the United Nations Office
on Drugs and Crime; this database offers the average number of prosecutors per 100,000 people
between 2011and 2013 for many countries; although both the US and UK are on this list, Ireland
is not (“Administration of Justice (2011-2013)”, 2013). However, given how tiny its budget for
prosecution was in comparison to the UK, it is safe to presume the Irish number is less than that
of the U.K. During these years, the U.S. had an average of 1.7 prosecutors per 100,000
17
(“Administration of Justice (2011-2013)”, 2013), resulting in an overall U.K average of 10
prosecutors per 100,000 inhabitants. This means that, controlling for population differences, the
U.K. has nearly 6 times as many prosecutors as the U.S. It stands to reason that having more
resources facilitates efficiency. Another statistic available from the United nations is the total
number of persons held in pretrial detention in various countries; all three of the nations in
question are on this list (“Statistics on Criminal Justice”, 2013); only the three most recent are
included here. As before, the UK is divided into nations in this data, so the England and Wales
group is again used as representative.
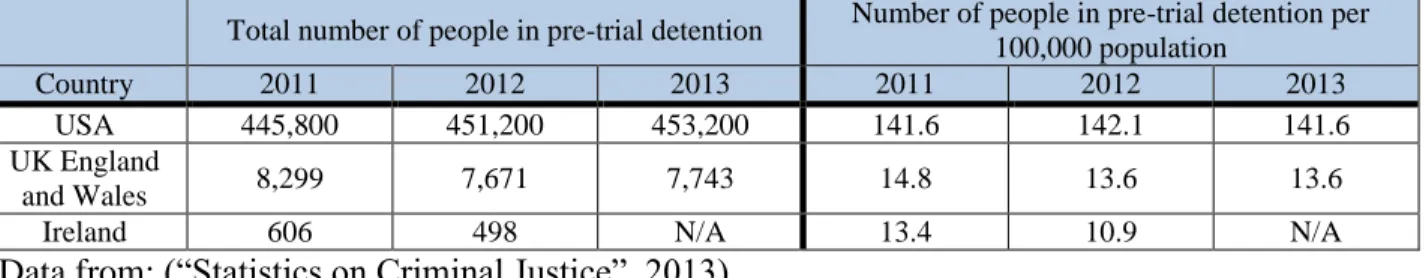
TABLE 4 – PRE-TRIAL DETENTION DATA
Total number of people in pre-trial detention Number of people in pre-trial detention per 100,000 population
Country 2011 2012 2013 2011 2012 2013
USA 445,800 451,200 453,200 141.6 142.1 141.6 UK England
and Wales 8,299 7,671 7,743 14.8 13.6 13.6
Ireland 606 498 N/A 13.4 10.9 N/A
Data from: (“Statistics on Criminal Justice”, 2013).
Although one would expect larger numbers from the US due to the population difference,
even when controlled for population the difference in the proportion of Americans in pretrial
detention is astounding. Despite what one may be inclined to believe given the outright refusal
to acknowledge prisoners’ rights in Ireland, it actually has the lowest rates of pretrial detention of
these three nations. The United States, on the other hand, has over ten times the proportion of its
population in pretrial detention, and six times that of the UK. This highlights the key
18
leader in the percentage of its population which is behind bars. That being said, it is perhaps no
surprise that it also has a much higher proportion of its population in pretrial detention.
The United Nations Office on Drugs and Crime also has statistics on the average duration
of prison sentences in various countries; however, the United States is not included in this
particular database (“Special data Collection on Persons held in Prisons (2010-2012)”, 2013).
The information is still of interest for the other two cases, as it allows for a comparison of the
semi-raw figures above to the prison population as a whole. In Ireland, 12% of the prison
population has yet to be sentenced, whereas 88% are serving their sentences; in the UK, for
England and Wales, 9% are awaiting sentencing, while 87% are already sentenced, and for the
UK Northern Ireland, 28% are awaiting sentencing while 72% have been sentenced (“Special
data Collection on Persons held in Prisons (2010-2012)”, 2013). The UK average, calculated
from those numbers, is 18.5% awaiting trial and 79.5% already sentenced. This makes Ireland
seem slightly more efficient in terms of clearing cases; however, as the next sections will
illustrate, this semblance of efficiency does not necessarily coincide with accuracy or justice.
Since the US laws will be looked at by state, it makes sense to include statistics for our
two exemplar states, North Carolina and New York. The North Carolina Court System provides
extensive data on caseloads and case duration on its website. For the purposes of this analysis,
the duration of the cases will be compared, over time, for the statewide totals only. As statewide
totals are provided only for each separate level of court, those will be listed here and added
together to calculate the true state totals, highlighted in blue. The aim for including this data is to
attain a numerical representation of the expediency of justice in the state, which is related to
pre-trial detention; it also provides some practical context for the discourse on caseload pressures.
19
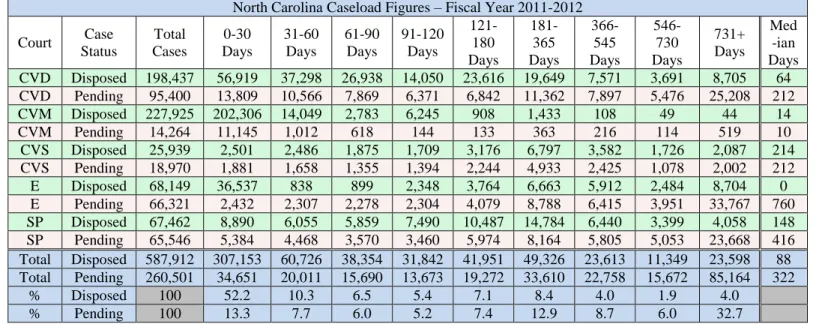
cases have, as yet, no “age”.) The case ages are separated into 9 increments in the data. For the
sake of integrity, those 9 increments are retained in these tables. Since the data for the thousands
of individual cases is not available, the exact median for the total rows cannot be calculated;
thus, to approximate it, the average of the court medians is used, rounded to the nearest whole
day. Percentages for each case age category have also been calculated to make the data more
meaningful and easier to digest and compare. These are rounded to the nearest tenth. Calculated
figures are shaded in blue. All North Carolina caseload and budget data is presented for the
TABLE 5 – NORTH CAROLINA STATEWIDE CASELOAD AND CASE AGES – FISCAL YEAR 2011-2012
North Carolina Caseload Figures – Fiscal Year 2011-2012 Court Case
Status Total Cases 0-30 Days 31-60 Days 61-90 Days 91-120 Days 121-180 Days 181-365 Days 366-545 Days 546-730 Days 731+ Days Med -ian Days CVD Disposed 198,437 56,919 37,298 26,938 14,050 23,616 19,649 7,571 3,691 8,705 64 CVD Pending 95,400 13,809 10,566 7,869 6,371 6,842 11,362 7,897 5,476 25,208 212 CVM Disposed 227,925 202,306 14,049 2,783 6,245 908 1,433 108 49 44 14 CVM Pending 14,264 11,145 1,012 618 144 133 363 216 114 519 10 CVS Disposed 25,939 2,501 2,486 1,875 1,709 3,176 6,797 3,582 1,726 2,087 214 CVS Pending 18,970 1,881 1,658 1,355 1,394 2,244 4,933 2,425 1,078 2,002 212 E Disposed 68,149 36,537 838 899 2,348 3,764 6,663 5,912 2,484 8,704 0 E Pending 66,321 2,432 2,307 2,278 2,304 4,079 8,788 6,415 3,951 33,767 760 SP Disposed 67,462 8,890 6,055 5,859 7,490 10,487 14,784 6,440 3,399 4,058 148 SP Pending 65,546 5,384 4,468 3,570 3,460 5,974 8,164 5,805 5,053 23,668 416 Total Disposed 587,912 307,153 60,726 38,354 31,842 41,951 49,326 23,613 11,349 23,598 88 Total Pending 260,501 34,651 20,011 15,690 13,673 19,272 33,610 22,758 15,672 85,164 322
% Disposed 100 52.2 10.3 6.5 5.4 7.1 8.4 4.0 1.9 4.0 % Pending 100 13.3 7.7 6.0 5.2 7.4 12.9 8.7 6.0 32.7
Data (except totals and percentages) from: (“Caseload Activity Reports – Fiscal Year 2011…”, 2012).
The percentages bring to light a surprising fact about case lengths in North Carolina. One would expect disposed cases to have
higher ages, as they have already been through the process, and for the pending cases to have smaller ages, as they still have a ways to
go before their resolution. However, as the percentages show, 52.2% of the cases which were disposed in this fiscal year were 30 days
old or less, whereas most of the pending cases, 32.7%, were in the highest age range of 731+ days, which is two years or more. This
means that, while most of the pending cases have been pending or continued for two years or more, the majority of new cases which
come in are heard and disposed within 30 days or less. One of the factors which came to mind in identifying areas to study and
compare for this research was the procedures for creating dockets, with the goal of suggesting policy changes to ensure older cases are
heard first. However, this had to be eliminated because there was no information available for the case study nations on docket
creation procedures. Still, this data here shows that newer cases are being disposed of quickly, while older cases are left pending.
Was this a temporary anomaly, or a consistent trend? The data for the rest of the fiscal years considered sheds some light on this.
TABLE 6 – NORTH CAROLINA STATEWIDE CASELOAD AND CASE AGES – FISCAL YEAR 2012-2013
North Carolina Caseload Figures – Fiscal Year 2012-2013 Court Case
Status Total Cases 0-30 Days 31-60 Days 61-90 Days 91-120 Days 121-180 Days 181-365 Days 366-545 Days 546-730 Days 731+ Days Med-ian Days CVD Disposed 188,237 53,519 34,870 25,089 14,048 23,734 19,760 6,568 3,397 7,252 65 CVD Pending 92,137 11,838 9,825 6,880 5,124 6,920 11,526 7,850 4,856 27,318 258 CVM Disposed 219,970 197,096 12,843 2,281 5,703 714 1,129 84 54 66 14 CVM Pending 13,433 10,169 1,036 640 126 162 285 149 141 725 11 CVS Disposed 24,002 2,363 2,196 1,707 1,613 2,845 6,398 3,586 1,595 1,699 216 CVS Pending 16,712 1,574 1,493 1,433 1,125 1,974 3,889 2,054 1,199 1,971 209 E Disposed 69,088 38,133 937 878 2,347 3,625 6,623 5,772 2,459 8,314 0 E Pending 68,115 2,370 2,395 2,748 2,206 4,662 8,876 6,431 4,202 34,225 738 SP Disposed 65,239 8,654 5,710 5,708 6,906 10,637 14,458 4,506 2,682 5,978 150 SP Pending 67,409 4,686 4,200 4,669 3,111 5,615 11,285 5,628 3,397 24,818 368 Total Disposed 566,536 299,765 56,556 35,663 30,617 41,555 48,368 20,516 10,187 23,309 89 Total Pending 257,806 30,637 18,949 16,370 11,692 19,333 35,861 22,112 13,795 89,057 317
% Disposed 100 52.9 10.0 6.3 5.4 7.3 8.5 3.6 1.8 4.1 % Pending 100 11.9 7.4 6.3 4.5 7.5 13.9 8.6 5.4 34.5
Data (except totals and percentages) from: (“Caseload Activity Reports – Fiscal Year 2012…”, 2013).
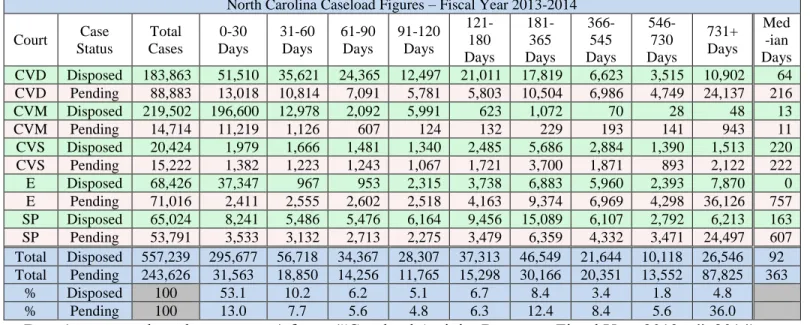
TABLE 7 – NORTH CAROLINA STATEWIDE CASELOAD AND CASE AGES – FISCAL YEAR 2013-2014
North Carolina Caseload Figures – Fiscal Year 2013-2014 Court Case
Status Total Cases 0-30 Days 31-60 Days 61-90 Days 91-120 Days 121-180 Days 181-365 Days 366-545 Days 546-730 Days 731+ Days Med -ian Days CVD Disposed 183,863 51,510 35,621 24,365 12,497 21,011 17,819 6,623 3,515 10,902 64 CVD Pending 88,883 13,018 10,814 7,091 5,781 5,803 10,504 6,986 4,749 24,137 216 CVM Disposed 219,502 196,600 12,978 2,092 5,991 623 1,072 70 28 48 13 CVM Pending 14,714 11,219 1,126 607 124 132 229 193 141 943 11 CVS Disposed 20,424 1,979 1,666 1,481 1,340 2,485 5,686 2,884 1,390 1,513 220 CVS Pending 15,222 1,382 1,223 1,243 1,067 1,721 3,700 1,871 893 2,122 222 E Disposed 68,426 37,347 967 953 2,315 3,738 6,883 5,960 2,393 7,870 0 E Pending 71,016 2,411 2,555 2,602 2,518 4,163 9,374 6,969 4,298 36,126 757 SP Disposed 65,024 8,241 5,486 5,476 6,164 9,456 15,089 6,107 2,792 6,213 163 SP Pending 53,791 3,533 3,132 2,713 2,275 3,479 6,359 4,332 3,471 24,497 607 Total Disposed 557,239 295,677 56,718 34,367 28,307 37,313 46,549 21,644 10,118 26,546 92 Total Pending 243,626 31,563 18,850 14,256 11,765 15,298 30,166 20,351 13,552 87,825 363
% Disposed 100 53.1 10.2 6.2 5.1 6.7 8.4 3.4 1.8 4.8 % Pending 100 13.0 7.7 5.6 4.8 6.3 12.4 8.4 5.6 36.0
Data (except totals and percentages) from: (“Caseload Activity Reports – Fiscal Year 2013…”, 2014).
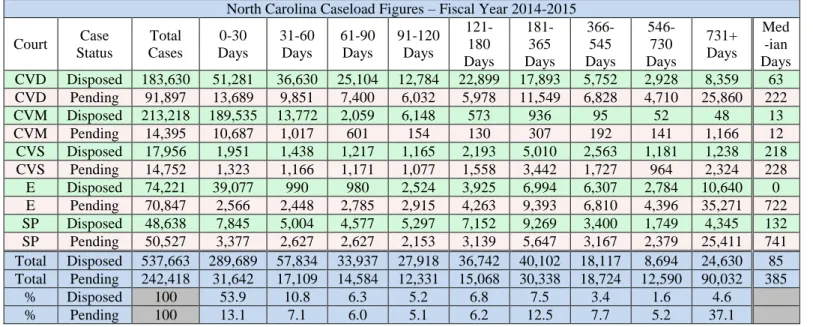
TABLE 8 – NORTH CAROLINA STATEWIDE CASELOAD AND CASE AGES – FISCAL YEAR 2014-2015
North Carolina Caseload Figures – Fiscal Year 2014-2015 Court Case
Status Total Cases 0-30 Days 31-60 Days 61-90 Days 91-120 Days 121-180 Days 181-365 Days 366-545 Days 546-730 Days 731+ Days Med -ian Days CVD Disposed 183,630 51,281 36,630 25,104 12,784 22,899 17,893 5,752 2,928 8,359 63 CVD Pending 91,897 13,689 9,851 7,400 6,032 5,978 11,549 6,828 4,710 25,860 222 CVM Disposed 213,218 189,535 13,772 2,059 6,148 573 936 95 52 48 13 CVM Pending 14,395 10,687 1,017 601 154 130 307 192 141 1,166 12 CVS Disposed 17,956 1,951 1,438 1,217 1,165 2,193 5,010 2,563 1,181 1,238 218 CVS Pending 14,752 1,323 1,166 1,171 1,077 1,558 3,442 1,727 964 2,324 228 E Disposed 74,221 39,077 990 980 2,524 3,925 6,994 6,307 2,784 10,640 0 E Pending 70,847 2,566 2,448 2,785 2,915 4,263 9,393 6,810 4,396 35,271 722 SP Disposed 48,638 7,845 5,004 4,577 5,297 7,152 9,269 3,400 1,749 4,345 132 SP Pending 50,527 3,377 2,627 2,627 2,153 3,139 5,647 3,167 2,379 25,411 741 Total Disposed 537,663 289,689 57,834 33,937 27,918 36,742 40,102 18,117 8,694 24,630 85 Total Pending 242,418 31,642 17,109 14,584 12,331 15,068 30,338 18,724 12,590 90,032 385
% Disposed 100 53.9 10.8 6.3 5.2 6.8 7.5 3.4 1.6 4.6 % Pending 100 13.1 7.1 6.0 5.1 6.2 12.5 7.7 5.2 37.1
Data (except totals and percentages) from: (“Caseload Activity Reports – Fiscal Year 2014…”, 2015).
The data for the other fiscal years shows that, if anything, the observed trend has been getting stronger each year,
resulting in ever more polarized case ages. One potential explanation for the high number of cases processed in 30 days or less
is plea bargaining. If this is the case, then the increased polarization of the figures may be indicative of an increase in plea
bargaining. In the same data sets used for the figures above, one of the sub-categories for “disposed” cases is “Final
Judgement No Trial;” these are the cases which were resolved with a plea bargain, or in case of civil trials, settled outside of
24
court (as dismissals are listed separately). Ideally, it would be informative to compare the length
of time before the plea bargain (“age” of case in the data) with the outcome; however, the
outcomes are not included in the data. What can be calculated from the data, however, is the
percentage of disposed cases that were settled without a trial. These are calculated in the table
below.
TABLE 9 – NORTH CAROLINA “FINAL JUDGEMENT NO TRIAL” CASE TOTALS AND
PERCENTAGES
“Final Judgement No Trial” Case Totals and Percentages
Court 2011-20121 2012-20132 2013-20143 2014-20154
CVD 46,081 43,352 43,967 42,612
CVM 142 244 432 412
CVS 3,398 3,131 2,775 2,486
E 6 13 9 7
SP 118 134 115 92
Total Pleas 49,745 46,874 47,298 45,609 Total Disposed* 587,912 566,536 557,239 537,663 % of disposed cases
which are pleas 8.5 8.3 8.5 8.5
*Calculated in the previous tables
1 (“Caseload Activity Reports – Fiscal Year 2011…”, 2012).
2 (“Caseload Activity Reports – Fiscal Year 2012…”, 2013).
3 (“Caseload Activity Reports – Fiscal Year 2013…”, 2014).
4 (“Caseload Activity Reports – Fiscal Year 2014…”, 2015).
Since there was no key provided for the court abbreviations, one can only speculate as to
which courts they are. Although it wasn’t apparent from the figures for the ages of the cases, the
large number of cases settled out of court seems to support the notion that the three categories
25
this is the case, then these are most likely settlements and are irrelevant to this research. This is
not a certainty, so they were reported in this table as presented in the data; however, given this
possibility, the data for “Final Judgement No Trial” are presented again below, without the first
three courts (the total disposed is also presented below minus those three courts for accuracy of
the percentage calculation).
TABLE 10 – NORTH CAROLINA “FINAL JUDGEMENT NO TRIAL” E AND SP ONLY
“Final Judgement No Trial” Case Totals and Percentages – E and SP only
Court 2011-20121 2012-20132 2013-20143 2014-20154
E 6 13 9 7
SP 118 134 115 92
Total Pleas 124 147 124 99
Total Disposed E &SP
only 135,611 134,327 133,450 122,859 % of disposed cases
which are pleas 0.1 0.1 0.1 0.1
1 (“Caseload Activity Reports – Fiscal Year 2011…”, 2012).
2 (“Caseload Activity Reports – Fiscal Year 2012…”, 2013).
3 (“Caseload Activity Reports – Fiscal Year 2013…”, 2014).
4 (“Caseload Activity Reports – Fiscal Year 2014…”, 2015).
While the complete statistics in the previous table show that only 8.5% of cases are
settled without trial, if the CV ones are indeed civil suits, then that leaves only 0.1% of criminal
cases to plea bargaining. This does not mean that pleas and settlements are not the cause behind
the polarized data, as the largest number of cases resolved in 30 days or less, in the previous
tables, was in the CV courts. It may be worth noting that there is also no indication what “E”
26
median age is always reported as zero, one is inclined to believe it is a special circumstance; it
may just mean that, given that the largest category for the group was 0 to 30 days, 0 was the most
common duration. However, not knowing whether “E” is criminal or civil, the strange reporting
of the median age does not affect the inclusion of it in cases settled out of court. It may also do
to consider that “SP” might stand for Superior Court (Which raises the question of why, in
thousands of records, there was no statewide data for District Court). Either way, this data on
case ages must be considered in conjunction with budgetary data to see if there are any
noticeable correlations.
For this table, the “certified budget” is used for comparison rather than the
“expenditures” fund amount, as the former is what is actually allotted for use and shows the
yearly changes, whereas the fund total is around $460 million for all of the years listed, with an
average percent change of +0.435% (“North Carolina Courts Statistical…”, 2015, p.3). The
fiscal years studied were chosen to match those examined in the caseload statistics, however, it is
interesting to note that, in the four fiscal years preceding those detailed below, the
“expenditures” fund saw a 13.81 percent surge, followed by modest raises, and then a 6.63
percent drop to the $460 million +/- 8 million mark at which it has so far stabilized (“North
Carolina Courts Statistical…”, 2012, p.3). As previously stated, although the amount in the fund
has not varied much in the years studied, the amount of such which was actually approved for
spending by the General Assembly has. Those figures, along with key sub figures which were
considered for the other nations, are in the table below. North Carolina’s court budget report
does not show data per capita, nor per case, but simply in whole dollar amounts. Additionally,
27
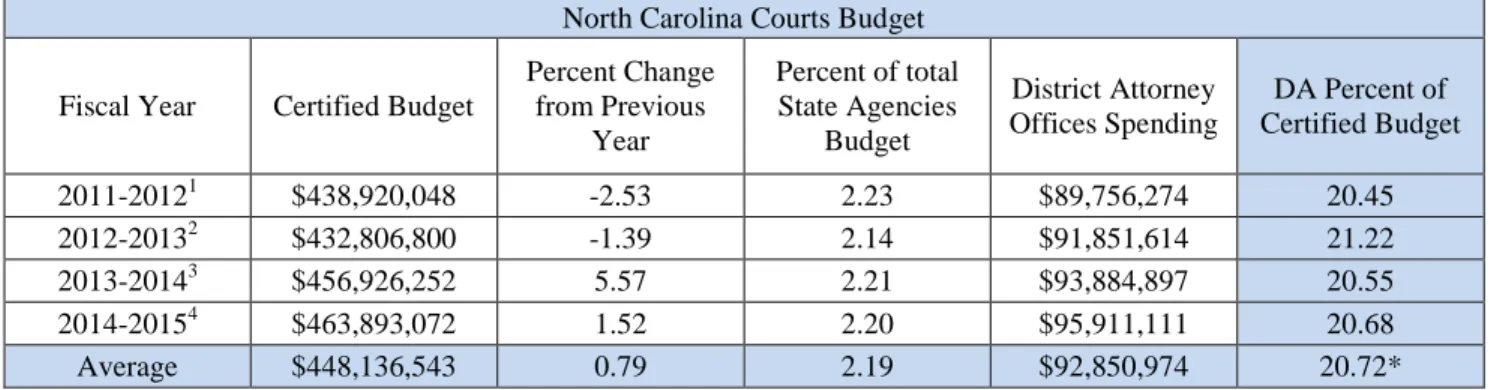
TABLE 11 – NORTH CAROLINA COURTS BUDGET
North Carolina Courts Budget Fiscal Year Certified Budget
Percent Change from Previous
Year
Percent of total State Agencies
Budget
District Attorney Offices Spending
DA Percent of Certified Budget 2011-20121 $438,920,048 -2.53 2.23 $89,756,274 20.45 2012-20132 $432,806,800 -1.39 2.14 $91,851,614 21.22 2013-20143 $456,926,252 5.57 2.21 $93,884,897 20.55 2014-20154 $463,893,072 1.52 2.20 $95,911,111 20.68 Average $448,136,543 0.79 2.19 $92,850,974 20.72*
*if calculated from the Average row, this figure rounds up to 20.72, but if calculated from its
column, which are already rounded figures, it rounds up to 20.73. The 20.72 was used so that no
figure involves more than one rounding.
1 (“North Carolina Courts Statistical…”, 2012, p.3-4).
2 (“North Carolina Courts Statistical…”, 2013, p.3-4).
3 (“North Carolina Courts Statistical…”, 2014, p.3-4).
4 (“North Carolina Courts Statistical…”, 2015, p.3-4).
This budget table highlights a few key facts. Although the court system budget has seen
a marginal increase of less than 1% per year on average, its percentage of the total state budget
has been fairly constant, meaning that the slight increase in funding is a result of increased
funding for the state overall. Since there was no data included for the budget for defense
council, the proportions cannot be compared. However, it is notable that, even in years when the
overall court system budget was reduced, the budget for District Attorneys’ offices has been on a
steady rise of $2 million per year, although these increases have also coincided with a relative
28
New York, unfortunately, does not have a statewide caseload statistics database available.
The only caseload statistics it provides are for New York City from 2011, along with the number
of judges employed, from which caseload per judge can be calculated.
TABLE 12 – NEW YORK CITY CRIMINAL COURT CASELOAD STATISTICS 2011
New York City Criminal Court Caseload Statistics 2011 Judges = 107 On-line Arrests Summonses Total Caseload per Judge* Filings 357,842 528,618 886,460 8,285 Dispositions 355,614 331,847 687,461 6,425 Total Cases 713,456 860,465 1,573,921 14,710
*rounded to nearest whole number
Data from: (“New York City Criminal Court…”, 2012).
Consider the implications of this data. This means that each judge in New York City
presided over the conclusion of 6,425 cases in 2011. Although not every day is a working day, if
you were to divide this by 365 days, that would amount to 17.6 cases heard per judge, per day.
Which, assuming an 8-hour workday in court, would leave only 27.27 minutes per case. It is
clear that the sheer volume of cases renders trying all of them practically impossible. It is worse
when you consider the fact that more new cases are filed each year than are completed.
How does North Carolina compare in this regard? Although the caseload statistics
database did not include caseloads per judge, a fact sheet released by the North Carolina Court
System from fiscal year 2014-2015 does list the number of cases and number of judges for
29
TABLE 13 – NORTH CAROLINA CASELOADS PER JUDGE
Cases filed Cases
disposed Total cases
Number of Judges
Cases filed per judge
Cases disposed per judge
Overall caseload per
judge District
Court 2,407,195 2,588,957 4,996,152 270 8,916 9,589 18,504 Superior
Court 262,825 296,219 559,044 112 2,347 2,645 4,991 Total 2,670,020 2,885,176 5,555,196 382 6,990 7,553 14,542
Rounded to nearest whole number; total row calculated from case and judge totals, not added or
averaged from the rows above
Data from: (“Judicial Branch Fact Sheet,” 2015, p.2).
Based upon these numbers, North Carolina judges have an even larger average caseload than
those in New York City. Thus, it is no wonder that plea bargaining is a default tactic for clearing
the cases; this is, of course, the explanation for how each judge can dispose of 6 to 9 thousand
cases annually. It stands to reason that this high caseload is a major contributor to the lengthy
pre-trial detentions in the city, which were alluded to in the introduction. It would be very
interesting to see case age statistics for New York like those provided for North Carolina, even if
only for New York City. However, these are currently not available.
In keeping with its limited availability of data, New York only has the court system
budget for the upcoming fiscal year available; at least, it is statewide and thus comparable to the
North Carolina figures. The budget document also includes the 2015-2016 figures for
comparison. Interestingly, unlike North Carolina, this data includes legal aid, but does not
specify the allocation for prosecution. It does, however, include funding for grievances against
attorney malpractice. The fact that this is a budget allocation specified in the report may be a
reflection of the scope of the problem. Although many cases of prosecutorial misconduct go
unchallenged, the report does provide figures on the number of “Attorney Discipline” cases
30
and 12,891 disposed cases (“Fiscal Year 2016-2017 Budget,” 2016, p.137). Although this is a
reflection of the underlying cultural problems, it is still a positive, reformist, sign that such
matters are considered important enough to be duly addressed in the budget.
TABLE 14 – NEW YORK STATE COURT SYSTEM BUDGET DATA
New York State Court System Budget Fiscal
Year Total 1
Indigent Legal Services1
ILS Percent of total
Attorney Discipline
Program2
ADP Percent of total
2015-2016 $2,084,272,038 $25,000,000 1.2
2016-2017 $2,132,526,345 $25,000,000 1.2 $14,900,000 0.7
1 (“Fiscal Year 2016…”, 2016, p.15).
2 (“Fiscal Year 2016…”, 2016, p.156).
Although this budget information is far from comprehensive, it does include a key figure.
The Indigent legal services budget has a flat allowance of only 1.2 percent of the court system
budget. Of course, administrative costs are a large proportion of any court system’s budget,
however, that generally leaves behind more than 1.2 percent each for defense and prosecution. If
North Carolina is of any comparison, it consistently budgets between 20 and 21 percent of its
court system funding for the District attorneys’ offices. It would stand to reason that the Indigent
Legal services office would receive something in the same range of funding. Although neither
state provided funding data for both sides of the aisle, that which they did provide speaks
volumes for a legal system whose culture values conviction rates approximately 20 times more
31
system that is already drowning in backlogs. As the preceding literature discourse suggests, this
strain exacerbates the situation for all of the factors studied. Bearing these systemic constraints
in mind, the legislation and practices of the three countries will be compared to identify
32
ANALYSIS OF LEGISLATION AND PRACTICE
In this section, relevant legislation will be examined and compared to identify differences
which may be affecting the outcomes of the system. For the US laws, the idea was to pick a
reformist state and a non-reformist state to enhance the comparative analysis. However, in
reality, they are not so clearly distinguished. The two states were chosen for the ways in which
they stand out in terms of the results of their systems. Although one leans more towards reform,
it could be argued that it has a longer way to go from its starting point, whereas the other, while
having a better starting position, is not so actively seeking to reform, nor is it even addressing
some of the issues at hand. New York is an excellent state to examine if only for the infamy of
Riker’s Island, as noted in the introduction. However, it is actually the reformist example, as it
has also implemented legal reforms in recent years to address its short-comings. North Carolina
is our non-reformist example, since the only reform efforts are federal, and that there does not
seem to be legislation in this state which mentions and inmate’s right to legal representation
while incarcerated. The subsections for North Carolina, the UK, New York, and Ireland are
presented in that order so that, rather than discuss the US at length all at once, it is easier to draw
more side by side comparisons between the states and the other two countries. The laws
examined for these two US states, the UK, and Ireland will be those pertaining to bail (for
pretrial detention) and those pertaining to access to legal representation while incarcerated
33 North Carolina
First, let’s examine the North Carolina laws pertaining to Bail and Pretrial release. The
law begins by establishing the general guidelines. Defendants who were involuntarily
committed either before or after the crime do not have a right to pretrial release and are simply
sent back their respective institutions (Criminal Procedure Act: Bail, 2013). As they are not
incarcerated while awaiting trial, for the purposes of this thesis, this counts as release. In all
other “noncapital” cases, a judge must set “conditions of pretrial release;” defendants in capital
trials can also be released by a judge, although there are more restrictions on their terms of
release (Criminal Procedure Act: Bail, 2013).
The Criminal Procedure Act also lists conditions which, when satisfied, result in “a
rebuttable presumption” that the only way to make sure the defendant will be present for his or
her trial is to keep him or her detained; in other words, the statute lists situations in which a
defendant, by default, will not be released on bail (Criminal Procedure Act: Bail, 2013). The
conditions which trigger this guilty-until-proven-innocent perspective are as follows: If the
offense involved Drug trafficking, Gangs, or Illegal firearms; occurred while the defendant was
out on bail for a different case; or the defendant has been convicted of a similar offense, or, in
the case of the firearms, completed a sentence for a similar offense within the past five years
(Criminal Procedure Act: Bail, 2013). Although these conditions contribute to a flight or safety
risk, a judge can still decide to release such defendants on bond if he or she is a low flight risk
and is not an “unreasonable risk” to society; however if the offense occurred while the defendant
was already on pretrial release for another crime, then a secured bond of “at least double” the
most recent bond amount is required, or a minimum $1,000 bond if there was none for the
34
The law also outlines the requirements for and “conditions of pretrial release” (Criminal
Procedure Act: Bail, 2013). At least one of the five listed conditions is required to be part of a
defendant’s release; these conditions are: a written promise to appear; an unsecured bond; in the
custody of a specified individual or “organization”; a bond secured by either cash or another
“solvent” asset; or house arrest with electronic monitoring (Criminal Procedure Act: Bail, 2013).
The first three conditions are the default conditions for pretrial release; the last two are to be used
only if the judge determines that the unsecured options to be insufficient insurance of the
defendant’s return for trial (Criminal Procedure Act: Bail, 2013). A secured bond is required for
those released on house arrest, and optional for those released into another’s custody (Criminal
Procedure Act: Bail, 2013). A judge can also impose restrictions on various aspects of a
defendant’s life and actions during pre-trial release. These can include whereabouts and
associations of the defendant as well as on “alcohol consumption” (Criminal Procedure Act:
Bail, 2013).
According to the statute, the factors which a judge must consider in order to determine
the conditions for release are as follows: the type of charge and its specific “circumstances”; the
available “evidence”; and factors which could contribute to or detract from flight risk, such as
connections to “family”, job, “financial” means, and his or her “character, and mental
condition”; intoxication to the extent that the defendant is dangerous to himself or others; how
long the defendant has lived in his or her current residence; his or her criminal record; if the
defendant has historically been a flight risk or failed to appear; and any additional relevant
information (Criminal Procedure Act: Bail, 2013). A Magistrate or Clerk of Court can amend
pretrial release conditions before the defendant’s trial begins, and a judge can change the terms at
35
also be spontaneously detained for up to twenty-four hours for testing purposes if there is
reasonable suspicion that he or she may have AIDS or Hepatitis B and was involved in an
“nonsexual” incident which may have exposed someone to a disease (Criminal Procedure Act:
Bail, 2013). No existing North Carolina statutes were found in this research to explicitly address
the right to legal representation for the incarcerated after sentencing; however, the state
legislature recently addressed this issue by acting in a way which acknowledges the lack of such
a legal guarantee.
In 2013, the North Carolina state senate’s budget, “SB 402,” sought to defund the “North
Carolina Prisoner Legal Services (NCPLS)” (Doran, 2013), a non-profit contracted through “the
Office of Indigent Services” (North Carolina Prisoner Legal Services, 2015) of the “Department
of Corrections…to provide legal services” for the incarcerated (Doran, 2013). Although the
constitution does not specifically state that prisoners have the “right to counsel,” the sixth
amendment, which outlines the right to counsel for “all criminal prosecutions” and direct appeals
thereof, provides a basis on which to argue to intended or implied right to legal aid while in the
system (Doran, 2013). There are also several Supreme Court cases which have set a precedent
for this right of prisoners to have “access to the courts” (Doran, 2013). Although the North
Carolina Institute for Constitutional Law names several, such as Ryland V. Shapiro, an in-depth
description of the relevant case law is beyond the scope of this analysis. Suffice it to say that the
North Carolina Prisoner Legal Services themselves cite “Bounds V. Smith” as the basis for this
right (2015). The idea that prisoners have a constitutional right to legal services also stems from
the “First Amendment right ‘to petition the Government for redress of grievances” (Doran,
2013). This particular budget cut did not pass in 2013 (North Carolina Prisoner Legal Services,
36
by a vague constitutional thread, with no protection, and in fact, with threats on the state level.
The United Kingdom, on the other hand, has passed reform legislation which expand the rights
of the accused, to a certain extent.
United Kingdom
The Legal Aid, Sentencing and Punishment of Offenders Act of 2012 made several
changes to the Criminal Justice Act of 2003. Ideally, it may be enlightening to compare the 2003
act procedures with the new ones, to determine if this was a change in the right or the wrong
direction in terms of prisoners’ rights; however, due to the limited scope of this project and the
variety of evidence to examine, this analysis will only use the current situation, the 2012 act’s
provisions, and compare them to the other nations in question, with the focus on future progress.
Section 13 of the Legal Aid, Sentencing and Punishment of Offenders Act of 2012
provides starting “advice and assistance” for those in police “custody” (Legal Aid, Sentencing
and Punishment of Offenders Act 2012, 2012). Section 15 states that legal assistance is available
to those who are under criminal investigations, those who are already in court, and those who
have been on trial (Legal Aid, Sentencing and Punishment of Offenders Act 2012, 2012). These
two provisions seem to contradict each other on whether those in police custody have the right to
legal assistance or not. Section 16 further confuses this issue by saying that those who qualify
for representation also have access to such for “bail proceedings” with regards to that case,
including “preliminary or incidental” hearings (Legal Aid, Sentencing and Punishment of
37
establish “exceptions for proceedings” occurring more than a specified length of time before or
after the main trial (Legal Aid, Sentencing and Punishment of Offenders Act 2012, 2012).
According to section 17 of the act, in determining whether someone is eligible for legal
aid, in addition to “financial resources,” one must consider the risk to the individual’s “liberty,”
“livelihood,” or “reputation” posed by a conviction, the potential for a defining case law, the
individual’s ability to represent his or herself, and whether there will be other witnesses to
question (Legal Aid, Sentencing and Punishment of Offenders Act 2012, 2012). According to
sections 18 and 19 of the act, these determinations can be made by a director or by the court
(Legal Aid, Sentencing and Punishment of Offenders Act 2012, 2012). Section 20 of the act
states that a preliminary assessment of a suspect’s eligibility for legal aid can be made during an
initial investigation, preceding the criminal charges (Legal Aid, Sentencing and Punishment of
Offenders Act 2012, 2012).
Section 108 of the Legal Aid, Sentencing and Punishment of Offenders Act of 2012
serves as an amendment of the Criminal Justice Act of 2003; completely replacing the
procedures for counting time in custody or pretrial detention “towards time served” (Legal Aid,
Sentencing and Punishment of Offenders Act 2012, 2012). The new act states that the days that
a defendant was in custody count towards the reduction of his or her sentence, with a few
stipulations (Legal Aid, Sentencing and Punishment of Offenders Act 2012, 2012). If the
offender was in custody for more than one offense, each day counts only once, towards one
offense; additionally, a day cannot count towards the twenty-eight days “before automatic
release” (Legal Aid, Sentencing and Punishment of Offenders Act 2012, 2012). To define
automatic release, the law refers the reader to section 255 of the Criminal Justice Act of 2003