EXPOSURE TO HUMAN SOURCE-ASSOCIATED FECAL INDICATORS AND SELF-REPORTED ILLNESS AMONG SWIMMERS
Melanie Denise Napier
A dissertation submitted to the faculty at the University of North Carolina at Chapel Hill in partial fulfillment of the requirements for the degree of Doctor of Philosophy in the
Department of Epidemiology in the Gillings School of Global Public Health.
Chapel Hill 2016
© 2016
ABSTRACT
Melanie Denise Napier: Exposure To Human Source-Associated Fecal Indicators And Self-Reported Illness Among Swimmers
(Under the direction of Charles Poole and Timothy Wade)
Background: Current fecal indicator bacteria used to assess illness risks in recreational waters (E. coli, enterococci) cannot discriminate among sources of
contamination. To address this limitation, human-associated Bacteroides and chemical markers have been proposed, but the risk of illness associated with human fecal
indicators is unclear. We estimated associations between microbial and chemical markers of human fecal pollution and self-reported illness among body immersion swimmers at U.S. beaches during 2003 – 2007.
Methods: Participants were surveyed about beach activities and water exposure on the day of their beach visit and followed up 10 to 12 days later to document illness
experienced since the beach visit. At 6 beaches, water was analyzed for the presence of human-associated Bacteroides markers: HF183, BsteriF1, BuniF2, HumM2. At 5 beaches, water was analyzed for 56 anthropomorphic chemicals. Adjusted standardized risk differences (RD) and 95% confidence intervals (CI) for the indicator-illness
Results: Overall we observed little evidence of association between Bacteroides
markers and illness, and between chemical markers and illness among body immersion swimmers. There was a pattern of increased risks of GI illness (RD=1.9%; 0.1%, 3.7%), diarrhea (RD=1.3%; -0.2%, 2.7%), and respiratory illness (RD=1.1%; -0.2%, 2.5%) associated with the BsteriF1 marker. There was no evidence that Bacteroides markers acted as modifiers of general Enterococcus and illness. Several chemicals also showed a pattern of increased risks, including bisphenol A-GI illness, cholesterol-GI illness, household wastewater products-respiratory illness, and tributyl phosphate-respiratory illness. Phenol exposure increased the magnitude of association between general
Enterococcus dichotomized at policy-relevant cut-points and GI illness, eye ailments, and respiratory illness by 3-5%.
Conclusions: Human-associated Bacteroides and chemical markers were not consistently associated with swimming-associated illness, though patterns suggest possible increased risks. It is not clear that these findings are generalizable to beach sites impacted predominantly by animal sources, runoff, or sporadic sources of contamination. Additional research is needed to support the use of human-associated indicators in
ACKNOWLEDGMENTS
Words cannot express my gratitude for the village of folks who have encouraged me through the ups and downs of my graduate school journey.
To my advisor, Charlie Poole: Thank you for being my biggest advocate and guide during my master’s and dissertation research. Your patience and vast knowledge of epidemiologic principles and methods was invaluable to me as I learned how to be a thoughtful researcher.
To Timothy Wade: Thank you for serving as my content expert, providing access to the NEEAR study, and for indulging my desire for weekly meetings despite a busy schedule. I appreciate the thoughtful criticism, time, and attention you’ve shown me.
To my committee members: Thank you Steve Wing for partnering with me to do this research though it was outside your interest area. Thank you for helping me to keep the big picture in mind and not get lost in the details of such a complex topic. Thank you Jill Stewart for your sharing your expertise and passion for environmental microbiology with me. And thank you David Weber, for your practical advice and insightful comments on my very long drafts. I have benefitted tremendously from the knowledge and expertise of you all during all aspects of this work.
To those who generously consulted with me about methods, statistical software, and provided code: Alex Keil, Katie O’Brien, Jess Edwards, Nikhil Khankari, Xiojuan Li, Jordan Cates, Bradley Layton, Rachel Palmieri-Weber, Montika Bush, and Jessica Rinsky. Thank you!
Special thanks to Nancy Colvin, Carmen Woody, Valerie Hudock, Chandra Caldwell, and Jennifer Moore in the Department of Epidemiology student services office who provided practical advice to navigate administrative hurtles at UNC, and offered essential emotional and academic support.
To the agencies who funded my graduate school education: I am thankful for the generous gift of a Royster Kenan Fellowship and the many ways Royster Society
seminars, pub talks, and workshops have contributed to my professional development and knowledge. This work was also funded in part by a training grant from the National Institute of Environmental Health Sciences (T32 ES007018).
To Carmen Samuel-Hodge, Kristin Black, Loneke Blackman, Cara Person, Stephanie Baker White, Janelle Armstrong-Brown, and Jameta Barlow, Laurel Harduar-Morano, and the virtual ladies of the Sistah-docs group: Thank you for all that you’ve done in keeping me on track with my goals and progress with humor and candor, and for providing sisterhood and perspective during what can be a lonely journey.
To my UNC friends: Thank you for being outlets for stress and sources of expertise that I could call on at any time. You all have made the journey so much fun!
TABLE OF CONTENTS
LIST OF TABLES ... x
LIST OF FIGURES ... xiv
LIST OF ABBREVIATIONS ... xv
CHAPTER 1. INTRODUCTION ... 1
CHAPTER 2. BACKGROUND AND SIGNIFICANCE ... 3
Use of fecal indicator organisms to track pathogens ... 3
Conventional fecal indicators ... 4
Alternative indicators: Source tracking markers ... 8
Illness risks associated with human fecal indicators ... 14
Summary ... 16
Tables and Figures ... 18
CHAPTER 3. SPECIFIC AIMS ... 20
CHAPTER 4. RESEARCH DESIGN AND METHODS ... 22
Overview ... 22
Parent Study: National Epidemiological and Environmental Assessment of Recreational (NEEAR) Water Study ... 22
1. Study design and population ... 22
2. Beach descriptions ... 23
3. Data collection: Health surveys ... 24
4. Data collection: Outcome assessments ... 25
1. Study population ... 26
2. Definition of swimming ... 26
3. Exposure assessment ... 27
4. Outcome assessment ... 30
5. Covariate assessment ... 30
6. Effect measure modifiers ... 32
7. Data analysis ... 33
8. Sensitivity analyses ... 34
Aim 2: Human-associated chemical markers and risk of illness ... 35
1. Study population ... 35
2. Definition of swimming ... 35
3. Exposure assessment ... 35
4. Outcome assessment ... 38
5. Covariate assessment ... 38
6. Effect measure modifiers ... 38
7. Data analysis ... 39
8. Sensitivity analyses ... 40
Tables and Figures ... 42
CHAPTER 5. EXPOSURE TO HUMAN-ASSOCIATED FECAL INDICATORS AND SELF-REPORTED ILLNESS AMONG SWIMMERS AT RECREATIONAL BEACHES ... 46
Overview ... 46
Introduction ... 47
Discussion ... 61
Conclusion ... 67
Tables and Figures ... 69
CHAPTER 6. EXPOSURE TO HUMAN-ASSOCIATED CHEMICAL INDICATORS OF FECAL CONTAMINATION AND SELF-REPORTED ILLNESS AMONG SWIMMERS AT RECREATIONAL BEACHES ... 81
Overview ... 81
Introduction ... 82
Materials and Methods ... 84
Results ... 92
Discussion ... 97
Conclusion ... 102
Tables and Figures ... 103
CHAPTER 7. CONCLUSIONS ... 112
Summary of overall study aims and findings ... 112
Strengths ... 115
Limitations ... 116
Public health impact ... 117
Future directions ... 118
Final conclusions ... 120
APPENDIX A. CHAPTER 5 SUPPLEMENTAL TABLES AND FIGURES ... 122
APPENDIX B.CHAPTER 6 SUPPLEMENTAL TABLES AND FIGURES ... 151
LIST OF TABLES
Table 2.1. Select human pathogens associated with recreational water
settings ... 18 Table 2.2. 2012 EPA recreational water quality criteria for culture-based
methods ... 19 Table 2.3. 2012 EPA recreational water quality criteria for qPCR-based
methods ... 19 Table 4.1. Description of NEEAR beach sites included in this study ... 42 Table 5.1. Characteristics of NEEAR participants by body immersion
status ... 70 Table 5.2. Human Bacteroides markers detected by qPCR (n=2336 total
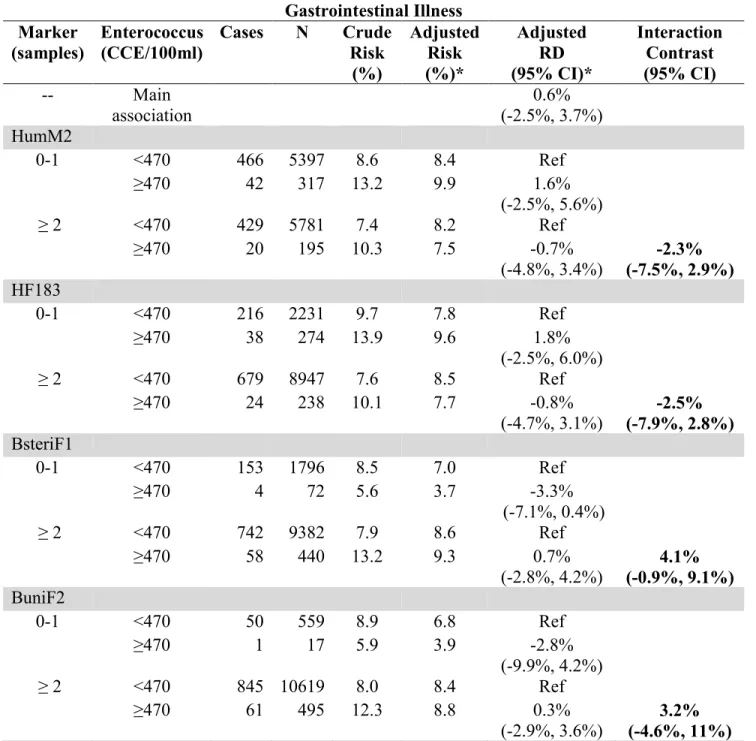
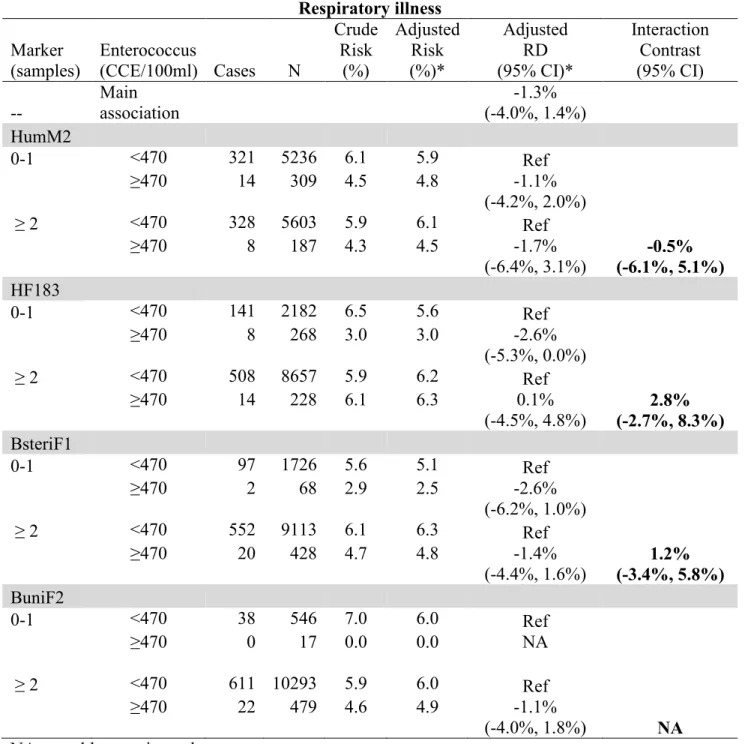
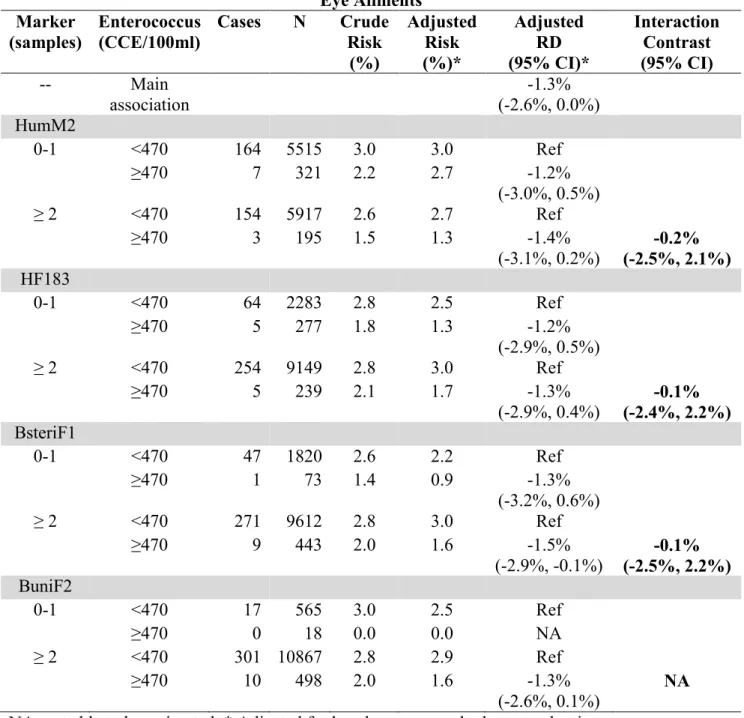
samples)... 73 Table 5.3(a-c). Modification of the adjusted standardized RD (95% CI) for
the association between illness and Enterococcus qPCR Method 1611 above and below EPA guidelines (geometric mean of 470 CCE/100ml for an illness rate of 36/1000) with detection/non-detection of Bacteroides markers among body immersion
swimmers in all beaches... 75 Table 5.4(a-c). Modification of the adjusted standardized RD (95% CI) for
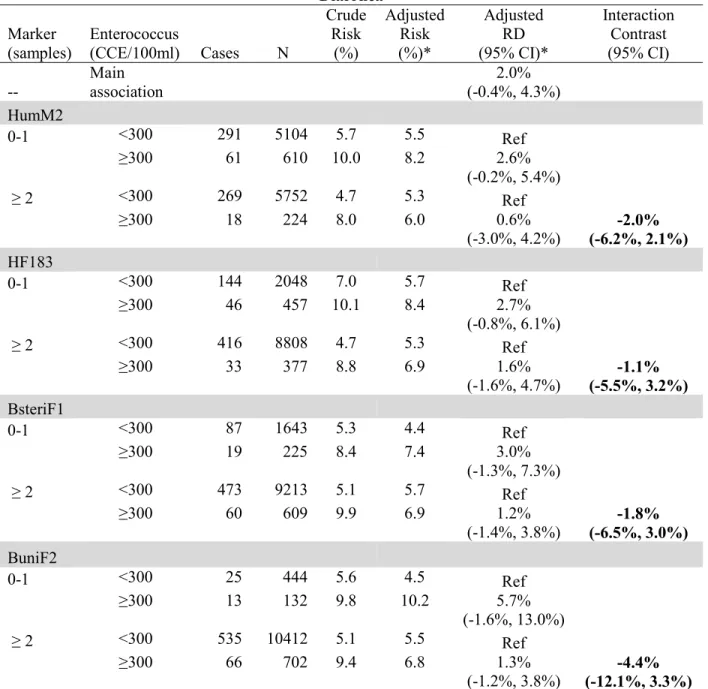
the association between illness and Enterococcus qPCR Method 1611 above and below EPA guidelines (geometric mean of 300 CCE/100ml for an illness rate of 32/1000) with detection/non-detection of Bacteroides markers among body immersion
swimmers in all beaches... 78 Table 6.1. Characteristics of NEEAR participants by body immersion
status ... 104 Table 6.2. Concentrations of chemicals in the NEEAR study (µg/L) ... 106 Table 6.3(a-c). Modification of the adjusted standardized RD (95% CI) for
the association between illness and Enterococcus qPCR Method 1611 above and below EPA guidelines (geometric mean of 470 CCE/100ml for an illness rate of 36/1000) with chemical markers (detected in all daily samples vs. <all) among body
immersion swimmers in all beaches ... 109 Table A.1a. Frequencies and standardized RD (95% CI) for the association
Table A.1b. Frequencies and standardized risk differences (95% CI) for the association between illness and human-associated
Bacteroides markers among body immersion swimmers in fresh
water beaches ... 124 Table A.1c. Frequencies and standardized risk differences (95% CI) for
the association between illness and human-associated Bacteroides markers among body immersion swimmers in
marine beaches ... 126 Table A.2a. Frequencies and standardized risk differences (95% CI) for
the association between illness and number of human-associated
Bacteroides markers among body immersion swimmers in all
beaches ... 128 Table A.2b. Frequencies and standardized risk differences (95% CI) for
the association between illness and number of human-associated
Bacteroides markers among body immersion swimmers in fresh
water beaches ... 130 Table A.2c. Frequencies and standardized risk differences (95% CI) for
the association between illness and number of human-associated
Bacteroides markers among body immersion swimmers in
marine beaches ... 132 Table A.3(a-d). Modification of the adjusted standardized RD (95% CI)
for the association between illness and Enterococcus qPCR Method 1611 above and below EPA guidelines (geometric mean of 470 CCE/100ml for an illness rate of 36/1000) with detection/non-detection of Bacteroides markers among body
immersion swimmers in all beaches ... 134 Table A.4(a-d). Modification of the adjusted standardized RD (95% CI)
for the association between illness and Enterococcus qPCR Method 1611 above and below EPA guidelines (geometric mean of 300 CCE/100ml for an illness rate of 32/1000) with detection/non-detection of Bacteroides markers among body
immersion swimmers in all beaches ... 138 Table A.5. Risk difference modification of the association between
Enterococcus general indicator measured continuously by qPCR (CCE/100ml) and illness with human-associated
Bacteroides markers in all beaches ... 142 Table A.6. Frequencies and standardized risk differences (95% CI) for the
association between illness and human-associated Bacteroides
Table A.7. Frequencies and standardized risk differences (95% CI) for the association between illness and human-associated Bacteroides
markers among swimmers who swallowed water in all beaches ... 149 Table B.1(a-g). Frequencies and standardized risk differences (95% CI)
for the association between illness and human-associated chemical markers (detected in all daily samples vs. <all) among
body immersion swimmers in all beaches ... 151 Table B.2(a-d). Modification of the adjusted standardized RD (95% CI)
for the association between illness and Enterococcus qPCR Method 1611 above and below EPA guidelines (geometric mean of 470 CCE/100ml for an illness rate of 36/1000) with chemical markers (detected in all daily samples vs. <all) among
body immersion swimmers in all beaches ... 159 Table B.3(a-g). Modification of the adjusted standardized RD (95% CI)
for the association between illness and Enterococcus qPCR Method 1611 above and below EPA guidelines (geometric mean of 300 CCE/100ml for an illness rate of 32/1000) with chemical markers (detected in all daily samples vs. <all) among
body immersion swimmers in all beaches ... 163 Table B.4(a-g). Risk difference modification of the association between
Enterococcus general indicator measured continuously (CCE/100ml) and illness with human-associated chemical
markers (detected in all daily samples vs. <all) in all beaches ... 170 Table B.5(a-g). Frequencies and risk differences (95% CI) for the
association between illness and categories of human-associated chemical markers among body immersion swimmers in all
beaches ... 177 Table B.6(a-g). Modification of the adjusted standardized RD (95% CI)
for the association between illness and Enterococcus qPCR Method 1611 above and below EPA guidelines (geometric mean of 470 CCE/100ml for an illness rate of 36/1000) with categories of chemical markers among body immersion
swimmers in all beaches... 184 Table B.7(a-g). Risk difference modification of the association between
Enterococcus general indicator measured continuously
(CCE/100ml) and illness with categories of human-associated
chemicals in all beaches ... 191 Table B.8(a-g). Frequencies and standardized risk differences (95% CI)
Table B.9(a-g). Frequencies and standardized risk differences (95% CI) for the association between illness and human-associated
chemical markers among swimmers who swallowed water in all
beaches ... 205 Table B.10(a-g). Frequencies and standardized risk differences (95% CI)
for the association between illness and human-associated chemical markers (detected in ≥1 daily sample vs. none) among
LIST OF FIGURES
Figure 4.1. NEEAR beach sites included in this study ... 42
Figure 4.2. Directed acyclic graph - GI illness, diarrhea ... 43
Figure 4.3. Directed acyclic graph - respiratory illness, eye ailment, rash ... 44
Figure 4.4. Directed acyclic graph - earache, UTI ... 45
Figure 5.1. Freshwater and marine beach sites ... 69
Figure 5.2. Proportion of Bacteroides samples detected by beach ... 73
Figure 5.3. Standardized risk differences (95% CI) for the association between illness and human-associated Bacteroides markers among body immersion swimmers in all beaches, fresh water and marine beaches ... 74
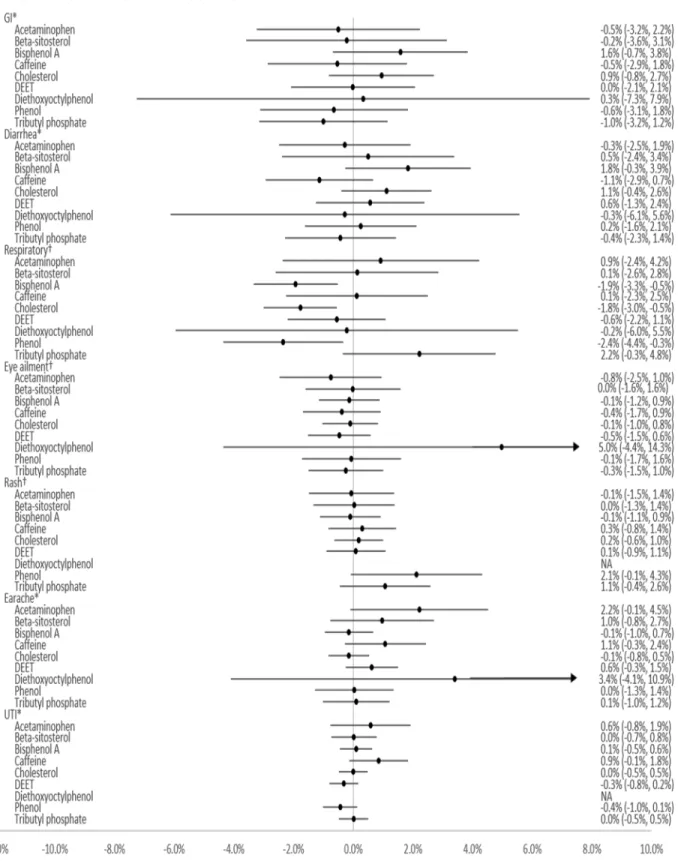
Figure 6.1. Freshwater and marine beach sites ... 103
Figure 6.2. Standardized risk differences (95% CI) for the association between illness and human-associated chemical markers (detected in all daily samples vs. <all) among body immersion swimmers in all beaches... 108
LIST OF ABBREVIATIONS
95% CI 95% confidence interval
B. dorei Bacteroides dorei
B. stericoris Bacteroides stericoris
B. uniformis Bacteroides uniformis
BEACH Beaches Environmental Assessment and Coastal Health Act
C. perfringens Clostridium perfringens
CCE calibrator cell equivalents CFU colony forming units
CT cycle threshold value
DAG directed acyclic graph DNQ detected, not quantifiable
E. Enterococcus
E. coli Escherichia coli
EPA U.S. Environmental Protection Agency FIB fecal indicator bacteria
FIO fecal indicator organism
FST fecal source tracking
GI gastrointestinal illness
IC interaction contrast
LOD limit of detection LOQ limit of quantification
NEEAR National Epidemiological and Environmental Assessment of Recreational Water
P P-value
qPCR Quantitative polymerase chain reaction
RD Risk difference
SD Standard deviation
Spp. Species
TSC Target sequence concentration URI Upper respiratory illness
UTI Urinary tract infection
UV Ultraviolet
CHAPTER 1. INTRODUCTION
Monitoring recreational water quality using fecal indicator organisms (FIOs) has become standard practice in the US and other countries seeking to reduce the burden of swimming-related illnesses. An estimated 170 million respiratory and enteric illnesses worldwide are attributed to swimming in and consuming shellfish from polluted marine coastal waters each year (1). Exposure to water contaminated by human fecal sources is believed to pose a greater risk to human health than that from non-human sources (2,3) because they most likely contain human enteric pathogens. In particular, viruses are believed to cause a high proportion of
swimming-associated gastrointestinal (GI) infections (e.g. hepatitis A, Norwalk virus, norovirus) (4-7) and enteric viral pathogens usually do not readily transmit infection to a host of a different species (2,3). However, enumerating conventional indicator bacteria – fecal and total coliforms,
Escherichia coli (E. coli), enterococci – cannot be used to discriminate between human and animal sources because of their widespread distribution in the feces of animals and humans. Previous epidemiologic research investigating the human health effects of water pollution often relied on proximity to sewage effluent from wastewater treatment plants as a proxy for human presence. Recently, source tracking methods that include microbial indicators capable of
CHAPTER 2.BACKGROUND AND SIGNIFICANCE
Use of fecal indicator organisms to track pathogens
Fecal contamination of water has always been a major human public health concern. Disease-causing pathogens can be present in sewage and transmitted via the fecal oral route (Table 2.1). For over 100 years, the quality and safety of recreational waters has depended on the enumeration of non-pathogenic microorganisms that normally inhabit the human and animal gastrointestinal tract and are shed in feces. As such, these FIOs signal the presence of fecal contamination, and are a convenient substitute for the costly and difficult task of directly
Ideally, a FIO shares biological characteristics with the pathogens of interest so that measuring the FIO might give an “indication” of whether fecal contamination might be present. In addition to being non-pathogenic residents of the GI tract of warm-blooded animals, there is a general consensus that an indicator with the following characteristics would be most useful (2,10,11):
• Being present when pathogens are present and absent in uncontaminated samples • Being present at densities correlated to the amount of pathogenic microorganisms • Being present at densities correlated to a health hazard
• Being unable to grow in extra-intestinal environments
• Surviving as long or longer than the pathogen for which it is an indicator • Being more resistant to environmental stress and disinfection than the pathogen
for which it is an indicator
• Occurring in greater numbers than the pathogen to permit ease of detection • Being rapidly detected and easily enumerated
• Being present in all types of water
No single indicator meets all the above characteristics, neither can any one indicator successfully identify or predict the presence or source of all classes of potential pathogens (3).
Conventional fecal indicators
enterococci were good predictors of GI illness, the 1986 criteria recommended using culturable
E. coli in freshwaterand culturable enterococci in marine and freshwater instead of fecal
coliforms (13). In fresh waters, the geometric mean of ≥ five samples taken over a 30-day period should not exceed 33 CFU of Enterococcus per 100 ml or 126 CFU of E. coli per 100 ml. In marine waters, the threshold was 35 CFU of Enterococcus per 100 ml. Most recently, in 2012, the EPA revised the criteria; while E. coli and enterococci remained as the recommended indicators, they revised the threshold values to reflect different illness rates and research with non-GI illnesses (Table 2.2). Also, for the first time, the EPA provided thresholds for
Enterococcus by qPCR (Table 2.3).
Since the EPA recommendations are intended as guidance, some states and jurisdictions choose to use coliforms or Clostridium perfringens to monitor their waters instead of, or in addition to E. coli and enterococci. To provide the foundation for further discussion of indicators that can distinguish source, a brief review of these conventional FIOs, their uses, and their limitations, follows.
Total and fecal coliforms
Coliform is the term for a group of bacteria that are gram-negative, catalase positive, non-spore-forming, aerobic and facultative anerobic rod-shaped that inhabit the GI tract of all
vertebrates. Total coliforms (TC) are bacteria that ferment lactose to gas within 48 hours when incubated at 35°C. At this temperature, some members can be routinely found in the
Enterobacter and Citrobacter (15), E. coli has been a strong indicator of fecal contamination because it is present in high numbers in feces and does not grow in the environment. Fecal source tracking studies have sought to use differences in the ratio of total coliforms to fecal coliforms as an indicator of host source, however, studies have concluded that the ratio is not able to distinguish between human and animal source (16).
E. coli
E. coli along with enterococci discussed below, are two microorganisms that have consistently performed well as indicators. E. coli is a common gram-negative facultative anaerobe found in numbers up to 109 per gram of mammalian feces (14). It can act as both an indicator and a pathogen. Non-pathogenic E. coli is termed commensal, and considered to be a beneficial, normal inhabitant of the gastrointestinal (GI) tract of warm-blooded mammals, although they can cause disease in immune-compromised hosts. Pathogenic E. coli cause disease either inside (diarrheagenic) or outside (extra-intestinal) the GI tract. E. coli has been widely used as an indicator of fecal contamination because of its property as a stable member of the intestinal community and abundance in feces. However studies have shown that E. coli is affected by environmental factors including temperature, UV radiation, and can survive in water 4 to 12 weeks, undermining its usefulness as an indicator of recent contamination (14).
Enterococci
are found in soil, water, dairy products, food and plants, as well as feces. In humans, 90-95% of enterococcus is E. faecalis (which can act as a pathogen causing urinary tract infection, or an indicator) and 5-10% is E. faecium (which acts as an indicator). Enterococci are useful indicators because they are present in human and animal feces, have survival rates similar to waterborne pathogens, and are usually unable to multiply in the environment. Enterococcus surface protein may be a specific marker of human fecal contamination (18). Enterococcus is also the indicator recommended for marine recreational water quality monitoring by the WHO (19).
Clostridium perfringens
C. perfringens is a gram-positive, obligate anerobic, rod-shaped bacterium ubiquitous in soil, but also commonly associated with feces. It is prevalent in human feces (14) at
concentrations of 105 to 107 CFU/g of feces (18,20), although concentrations vary between individuals. Some studies suggest C. perfringens is more prevalent in the feces of domesticated animals such as cats, dogs, pigs and poultry, than in cattle, sheep, and horses (18,21). Under the appropriate conditions, C. perfringens can cause a variety of diseases, including gangrene and food poisoning (22). C. perfringens may be a useful indicator of both past and present pollution because of its ability to occur in both vegetative and spore forms. Since it does not appear to grow in aquatic/soil environments, it is a useful fecal indicator for tropical environments where the regrowth of E. coli and enterococci in sand, sediment and water make them less useful (23).
Limitations of conventional indicators
Coliforms, enterococci, and E. coli, enumerated by culture-base methods, have
support the identification of alternative indicators. A designated concentration of FIO is
presumed to indicate fecal contamination, but studies in recent decades indicate these organisms may have an ability to persist and regrow in contaminated soils, sediments, marine waters (24), and other extra-intestinal environments (8,9,25-29), including areas removed from human activity (27). In addition, conventional FIOs have been criticized for being poor representatives of the fate, transport, and survival of human pathogens, particularly viruses and protozoa (8,27,28,30-32). They can be more susceptible to the disinfection process and inactivation by environmental stressors, like sunlight (33). Finally, none of the conventional FIO can be used to discriminate the source of fecal pollution in the water as human or non-human because these bacteria are found in various warm-blooded animals (8,9). Furthermore, standard culture-based methods of measuring FIO also do not distinguish between human and animal sources of pollution and limit their usefulness for water quality monitoring. Culture-based detection methods require growing FIO from filtered water samples to estimate their concentrations, a process that can take up to 24 hours for viable cells to be grown. Beach closings and advisories are then issued based on the previous day’s indicator levels, which may differ widely from the present day’s risk of fecal contamination due to weather, human events, or other factors. Understanding the dominant source of microbial contamination can inform the remediation of impaired water systems that support recreation.
Alternative indicators: Source tracking markers
chemical source tracking markers, and rapid molecular-based measurement methods have been proposed that can discriminate the presence and source of fecal pollution and quantify the differential risk from various contamination sources.
Bacteroides spp. as human-associated source tracking markers
First proposed as fecal indicator bacteria in 1985 (34), members of the genus Bacteroides are one of the most promising library-independent FST markers currently available. Bacteroides
spp. are gram-negative, obligate anaerobic bacilli that are commonly found in the GI tract of
warm-blood animals. They are one of the most abundant bacteria in the intestinal tract of
humans, found in up to 1011 CFU/g of feces (35), a concentration 1,000 fold greater than E. coli. Bacteroides spp.can account for up to 30% of the total fecal isolates (14). Since the 1990s,
members of the genus Bacteroides have been suggested as FST markers because of their ability
to indicate recent contamination and host specificity. Host-specific strains of Bacteroides
(representing between 1 and 10% of the total Bacteroides fecal population (36)), particularly
certain 16S rRNA genes, have been identified that may be strictly associated with human vs.
animal feces (37). Although difficult to culture, quantitative polymerase chain reaction (qPCR)
assays that measure gene copies of host-specific genetic markers of 16S rRNA are promising
methods for source tracking of fecal contamination (37). It is unknown whether Bacteroides spp.
performs as well as a FST marker in temperate vs. tropical zones of the world.
viruses during wastewater treatment); (4) molecular methods for detection of highly human-associated Bacteroides spp. has already been developed and has proven robust (37); and (5) specificity in the human vs. animal strains. Limitations of Bacteroides spp. as FST markers include limitations of the molecular assays used, which cannot distinguish between viable and nonviable cells; thus recent and past contamination events cannot be distinguished since DNA of selected pathogens can persist after cell death for up to three weeks (38).
Chemical compounds as human-associated source tracking markers
Certain chemical markers are also attractive as human source tracking markers because they typically require less time required for sample preparation and analysis than culture methods, they cannot regrow in the environment, and some may be more geographically or temporally stable (11). In comparison to many microbiological methods, chemicals have the advantage of low detection limits and relatively easy analysis. A wide range of chemical
compounds has been investigated as potential tools for the identification of human fecal sources (2,11,39). These compounds fall into several classes:
• those that are produced and excreted by humans (e.g. Coprostanol);
• those that are ingested almost exclusively by humans (e.g. caffeine, nicotine, and certain pharmaceuticals like carbamazepine and diphenhydramine); and
• those that make it into the human waste stream (e.g. surfactants, fluorescent whitening agents).
origin. Compounds in the third class above may still indicate co-mingling with human sewage, but the compound may have originated from industrial sources or from the disposal of
pharmaceuticals down the drain without passing through the human digestive tract or from surface runoff. Chemical compounds that appear to have the greatest potential include: (1) pharmaceuticals; (2) plant/animal fecal sterols; (3) household waste products, including personal care products, flame retardants and detergents; (4) industrial wastewater compounds; and (5) pesticides.
Pharmaceutical chemicals have been successfully detected in freshwater, seawater, estuaries, sediments, and wastewater effluents (11,40) and they have been examined as indicators of human wastewater pollution because of high water solubility and low levels in the background environment (41,42). Specific pharmaceuticals carbamazepine, codeine, dehydronifedipine, diltiazem, and fluoxetine have been found to indicate a uniquely fecal source because these pharmaceuticals are consumed and have no external uses and have been detected in 73 to 91% of wastewater treatment plant (WWTP) effluents at concentrations significantly greater than
upstream locations (40).
The term “sterols”is a collective name for all sterols and stanols, and denotes a steroidal alcohol with some degree of unsaturation. Fecal sterols are commonly produced in the digestive tract of humans and other warm-blooded animals by microbial hydrogenation of cholesterol (42). The most commonly known fecal sterol, coprostanol (5β-cholestan-3β-ol), comprises 50-80% of
concentrations and ratios of various stereoisomers are needed. For example, a high relative amount of coprostanol-to-24-ethylcoprostanol is one useful ratio for identification of human contamination; a ratio of ≥1.5 indicates 100% human contamination (43).
Household and industrial waste products can contain endocrine-disrupting chemicals. Household wastescan include various personal care products such as d-limonene (fragrance in aerosols), acetophenone (fragrance in detergent, flavor in beverages), 1,4-dicholorobenzene (moth repellant, deoderant), triclosan (disinfectant), and DEET (N,N-diethyl-meta-toluamide, mosquito repellent). Industrial wastewater compounds encompass a broad range of chemicals that can be toxic to humans.
Optical brighteners, or fluorescent whitening agents, are compounds that emit light in the blue range (415-445 nanometers) and are added to 97% of laundry detergents in the US, used in toilet paper, and present in other home products (44). They are associated with human sewage in septic systems because household plumbing systems mix effluent from toilets and washing machines together. Optical brighteners are present in effluent regardless of how effective the treatment has been at inactivating pathogens, and so must be accompanied by counts of fecal indicator bacteria to be a useful indicator of human contamination. Advantages of the use of optical brighteners include rapid, simple, and low cost detection methods using fluorometry (11,45), and the abundance of optical brighteners in sewage. The limitations are dilution of the optical brighteners in large water bodies and potential interference from unknown compounds.
There is interest in caffeine as a potential human marker because of its high consumption levels in the US (210 mg/day) and high concentration in surface water. Both metabolized and un-metabolized caffeine in the form of coffee, tea, and caffeinated beverages may represent
wastewater effluent (47) and has been successfully isolated in freshwater, marine waters, and storm waters (11).
Lastly, certain pesticides may be useful as a human source marker because of their use in the controlling pests in a variety of settings, and release into the environment during production and formulation of pesticides. In a recent study of 110 chemicals, one insecticide, diazinon, was among the 35 chemical compounds found in >50% of the WWTP effluent samplesassociated with wastewater (40).
A tiered, “toolbox” approach to source tracking
A recurrent theme in the fecal source tracking literature is to use source-specific indicators like Bacteroides spp. and chemical markers as part of a tiered, “toolbox” approach incorporating multiple indicators or markers and analytical methods (e.g. qPCR, fluorometry, and antibody detection) to assess water quality and determine human and other fecal
contamination sources (31,48-53). This can be done in many ways, but in one such approach, water quality assessment would begin by measuring conventional FIOs appropriate for a particular recreational water site, and then progress to more refined methods (e.g. molecular methods) and indicators that detect human, animal or environmental sources of fecal
tool for detecting human fecal contamination that yields rapid results (11). By using multiple tools, investigators can utilize the strengths of each to ascertain and remediate poor water quality.
Illness risks associated with human fecal indicators
Numerous epidemiological studies have demonstrated an increased risk of GI, diarrhea, respiratory, skin, eye, and ear illnesses among swimmers exposed to elevated FIO levels in sewage-impacted waters (54-60). Findings from studies where non-point sources of pollution is the predominant contaminant have been more inconsistent, with some studies reporting an association between indicator and illness (59,61-63), while others do not (62,64,65). But even a non-point source-impacted water body may have a human source of fecal contamination nearby (59). Our study assessed the source of fecal contamination from human source indicators in the water, instead of relying on proximity to sewage as a proxy. In addition, this analysis provides additional evidence regarding indicator organism-illness relationships for skin, eye, and ear infections, which tend to be less commonly reported than GI and respiratory illness.
enterococcus) or alternative indicators (Bacteroides and somatic phage) (66). They did however find an increased risk of GI, nausea, cough and fever with male-specific coliphage, but few people were exposed.
Arnold et al. (67) and Colford et al. (65) used the qPCR assay Scorpion-2 for
Enterococcus, which includes a primer-probe complex that amplified two common Enterococcus
species found in human fecal contamination: E.faecium and E.faecalis (68). However, there is some doubt that this primer-probe design is exclusive to humans (69). In studies that examined marine beaches impacted by urban runoff, Arnold found that Enterococcus density was not consistently associated with swimmer illness (67), whereas Colford reported an association between log10 increase in Enterococcus density among swimmers who swallowed water on berm-open days and diarrhea (adjusted odds ratio (OR)=2.30 (1.46, 3.61)) and GI ((OR=1.70 (1.10, 2.63)) (65). (An open berm freely allowed an untreated creek to flow into the surf). However, Bacteroides speciesmakes up a larger portion of the human intestinal bacteria (70) and is more abundant in feces than Enterococcus (71). As a result, human-associated Bacteroides
spp. markers may be more sensitive markers of swimming-associated illness risks. Very few studies have been conducted to evaluate Bacteroides spp. as predictive indicators of human illness risks from recreational use of water and in sites known to be impacted by human sources (e.g. sewage).
Sinigalliano et al. enumerated a suite of fecal indicators including 2 human Bacteroides
between any of the indicator organisms and self-reported GI, diarrheal, respiratory, or skin illness 7 days after beach exposure. The strength of this report is in its randomized design, which may have avoided self-selection bias that non-swimmers are inherently different or less healthy than swimmers, and individual exposure samples. However, the limited size of the cohort prevented investigation of associations between specific alternative markers and specific diseases.
As stated earlier, a wide range of chemical compounds has been investigated as potential tools for the identification of human fecal sources. These studies demonstrate the feasibility of using chemical compounds to assess the human origin of pollution (9,40,73,74), or the
relationship between chemicals and microbial FIO (11,75,76). However, the literature examining the relationship between the presence or concentration of chemicals and illnesses caused by human fecal pollution is even more limited than for microbial FIOs. To our knowledge, this research is the first study to examine the association between chemical indicators of human fecal contamination and illness risks due to contaminated recreational water.
Summary
this gap in the literature using a prospective cohort. The human fecal indicators and associated detection assays considered for this research include some, but not all those that are proposed by the literature as showing promise for being host-specific (40). Bacteroides spp. is the most abundant inhabitant of the human gut and assays to detect host-specific species have been validated in different water types. The Bacteroides spp. microbial indicators considered –
HF183, BsteriF1, BuniF2, and HumM2 – all use qPCR enumeration methods that produce results within 2-4 hours, allowing beach staff to make decisions about beach advisories and closures based on same-day sample collection. Chemical markers of human fecal contamination are under-studied. The 50 chemicals included in this study include those that are produced and excreted by humans, those ingested almost exclusively by humans (e.g. caffeine, nicotine, and certain pharmaceuticals like carbamazepine and diphenhydramine), and those that make it into the human waste stream (e.g. surfactants, fluorescent whitening agents).
Tables and Figures
Table 2.1. Select human pathogens associated with recreational water settings
Pathogen Disease/ role Symptoms Incubation
Period
Source
Bacteria
Pathogenic E. coli
(ETEC, EPEC, EAEC, EIEC, STEC)
Gastroenteritis (all), urinary tract infection (EIEC)
Diarrhea, bloody diarrhea
2-6 days Animal/ Human feces
Campylobacter spp. Acute
enterocolitis, Guillain-Barré, infectious diarrhea Diarrhea (occasionally bloody), cramping, abdominal pain, fever
2-5 days Human feces, cow/bird feces
Salmonella spp. Gastroenteritis,
Typhoid fever
High fever, diarrhea, abdominal cramps
7-28 days Human feces/ sewage
Shigella spp. Shigellosis,
bacillary dysentery
Fever, stomach cramps, bloody diarrhea
1-7 days Human feces/ sewage
Vibrio spp. Gastroenteritis,
Cholera, Vibriosis, Necrotizing wound infections
Vomiting, diarrhea, abdominal pain, skin infections, fever, chills,
1- 6 days Marine and estuarine environments
Enteric Viruses
Norovirus Gastroenteritis Diarrhea, nausea, vomiting, abdominal pain and cramps
24-48 hours Human feces/ sewage
Non-polio enterovirus Gastroenteritis, heart anomalies, meningitis
Mild flu-like symptoms, skin rash, Paralytic disease, respiratory illness
3-14 days Human feces
Adenovirus Gastroenteritis, conjunctivitis, pharyngitis, pneumonia, appendicitis
Diarrhea, fever, vomiting, cough, sore throat, headache, eye infection
~10 days Human feces, aquatic environments
Viral hepatitis – A and E Infectious hepatitis
Jaundice, fever, anorexia, malaise
15-50 days Human feces/ sewage
Rotavirus Acute
gastroenteritis
Gastroenteritis with nausea, vomiting
2-3 days Human feces
Protozoa
Entamoeba histolytica Amoebiasis Abdominal pain,
bloody diarrhea
2-4 weeks Human feces
Cryptosporidium spp. Cryptosporidiosis Watery diarrhea,
stomach cramps, nausea, vomiting, mild fever
1-2 weeks Human feces, animal feces
Giardia lamblia Giardiasis Acute diarrhea,
dehydration, flatulence, abdominal cramps and nausea
5-25 days Human feces, animal feces
Table 2.2. 2012 EPA recreational water quality criteria for culture-based methods
a EPA recommends using EPA Method 1600 (93) (or another equivalent method) to measure culturable enterococci
and using EPA Method 1603 (94) (or another equivalent method) to measure culturable E. coli. Source: EPA 2012 (95)
Table 2.3. 2012 EPA recreational water quality criteria for qPCR-based methods
CHAPTER 3.SPECIFIC AIMS
Research Question 1: Are human-associated Bacteroides indicators associated with an increased risk of illness among swimmers in contact with water?
• Specific Aim 1: Estimate the association between the presence/absence of human-associated
Bacteroides indicators of fecal contamination and the 10-12 day risk of seven self-reported symptoms and illnesses (gastrointestinal, diarrhea, respiratory, rash, eye ailment, earache, urinary tract infection) among swimmers. Objectives of this aim are to:
a. Stratify by type of water (i.e. marine vs. fresh).
b. Examine effect measure modification by level of swimming exposure (head immersion, body immersion, swallowing water) on the additive scale.
c. Examine effect measure modification by general indicator total Enterococcus
measured by qPCR.
Research Question 2: Are human-associated chemical markers associated with an increased risk of illness among swimmers in contact with water?
a. Stratify by type of water (i.e. marine vs. fresh).
b. Examine effect measure modification by level of swimming exposure (head immersion, body immersion, swallowing water) on the additive scale.
c. Examine effect measure modification by general indicator total Enterococcus
measured by qPCR.
These aims were met through secondary analyses of the National Environmental and Epidemiologic Assessment of Recreational Water (NEEAR) study, an observational cohort of approximately 54,000 visitors to four United States (US) freshwater and five marine beaches during 2003-2009. For both Aims, the self-reported symptoms and illnesses included
CHAPTER 4.RESEARCH DESIGN AND METHODS
Overview
We addressed the two aims using data from the National Epidemiological and
Environmental Assessment of Recreational (NEEAR) Water study, a prospective cohort study of 50,000+ visitors to four US freshwater and five marine beaches during 2003-2009. The aims estimated the association between exposure to human-associated Bacteroides (Aim 1) and chemical (Aim 2) fecal indicators in recreational waters and 10-12 day risk of self-reported illnesses. In our examination of these aims, we assessed type of water, level of swimming exposure, and additive interaction by the general fecal indicator, Enterococcus. Since the investigation of these aims involved secondary de-identified data analysis of NEEAR
participants, the UNC Public Health-Nursing institutional review board granted an exemption because it did not constitute human subjects research (13-2274).
Parent Study: National Epidemiological and Environmental Assessment of Recreational
(NEEAR) Water Study
1. Study design and population
examine associations between swimming exposure, water quality and swimming-associated illnesses. The study also collected and analyzed numerous chemical and microbial fecal indicators of water quality. Study design, population, and data collection details have been previously published (56,57,96) but is summarized in detail below.
2. Beach descriptions
The NEEAR study focused on beaches impacted by nearby sewage effluents because such pollution is believed to contain potential human fecal contamination and cause the highest human illness risks (97). Although it was conducted at nine beaches, this secondary analysis focuses on the seven beaches studied between 2003 and 2007. In 2003 and 2004, NEEAR studies were conducted at four freshwater beaches: Huntington Beach on Lake Erie near Cleveland, Ohio; West Beach on Lake Michigan at Indiana Dunes National Seashore in Portage, Indiana; Silver Beach on Lake Michigan near St. Joseph, Michigan; and Washington Park Beach on Lake Michigan in Michigan City, Indiana. In 2005 and 2007, NEEAR studies were conducted at three temperate marine beaches: Edgewater Beach near Biloxi, Mississippi; Fairhope Municipal Beach in Fairhope, Alabama; and Goddard Beach near Warwick, Rhode Island.
Beaches that were impacted by sources of human fecal contamination were specifically selected. All of the beaches were located within 7 miles of WWTPs or sewage effluent
state water quality guidelines. Beach site locations and descriptions are shown in Figure 4.1 and Table 4.1.
3. Data collection: Health surveys
Trained interviewers approached all beach visitors as they arrived between 11:00 AM and 5:00 PM, and were enrolled if they provided verbal informed consent. Each participant
completed three surveys, with an adult (≥18 years old) answering questions for other household members. At baseline, each participant completed an enrollment questionnaire about illnesses in the three days prior to their beach visit. Upon departure, participants completed a beach
questionnaire about beach activities, water exposure (extent, time, duration and location), presence of underlying acute and chronic health conditions (including allergies), food and drink consumption, animal contact in the past 48 h, contact with sick persons in the past 48 h, other swimming in the past week, and demographics. A low-cost incentive was offered after
the previous 28 days, were unaccompanied minors (<18 years), or did not speak English or Spanish.
4. Data collection: Outcome assessments
In a telephone interview 10-12 days following beach exposure, interviewers asked beachgoers to self-report if they had experienced any gastrointestinal illness, diarrhea, upper respiratory illness, eye ailments, earache, skin rash or urinary tract infection since their beach interview. The time period accounts for pathogens with longer incubation times, such as
Cryptosporidium spp., a common waterborne pathogen. These heath outcomes are consistent with previous reports investigating the association between fecal indicator organisms and illness, to facilitate comparison (56,57,62,65,98,99). Responses to questions about symptoms or illness could take the form of Yes, No, Refused, or Don't know.
“Gastrointestinal illness” (GI illness) refers to any of the following: diarrhea (≥3 loose stools in a 24-hour period); vomiting; nausea and stomachache; or nausea or stomachache and interference with regular activities (missed time from work/regular activities due to illness).
‘‘Respiratory illness’’ refers to any two of the following: sore throat, cough, runny nose, cold, or fever.
‘‘Rash’’ refers to a rash or itchy skin.
‘‘Eye ailments’’ refers to eye infection or watery eye.
‘‘Earache’’ refers to earache, ear infection, or runny ears.
Diarrhea was also be considered as a stand-alone outcome because it is frequently used as a definition of gastroenteritis in population-based surveillance e.g.(100,101).
Participants ill within the three days prior to their beach visit were excluded from analysis of the health outcome related to their baseline symptoms, but were eligible to be included in analyses of other outcomes.
Aim 1: Human-associated Bacteroides indicators and risk of illness
1. Study population
Participants eligible to be included in this Aim were those who visited beaches in which human-associated Bacteroides indicators were collected: Fairhope, Goddard, Huntington, Silver, Washington Park, and West Beaches (n=25,288).
2. Definition of swimming
“non-swimmers”) and those who reported having water contact, but not “body immersion” were excluded from analysis because they comprise a group with heterogeneous water exposure.
3. Exposure assessment
Water sample collection and analysis
Water samples were collected three times a day (8:00 AM, 11:00 AM, and 3:00 PM) along three transects perpendicular to the shoreline (57,102). At each transect, one-liter of water was collected in waist-high water (1m deep) and one-liter was collected in shin-high water (0.3m deep). Transects were at least 60m apart to encompass the entire swimming area. After
collection, samples were maintained on ice at 1-4°C in coolers for up to 6h before polycarbonate membrane filtration. Filters were kept at -20°C and shipped on dry ice to EPA, Cincinnati for qPCR analysis. Filters were stored at -40 °C for up to six years before analysis. DNA was extracted from the filters by a simple bead milling procedure and aliquots corresponding to two-thirds of the total crude extracts were concentrated 2-fold and purified using a commercially available 96-well silica column based system (DNeasy, Qiagen, Valencia, CA) with binding and elution buffers from another system (DNA-EZ, Gene-Rite, North Brunswick, NJ) essentially as previously described (103).
Purified DNA extracts were analyzed for total Enterococcus (102) using a previously described and validated qPCR calibrator cell equivalent (CCE) method (55) and Bacteroidales
TaqMan (hereafter HF183), BsteriF1, and BuniF2 (104). Of those, the HF183 assay has shown promise because of its abundance in human feces and sewage (i.e. high sensitivity, detection in samples that are actually of human origin), low cross-reactivity in chicken and dog feces, and absence in many other animals including cattle, pig, gull, and cat feces (104-107). The BsteriF1 and BuniF2 assays have shown high sensitivity, but lower specificity due to cross-reactivity with animal feces (104,105). The HumM2 assay targets a hypothetical protein potentially involved in remodeling surface lipopolysaccharides and polysaccharides (71). It has been found to be highly sensitive and specific to human feces and wastewater samples, but cross-reacted with sheep and elk feces at levels approaching those in human feces (71,105).
qPCR analyses were assessed by analyses of each extract with a multiplex version of the HF183 assay using an internal amplification control (IAC) template and by analyses with the Sketa22 assay for salmon testes DNA which was added to each sample as a sample processing control (SPC) prior to extraction (104). Criteria for classifying sample measurements as being
unacceptable were offset Ct values from corresponding control samples of >1.5 and >3.0 for the IAC and SPC assays, respectively, as previously described (57,104).
Exposure coding
Due to a large proportion of human-associated Bacteroides data that was below the detection limit (~50-90%), I considered categorical classifications. In order to be the most sensitive, I initially created a binary variable for each Bacteroides marker that took the value of ‘1’ if it was detected in 1 or more samples, and ‘0’ otherwise. This resulted in very few exposed swimmers with illness, and would have presented problems estimating associations. Therefore, I modified the categorization so that each marker took the value of ‘1’ if it was detected in at least two samples per day, and ‘0’ otherwise. Thus, the primary exposure of interest in Aim 1 was the presence/absence of human-associated Bacteroides fecal indicators measured in water samples as one of four assays (HF183, BsteriF1, BuniF2, and HumM2). Because non-swimmers are
4. Outcome assessment
As stated in the previous section, health outcomes were assessed in a telephone interview conducted 10-12 days following beach exposure: GI illness, diarrhea, respiratory illness, earache, eye ailment, rash, and UTI.
5. Covariate assessment
We used directed acyclic graphs (DAG) (109,110) (visualized using DAGity (111)) to analyze these potential environmental, demographic, and beach covariates for confounders that would need to be adjusted to achieve the least biased estimate of association (Figure 4.2 – 4.4). It is worth noting that because fecal indicators by nature are non-pathogenic and act as a proxy for disease-causing microbes, the primary path of interest on this DAG is non-causal: Indicator Human source Pathogen Outcome. Thus, the least biased estimates would be produced with an adjustment set that closed all other non-causal, back-door paths and included Pathogen as a variable in the set.
sand) (binary), rainfall (continuous), and water temperature (continuous). Results from a study day that occurred during a festival at Silver Beach were dropped from analysis because they were not representative of typical beach days.
6. Effect measure modifiers
A potential effect measure modifier (EMM) of the association between human-associated
Bacteroides and illness was identified a priori: type of water matrix (marine/saltwater vs. freshwater). Type of water matrix was investigated as an EMM due to the possibility that it influences the concentration of microbial fecal indicators in water, particularly for molecular markers used in this study. In addition, there is limited research on the persistence of genetic material of human-associated Bacteroides markersin various water matrices to inform a
decision. Nevertheless, modification of these marker-illness effect estimates by water matrix was of secondary interest, so was assessed by stratification.
A priori, we were also interested in whether the human-associated Bacteroidales markers, which proportedly indicate human source, act as modifiers of the association between
non-specific total Enterococcus assayed by qPCR Method 1611 (CCE/ml) and illness. For that modification analysis, Enterococcus was treated as the main exposure and the Bacteroides
with Enterococcus coded as a continuous variable (average log10 count of Enterococcus per day (CCE/100ml)). Risk difference modification was estimated with product interactions of
Enterococcus and Bacteroides markers and then assessed by an interaction contrast (i.e.,
difference of risk differences) (112). The interaction contrast takes on the value of zero when the joint effects of two factors are simply additive (112).
7. Data analysis
Univariate analyses were conducted to explore the distribution of demographic, covariate data, non-specific and human-associated Bacteroides indicators, and health outcomes to identify the completeness and consistency of the data. They were examined using frequencies and percents for categorical variables, and descriptive statistics for continuous variables. The
frequency of missing data was also evaluated for each variable. To reconcile inconsistencies, the environmental microbiologist responsible for data collection was consulted as needed.
We sought to use a binomial model to directly estimate risk differences (RD) and 95% confidence intervals (95% CI) for the relationship between human-associated Bacteroides
markers and risk of illness among swimmers. However, due to well-documented problems with non-convergence (113-116), we explored other recommended alternatives, including modified Poisson regression with an identity link (115,117), the COPY method (114,118) and inverse-probability of exposure weighting (119) but encountered non-convergence issues for some indicator-illness associations. We decided to use model-based standardization (116,120-122) to produce standardized marginal risks and RD with 95% CI estimated using the delta method (123) and the total group as the standard. Logistic regression was used to estimate predicted
weighted average separately for both levels of the binary exposure. Thus, the effect estimates are estimated using predicted probabilities standardized to the same confounder distribution. The predicted probabilities were subtracted to produce a marginal estimate of the risk difference comparing Bacteroides marker exposure to no exposure. Robust standard errors were used to account for dependence of observations within a household (124).
As previously mentioned, we excluded participants ill within the three days prior to their beach visit from analysis of the health outcome related to their baseline symptoms, but they were eligible to be included in analyses of other outcomes. All analyses were completed using SAS version 9.4 (SAS Institute, Inc., Cary, NC, ) and Stata version 13 (StataCorp, College Station, TX).
8. Sensitivity analyses
investigate quartiles because of limitations in the quantitation of the Bacteroides markers (See discussion of limitations in Chapter 5 “Discussion” section).
Aim 2: Human-associated chemical markers and risk of illness
1. Study population
Participants eligible to be included in this aim were those who visited beaches in which human-associated chemicalmarkers were collected: Edgewater, Huntington, Silver, Washington Park, and West Beaches (n=17,753).
2. Definition of swimming
The primary exposure for aim 2 was detection of human-associated chemicalmarkers from water exposure. Similar to aim 1, the main analysis for this aim considered those who reported “body immersion” as being exposed to water. Participants who reported no water contact (i.e. “non-swimmers”) and those who reported having water contact, but not “body immersion” were excluded from analysis because they comprise a group with heterogeneous water exposure. Other categories of water exposure (i.e. head immersion, swallowed water) were considered in sensitivity analyses.
3. Exposure assessment
Water sample collection and chemical analysis
and Huntington beaches, three one-liter water samples were collected in waist-high water (1m), for a total of 3 samples per day. At Silver, Washington Park, and Edgewater beaches, water samples were collected along two transects perpendicular to the shoreline and closest to the effluent. Two samples were collected at waist depth and two samples at shin depth (0.3m deep), for a total of 4 samples per day. After collection, samples were packed in coolers with ice during transport and at ≤4 °C alongside a travel blank (de-ionized water) until the following day, when they were packed on dry ice and shipped to USGS National Water Quality Laboratory in Lakewood, Colorado and the USGS Organic Geochemistry Research Laboratory in Lawrence, Kansas for extraction and analysis.
Because of the different physiochemical properties of the chemical compounds, three different analytical methods were used (40). For wastewater compounds and some
pharmaceutical compounds, a whole-water sample was extracted using continuous liquid-liquid extraction and then analyzed using gas chromatography/mass spectrometry (GC/ MS) (125). Most pharmaceutical compounds were extracted by first passing 500 – 1000 ml filtered water through solid-phase extraction cartridges, then eluent was concentrated, and the final extract was analyzed using liquid chromatography/mass spectrometry positive-ion electrospray (126). Antibiotic compounds were extracted and analyzed by solid-phase extraction using tandem cartridges, and analyzed by liquid chromatography/mass spectrometry positive-ion electrospray on a single quadrapole mass spectrometer (127). Concentration is reported in μg/L.
Chemical marker exposure coding
diethoxyoctylphenol, DEET, phenol and tributyl phosphate. I evaluated continuous (log10 transformed), categorical, and binary coding schemes for chemical concentrations. Continuous chemical concentrations were log10-transformed because they were right-skewed. To avoid implausible values once transformed, chemical concentrations that had a value of zero were imputed with ½ the minimum non-zero value for that chemical. A daily average chemical concentration was provided for each beach-day, computed as the average of the log10 concentrations of all samples collected that day.
Fecal indicator bacteria
Intestinal enterococci are validated, nonspecific indicators of fecal pollution used to measure water quality throughout the world. Total Enterococus spp. by qPCR (calibrator cell equivalents (CCE)/100 ml) was enumerated following water sample collection and subsequent membrane filtration according to previously published protocols (57,102,108).
4. Outcome assessment
The outcomes assessed for aim 2 were identical to aim 1: GI illness, diarrhea, respiratory illness, earache, eye ailment, rash, and UTI.
5. Covariate assessment
The same DAG used in aim 1 was used for aim 2 for the reason that both the Bacteroides
and chemical markers represent two types of indicators of human fecal contamination in water. Though the mechanisms may arguably differ, the research question was still to determine the association between potential human-associated fecal markers and health outcomes, so the same DAG and minimally sufficient sets were used.
6. Effect measure modifiers
the association between non-specific total Enterococcus assayed by qPCR Method 1611 (CCE/ml) and illness using an interaction contrast. Thus, the chemical categories were
dichotomized for the modification analyses as follows: a value of ‘1’ any chemicals belonging to that category were detected in all samples per day, and ‘0’ otherwise.
7. Data analysis
Univariate analyses were conducted to explore the distribution of demographic, covariate data, non-specific and human-associated chemical indicators, and health outcomes to identify the completeness and consistency of the data. They were examined using frequencies and percents for categorical variables, and descriptive statistics for continuous variables. The frequency of missing data was also evaluated for each variable. To reconcile inconsistencies, the
environmental microbiologist responsible for data collection was consulted as needed.
Because 56 chemicals encompassing ten broad categories were analyzed, we intended to use empirical Bayes modeling, a form of hierarchical regression in which all of the parameters for the Bayesian prior are generated from the data. Empirical Bayes methods offers
improvements over conventional statistical methods in analyses of multiple exposures (or
cholesterol, beta-sitosterol, bisphenol A, diethoxyoctylphenol, n-n-diethyl-meta-toluamide (DEET), phenol, and tributyl phosphate measured at all five beaches on self-reported illness among body immersion swimmers.
Similar to aim 1, we used model-based standardization (116,120-122) to produce
standardized marginal risks and RD with 95% CI estimated using the delta method (123) and the total group as the standard. Logistic regression was used to estimate predicted probabilities of the outcome for every value of observed confounders and then combined as a weighted average separately for both levels of the binary exposure. Thus, the effect estimates are estimated using predicted probabilities standardized to the same confounder distribution. The predicted
probabilities were subtracted to produce a marginal estimate of the risk difference comparing each chemicalmarker exposure to no exposure. Robust standard errors were used to account for dependence of observations within a household (124). As previously mentioned, we excluded participants ill within the three days prior to their beach visit from analysis of the health outcome related to their baseline symptoms, but they were eligible to be included in analyses of other outcomes. All analyses were completed using SAS version 9.4 (SAS Institute, Inc., Cary, NC) and Stata version 13 (StataCorp, College Station, TX).
8. Sensitivity analyses
Tables and Figures
Figure 4.1. NEEAR beach sites included in this study
Table 4.1. Description of NEEAR beach sites included in this study
Beach Year Location Water body type Source of fecal pollution
Freshwater
Huntington 2003 Lake Erie,
(near Cleveland, OH)
Temperate Treated WWTP
Silver 2004 Lake Michigan, (near St. Joseph, MI)
Temperate Treated WWTP
Washington Park 2004 Lake Michigan, (in Michigan City, IN)
Temperate Treated WWTP
West 2003 Lake Michigan,
(Indiana Dunes National Seashore, IN)
Temperate Treated WWTP
Marine
Edgewater 2005 Biloxi, MS Temperate Treated WWTP
Fairhope 2007 Fairhope, AL Temperate Treated WWTP
Goddard 2007 West Warwick, RI Temperate Treated WWTP
CHAPTER 5.EXPOSURE TO HUMAN-ASSOCIATED FECAL INDICATORS AND SELF-REPORTED ILLNESS AMONG SWIMMERS AT RECREATIONAL BEACHES
Overview
Although fecal indicator bacteria are used to indicate the presence of fecal pollution and assess associated illness risks in recreational waters, few studies have examined illness risks associated with human-source-associated fecal bacteria. Our objective was to estimate
associations between genetic markers of human-associated fecal bacteria and self-reported illness among swimmers at select U.S. beaches. Weused data from 12,060 swimmers enrolled in the National Epidemiological and Environmental Assessment of Recreational Water study in 2003-2007. Participants were surveyed about beach activities, water exposure, and baseline symptoms on the day of their beach visit, and 10-12 days later, they were surveyed about illness symptoms experienced since the beach visit. Up to 18 water samples per day were tested for highly human-associated Bacteroides genetic markers using four assays (HF183, BsteriF1, BuniF2, HumM2). Adjusted standardized risk differences (RD) and 95% confidence intervals (CI) for the
respiratory illness and exposure to the human-associated Bacteroides marker BsteriF1. Small, positive associations were observed between the Bacteroides markers and earache and UTI, while small inverse associations were observed for HumM2 and HF183 markers and rash. Human-associated Bacteroides markers did not act as modifiers of general Enterococcus and illness. Patterns of risk were largely similar when stratified by water matrix (freshwater vs. saltwater). Sensitivity analyses indicated that risk estimates could be improved when combining multiple Bacteroides markers, although a clear dose-response pattern still did not emerge. It is not clear that these findings are generalizable to sites impacted predominantly by animal sources, runoff, or sporadic and diffuse sources of contamination.
Introduction