Time-Domain Studies of Hot Subdwarf Stars
by
Brad Newton Barlow
A dissertation submitted to the faculty of the University of North Carolina at Chapel Hill in partial fulfillment of the requirements for the degree of Doctor of Philosophy
in the Department of Physics and Astronomy.
Chapel Hill 2011
Approved by:
Dr. J. Christopher Clemens
Dr. Bruce W. Carney
Dr. Charles R. Evans
Dr. Amy L. Oldenburg
c
ABSTRACT
BRAD N. BARLOW: Time-Domain Studies of Hot Subdwarf Stars (Under the Direction of Dr. J. Christopher Clemens)
Hot subdwarf B (sdB) stars represent one of the least-understood stages of stellar
evo-lution, yet they dominate surveys of faint blue objects and are found in almost all Galactic
stellar populations. Understanding these stars better would illuminate the enigmatic “second
parameter” problem in globular cluster evolution, improve synthesis modeling of the UV
upturn in giant elliptical galaxies, and constrain the physical properties of the dense plasmas
present in these compact objects. Presumably, hot subdwarfs were once red giant branch stars
stripped of their outer hydrogen layers, possibly due to interactions with binary companions.
Searching for sdB binaries, determining their orbital parameters, and measuring the masses
of their hot subdwarf components are some of the best ways to test binary formation models.
Since pulsations offer the chance to measure sdB properties through a combination of
spec-tral analysis and stellar seismology, we conducted a Southern-hemisphere survey with the
PROMPT telescopes to extend the number of pulsators available for such studies. CS 1246,
one of the pulsators discovered in our survey, shows a single, large-amplitude radial mode
permitting the application of techniques rarely applied to other stars. Using time-resolved
spectroscopy from the SOAR telescope, we employ the Baade-Wesselink method to derive
a mass, radius, and distance for the star; this represents the first application of the method
to a hot subdwarf. Pulse timing measurements from PROMPT over two years imply the
presence of a previously-unknown, low-mass companion orbiting CS 1246 with a period of
two weeks. We verify this hypothesis with radial velocity measurements of the orbital reflex
motion, confirming for the first time that the rapid pulsations of sdB stars can be sufficiently
accurate clocks for the detection of companions using the O-C diagram. Future
applica-tions of these techniques to other pulsating hot subdwarfs will help address the mysteries
Acknowledgements
The writing of this dissertation has been a team effort, although the other members of this
team may be unaware of their roles and how vitally important they were. I owe a great deal
of thanks to many people without whose support, both practical and moral, I would not have
completed my Ph.D. requirements.
Special recognition is due to my thesis advisor Chris Clemens, for whom it is impossible
to summarize the extent of my gratitude and respect. He provided many valuable insights into
our work and taught me to approach new discoveries with a cautious eye. Chris, thank you
for your unwavering support over the years and for providing me with so many opportunities
to succeed. I will truly miss the endless quotations from Galaxy Quest and Star Wars, the
“five mammal” platter at Martin Fierro, coffee runs to the Campus Y, and impersonations of
Josie Gautier (among many other characters).
I would also like to recognize Profs. Bruce Carney, Chuck Evans, Dan Reichart, Amy
Oldenburg, Rene Lopez, and Reyco Henning for serving on my masters defense, preliminary
oral exam, and dissertation defense committees and my undergraduate advisor, Dr. Patrick
Lestrade, for the guidance and research opportunities he provided me as a physics major at
Mississippi State University.
Bart Dunlap played a major role in almost every project presented in this thesis, and
without his help, this work would have taken a lot longer to complete, and it would have
been less fun to do so. Whether helping to reduce and analyze data, observing with SOAR
late nights on-site in Chile or remotely from UNC, or sharing the excitement of another new
discovery, Bart has been there every step of the way, and I hope we can find projects to
col-laborate on in the future. I thank the Abraham Goodman family for providing the financial
support necessary to build the Goodman Spectrograph, Sheila Kannappan for the computer
(“cielo”) on which many of our data reductions and analyses were carried out, Mark Norris
for IDL assistance, Ricky O’Steen for measuring eclipse timings, Rachel Rosen for teaching
me WQED & LaTeX, the SKYNET team for always entertaining my latest ’crazy’ idea for
PROMPT, Alan Harnisch for assistance observing with SKYNET remotely from Detroit
dur-ing the 2009 NCAA tournament, Tony Lynas-Gray for his valuable insights and access to hot
subdwarf model atmospheres, and Dave Kilkenny for helpful advice and unpublished zones
of the Edinburgh-Cape survey. I would also like to recognize the outstanding observational
support provided by the SOAR operators Daniel Maturana, Alberto Pasten, Sergio Pizarro,
and Patricio Ugarte. Without their help and patience, none of the SOAR observations
pre-sented in this thesis could have taken place. I will continue to embrace the nickname they
have given me: Brad “Morning Twilight Flats” Barlow. Additionally, I must thank Steve
Heathcote for providing us with Director’s Discretionary Time to obtain the data discussed
in Chapter 5.
Support during my time as a graduate student extended beyond the hallways and offices
of Phillips Hall and observatories in Chile. Music has played a non-negligible role
through-out my graduate student career. I must thank the composers of the innumerable film scores
Gi-acchino. I am grateful to the music majors of Hill Hall who graciously accepted my
overly-enthusiastic piano playing from time to time in their practice rooms. Lastly, several
busi-nesses around Chapel Hill, most notably Caribou Coffee and BSki’s, provided caffeine and
sustenance on many occasions while observing remotely with SOAR and completing this
dissertation.
On a more personal level, I am forever indebted to several people for their moral
sup-port and encouragement over the past five years. First, I am grateful to my parents, Richard
and Marguerite Barlow, and brother, Chris, for always encouraging and supporting my crazy
science experiments, movie directing, and late nights observing the skies from Latimer, MS,
when I was a child. I must also thank each member of the Clemens family for making me feel
like part of their family and providing hours of non-stop (and sometimes chaotic)
entertain-ment: Becca (conversations concerning social awkwardness, jamming sessions in Hill Hall,
getting me addicted to Bones and Master & Commander), Chris (jump-starting a boat with
a rope, teaching me how to off-road, sponsoring my confirmation), Georgie (always
look-ing out for me), Gus (“Slook-inglook-ing...in...the...rain”), Henry a.k.a Harry Potter (“We’re on...the
earth”), Jack (beating me at chess...twice), and Nick (destroying me in basketball). Finally, I
am blessed to have had many close friends who have been there for me these past few years,
especially John, Nathan, Bart, Brant, Samantha, and Briana. It has been a pleasure knowing
and working with you all; you certainly helped make graduate school an unforgettable and
enjoyable experience.
Table of Contents
List of Tables . . . xii
List of Figures . . . xiii
List of Abbreviations . . . xv
1 Introduction . . . 1
1.1 The Enigmatic Hot Subdwarf Stars . . . 2
1.2 Astrophysical Relevance . . . 7
1.3 An Abundance of Binaries . . . 9
1.4 Pulsating Hot Subdwarf Stars . . . 12
1.4.1 Observations . . . 13
1.4.2 Theory. . . 16
1.4.3 The Profit of Pulsations . . . 18
1.5 Plan of this Work . . . 20
2 A Survey for Pulsating sdB Stars with PROMPT . . . 22
2.1 Target Selection . . . 23
2.3 Noise and False Alarms in the Data . . . 26
2.4 Survey Results . . . 27
2.5 Consolation Prizes . . . 30
2.6 Notable Detections . . . 30
2.6.1 JL 166 . . . 31
2.6.2 EC 10246-2707 . . . 32
2.6.3 HE 0341-2449 . . . 33
2.6.4 CS 1246 . . . 34
3 Application of the Baade-Wesselink Method to a Hot Subdwarf . . . 36
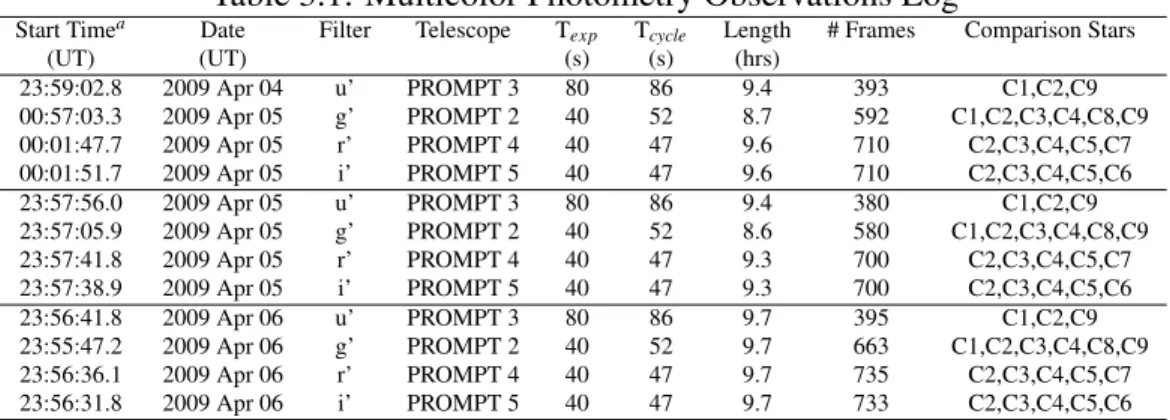
3.1 Simultaneous, Multi-color Photometry . . . 37
3.1.1 Observations and Reductions . . . 37
3.1.2 Frequency Analysis . . . 39
3.2 Time-resolved Spectroscopy . . . 43
3.2.1 Observations&Reductions . . . 43
3.2.2 The Average Spectrum and Atmospheric Fits. . . 45
3.2.3 Spectrophotometric Light Curve . . . 47
3.2.4 Radial Velocity Curve . . . 49
3.2.5 Effective Temperature and Gravity Variations . . . 52
3.2.6 Radial Pulsation Test and the Stellar Distance . . . 53
3.2.7 The Stellar Radius and Mass . . . 58
3.3 Conclusions . . . 59
4 The O-C Diagram of CS 1246 . . . 62
4.1 Method Overview . . . 63
4.2 Photometric Data . . . 64
4.2.1 Reduction&Analysis . . . 64
4.2.2 Night-by-Night Results . . . 65
4.3 The O-C Diagram . . . 68
4.4 The Combined Light Curve . . . 71
4.5 Binary System Parameters . . . 75
4.6 The Evolution of CS 1246 . . . 79
4.7 The Importance of Sampling Rate in O-C Data . . . 81
4.8 Discussion & Outlook . . . 81
5 The Pulse Timing Method for Hot Subdwarf Stars . . . 86
5.1 Motivation . . . 87
5.2 Observations . . . 88
5.3 The Radial Velocity Curve . . . 90
5.4 Agreement with Pulse Timing Results . . . 93
5.5 Conclusions . . . 95
6 Conclusions & Outlook . . . 97
6.1 A Search for Variables . . . 97
6.2 Mass from the Baade-Wesselink Method . . . 98
6.4 Future Directions . . . 100
A Survey Observations & Results . . . 103
B CS 1246 O-C Diagram Observations Log . . . 111
C Times of Light Maxima in CS 1246 and Their O-C values . . . 115
Bibliography . . . 118
List of Tables
1.1 Classes of Pulsating Hot Subdwarfs . . . 13
2.1 Summary of Survey Observations . . . 25
2.2 Survey Yield . . . 28
2.3 Non-sdB Variables Detected in Our Survey . . . 30
2.4 Notable sdB Survey Detections . . . 31
3.1 Multicolor Photometry Observations Log . . . 38
3.2 Least-squares Fits to the Light Curves . . . 42
4.1 CS 1246 System Parameters . . . 77
A.1 Online Subdwarf Database Survey Objects . . . 103
A.2 EC Zone 2 Survey Objects . . . 107
A.3 SDSS Survey Objects . . . 110
B.1 CS 1246 O-C Diagram Observations . . . 111
List of Figures
1.1 Common envelope and Roche lobe overflow formation scenarios . . . 5
1.2 Roche lobe overflow and single-star formation scenarios . . . 6
1.3 Log g-Te f f diagram for sdBV stars . . . 14
1.4 Example temporal spectra of sdBV stars . . . 15
2.1 Sky map of survey targets . . . 28
2.2 Quantitative summary of the survey results . . . 29
2.3 JL 166 light curve . . . 32
2.4 Multi-color light curves of EC 10246-2707 . . . 33
2.5 Radial velocity curve of EC 10246-2707 . . . 34
2.6 Discovery light curve for CS 1246 . . . 35
3.1 Field image of CS 1246 . . . 37
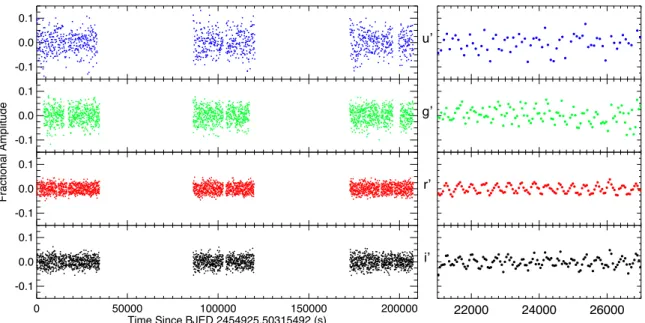
3.2 Multi-color photometry light curves of CS 1246 . . . 39
3.3 Multi-color photometry Fourier transforms . . . 40
3.4 Pulsation amplitude ratios . . . 43
3.5 Individual and mean spectra of CS 1246 . . . 44
3.6 Spectrophotometric light curve of CS 1246 . . . 48
3.7 Chromatic amplitudes for the pulsations of CS 1246 . . . 49
3.8 Raw velocity curves . . . 50
3.9 Velocity curve . . . 51
3.10 Summary of pulsational variations detected . . . 54
3.11 Delta alpha vs delta R . . . 57
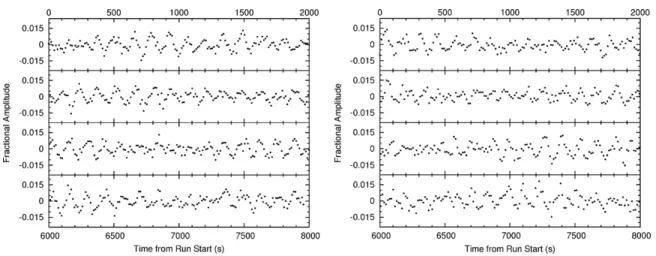
4.1 Sample light curve of CS 1246 from the O-C study . . . 66
4.2 Pulsation amplitude versus time . . . 67
4.3 O-C diagram for CS 1246 . . . 69
4.4 Fourier transform of the O-C diagram . . . 71
4.5 Fourier transform of the combined light curve . . . 73
4.6 Phase-folded O-C diagram . . . 76
4.7 Sampling effects in the O-C diagram . . . 82
4.8 Sensitivity of the O-C diagram to companions . . . 85
5.1 Sample spectra used to measure radial velocities of CS 1246 . . . 91
5.2 Radial velocity curve . . . 93
List of Abbreviations
EHB extended horizontal branch
FT Fourier transform
NOV not observed to vary
O-C observed minus calculated
RV radial velocity
sdB hot subdwarf B star
sdBV pulsating hot subdwarf B star
sdBVr rapidly-pulsating hot subdwarf B star
sdBVs slowly-pulsating hot subdwarf B star
sdBVrs rapidly- and slowly-pulsating hot subdwarf B star (hybrid)
sdO hot subdwarf O star
S/N signal-to-noise
Chapter 1
Introduction
“I soon became convinced...that all the theorizing would be empty brain exercise
and therefore a waste of time unless one first ascertained what the population of
the universe really consists of.”
–Fritz Zwicky
Serendipity is the catalyst of many great scientific discoveries. Armed with the 18-inch
Schmidt telescope on Mount Palomar, Fritz Zwicky and Milton Humason began a search for
faint blue stars at high Galactic latitudes in 1939 with the hopes of uncovering new white
dwarfs (Humason & Zwicky, 1947). A handful of stars were observed with spectra
domi-nated by Balmer absorption lines, similar to hydrogen-atmosphere white dwarfs (DAs) and
main sequence B stars. Spectral analyses showed the absorption features were too narrow for
mag-nitude for normal main sequence B stars, they calculated the distance moduli and found the
stars would be at distances placing them well outside of our Galaxy. Humason and Zwicky
concluded they were neither white dwarfs nor main sequence stars but a new type of blue
object altogether. These stars were later dubbed “hot subdwarfs” and continue to perplex
astronomers even today.
1.1
The Enigmatic Hot Subdwarf Stars
The hot subdwarf stars were first recognized as a blue extension of the horizontal branch
in the Galactic halo in the monumental work of Greenstein & Sargent (1974). By determining
temperatures and gravities through pioneering spectral analyses, they were able to place the
stars in the Hertzsprung-Russell (H-R) diagram in a location between the main sequence and
white-dwarf cooling tracks referred to as the extreme (or extended) horizontal branch (EHB).
The ‘hot subdwarf box’ in which the majority of these stars are found has boundaries defined
by 5.0<logg1<6.5 and 20000 K<Te f f <100000 K and contains several subclasses of hot
subdwarfs:
sdB - a star which has colors similar to those of a B-type star and a spectrum dominated by
hydrogen Balmer lines broader than those of main sequence B stars. Weak He I lines
are sometimes present. Temperatures range fromTe f f = 20000−40000Kand surface
gravities from logg=5.0 - 6.2.
sdOB - an extremely hot sdB star showing the He II 4686 Å line in its spectrum in addition 1reported in cgs units throughout this thesis.
to He I and hydrogen Balmer lines. The sdOB classification is rarely used anymore; its
members are typically assumed under the ‘sdB’ classificiation.
sdO - a star with colors similar to those of normal O-type stars with spectra dominated by
ionized helium. Temperatures range from 40000 K to 100000 K and surface gravities
from logg=4.0 - 6.5.
He-sdB - an sdB star highly enriched with helium.
He-sdO - an sdO star highly enriched with helium.
Subdwarf B stars are by far the most frequent subtype, outnumbering sdOs by a factor of
three. Furthermore, they form a spectroscopically homogeneous class, whereas O-type
sub-dwarfs display a wide variety of spectra (Moehler et al., 1990). For these reasons, we have
focused our work on the sdB stars, which we refer to as ‘hot subdwarfs’, ‘sdB stars’,
‘subd-warf B stars’, and ‘subluminous B stars’ interchangeably for the remainder of this thesis.
Models show sdBs are core helium-burning stars surrounded by thin hydrogen
atmo-spheres with masses near 0.5 Msunand radii around 0.2 Rsun(Heber, 1986; Saffer et al., 1994).
Their outer hydrogen layers are so thin they cannot support shell fusion, and thus they will
not ascend the asymptotic giant branch (AGB) as do normal horizontal branch stars. Once
all the helium in the core has been exhausted, the stars undergo a brief period of
helium-shell burning, evolve through the sdO region of the H-R diagram, and enter the white dwarf
cooling track. Evolutionary calculations show they have relatively short lifetimes around 100
Myr (Dorman et al., 1993) and evolve so quickly it might be possible to directly measure
Although the current and future evolutionary states of hot subdwarfs are fairly
well-understood, their formation histories have largely remained shrouded in mystery. It is widely
accepted that subdwarfs are the progeny of red giant branch stars that were somehow stripped
of their outer envelope before reaching the tip of the red giant branch (RGB). This process
reveals a hot, dense helium core surrounded by a thin hydrogen atmosphere: a hot subdwarf
star. Why this stripping occurs is a mystery.
Mengel et al. (1976) first addressed this issue by presenting a scenario in which a close
binary system could create a hot subdwarf if its progenitor (a red giant) fills its Roche lobe
near the tip of the red giant branch and loses its envelope. Various binary models have been
constructed around this idea, most of which use the angular momentum stored in stellar
bina-ries to spin up and eject the progenitor’s envelope. (Soker, 1998) added an interesting twist
to the story by demonstrating that the orbital angular momentum resident in a planet could
accomplish the same effect. His models show some of these planets might even survive this
process and continue to orbit their newly-created sdB host. Some binary formation scenarios,
such as common envelope mergers (Politano et al., 2008), the merger of two He white dwarfs
(Iben & Tutukov, 1986; Webbink, 1984), the merger of a white dwarf and M-dwarf (Clausen
& Wade, 2011), and the stripping of the RGB envelope by a supernova explosion Marietta
et al. (2000) leave behind no companion at all. In dense globular clusters, envelopes might
be stripped from collisions and close encounters (de Marchi & Paresce, 1996). Still, others
are able to draw hot subdwarf stars from their models without the assistance of a
compan-ion by invoking enhanced mass loss through strong stellar winds (D’Cruz et al., 1996) and
rotationally-induced helium mixing (Sweigart, 1997).
Hot Subdwarfs in Binaries as the Source of the Far-UV Excess 17
P = 0.1 orb ! 10 days
He
MS
He He
sdB
M = 0.4 ! 0.49 M
sun
He WD MS
short!period sdB binary with MS companion short!period sdB binary with He WD companion
common!envelope phase common!envelope phase
unstable RLOF !!!> dynamical mass transfer unstable RLOF !!!> dynamical mass transfer stable RLOF
wide binary
Common!Envelope Channels
CE only (mass ratio > 1.2 ! 1.5) stable RLOF + CE (mass ratio < 1.2 ! 1.5)
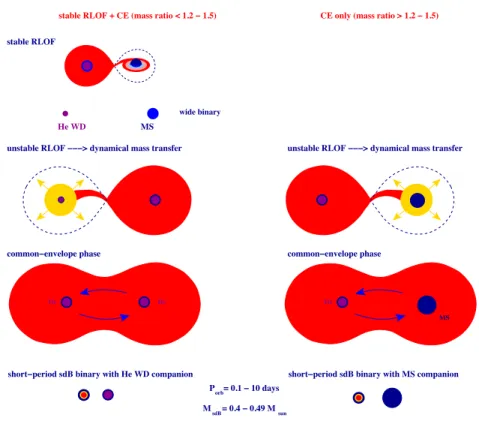
Figure 1. Common-envelope (CE) channels for the production of hot sub-dwarfs. The CE phase can be either the first (right panel) or the second (left panel)mass-transfer phase, producing a tight sdB binary with either a main-sequence or white-dwarf companion, respectively.
energy is released to eject the envelope (Paczy´nski 1976). This ends the spiral-in phase and leaves a much closer binary with an orbital period typically between 0.1 and 10 d, consisting of the core of the giant and the secondary.
In general, the CE phase can be either the first or the second mass-transfer phase in binary. In the former case, the companion of the sdB star is expected to be a normal star, most likely a main-sequence star, while in the latter case it is a helium white dwarf. In the best-fit model of Han et al. (2003), the birthrates of sdB stars in the CE channel are ∼0.7×10⁻²yr−1 for sdB stars
with normal stellar companions and∼0.4×10⁻²yr−1for sdB stars with white-dwarf companions.
Figure 1.1: Graphical depictions of common envelope and Roche lobe overflow formation channels. Taken from Figure 1 of Podsiadlowski et al. (2008)
Today, binarity remains the most widely-accepted mechanism for the formation of hot
subdwarfs. Formation models have become much more extensive since the early work of
Mengel et al. (1976) and predict that sdB stars can have main sequence companions of almost
all spectral types. Han et al. (2003, 2002) discuss the details and relative importance of
various pathways calculated from their binary population synthesis models. Figures 1.1 and
1.2 present graphical representations of these formation scenarios, which can be broken down
into three main channels: the common envelope (CE), the Roche lobe overflow (RLOF), and
the white dwarf merger channels. Together, they can produce sdBs stars with masses ranging
18 Podsiadlowski et al.
P = 10 orb ! 500 days
sdB
M = 0.30 ! 0.49 M
sun (mass ratio < 1.2 ! 1.5)
Stable RLOF Channel
stable RLOF (near tip of RGB)
wide sdB binary with MS/SG companion
envelope loss near RGB tip by stellar wind (rotation, Z?)
(1 or 2 CE phases) He WD merger
M = 0.40 sdB ! 0.65 Msun M = 0.45 sdB ! 0.49 Msun Single sdB Stars
gravitational radiation He He
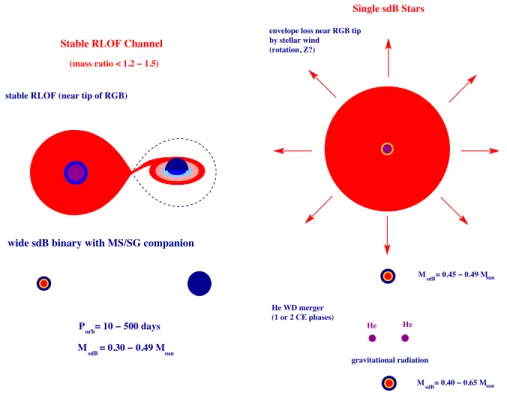
Figure 2. Stable Roche-lobe channel(left)and single-star/merger channels (right)for the formation of sdB stars.
2.2. The Stable Roche-Lobe Overflow (RLOF) Channel
The main difference in the stable RLOF channel (e.g., Mengel, Norris, & Gross 1976) is that mass transfer (the left panel in Figure 2) is stable and does not lead to a common-envelope and spiral-in phase. Because of the mass transfer, the binary system tends to widen. The typical final orbital period is 100 to 500 d (for M0 <2M!), but can be as short as a few days forM0 >2M!. Since in the latter case, the companions are expected to be A stars, it is likely that these systems are selected against in most hot subdwarf surveys.
2.3. The Merger Channel
In the merger channel (Webbink 1984; Iben & Tutukov 1986), the lighter of two helium white dwarfs is dynamically disrupted when it fills its Roche lobe. The requires that the initial orbital period of the helium white dwarf binary is close enough (∼<8 hr) that gravitational radiation can bring the system into contact. Most of the mass of the disrupted star will subsequently be accreted by the more massive white dwarf which at a certain critical mass ignites helium and becomes
Figure 1.2: Graphical depictions of Roche lobe overflow and single-star formation channels. Taken from Figure 2 of Podsiadlowski et al. (2008)
The Han models show CE evolution (Paczynski, 1976) to be the most probable formation
channel for close binary systems. This scenario involves the evolution of two main sequence
stars. If the more massive star fills its Roche lobe upon reaching the red giant phase and starts
to dynamically transfer its mass, a common envelope is formed. As the stars continue to orbit
one another, friction leads to an orbital decay, and the lost orbital energy is transferred to the
envelope, spinning it up and eventually ejecting it. The result is a hot subdwarf with a white
dwarf or cool main sequence (G/K/M) companion in a close orbit; predicted orbital periods
are less than 20 days.
Alternatively, model stars created through the RLOF channel generally have A- through
F-type main sequences companions (or G/K giants) and much longer periods (' 100 days).
This formation process differs from the CE channel in that mass transfer is stable. No
mon envelope forms, but the sdB progenitor still loses its outer hydrogen layer to the primary
via a slow accretion. In cases where a white dwarf forms from this RLOF episode, a
subse-quent CE phase can still create an sdB star from the less massive main sequence star once it
reaches the red giant branch; these are short-period sdB+He WD binaries.
The final binary channel discussed by Han et al. (2003, 2002) involves the merger of two
helium white dwarfs. The emission of gravitational waves causes the orbital separation to
decrease, and eventually, the white dwarfs will merge and create a rapidly-rotating sdB if the
total mass is right.
Since binary population synthesis models predict specific distributions of orbital periods,
companion types, and subdwarf masses, they may be tested by observations and
measure-ments of these parameters. We discuss the current state of such studies in §1.3.
1.2
Astrophysical Relevance
SdB stars are slowly attracting more attention in astrophysics due to their pulsations (see
§1.4), the gap they fill in stellar evolution theories, and their involvement in many well-known
astronomical phenomena. Having been discovered in every Galactic population and even in
globular clusters, they dominate surveys of faint blue stars in the Galaxy and even outnumber
white dwarfs down to a magnitude of B ' 18; they cannot be ignored. 40% of the stars in
the famous Palomar-Green (PG) catalog were sdB stars (Green et al., 1986). Here we briefly
review a few areas of research they may affect.
globular clusters (in addition to metallicity, the ‘first’ parameter) cannot be discussed
with-out considering the odd groupings of hot subdwarf stars along the extended horizontal branch
(see Moni Bidin et al. (2008) for a detailed review of the second parameter problem). NGC
2808 provides one of the most extreme examples of odd morphologies with its triple main
se-quence (Piotto et al., 2007) and multi-modal distribution of stars along the horizontal branch
(Dalessandro et al., 2011; Sosin et al., 1997). As sdB stars are the field counterparts to EHB
stars, their formation channels help set the distribution of stars along the horizontal branch.
Hot subdwarfs also play a role in our understanding of the UV-upturn, a mysterious rise
in the flux of giant spheroidal galaxies at extremely blue wavelengths (Code, 1969). As giant
elliptical galaxies are expected to be ‘red and dead’, the discovery of substantial amounts
of blue light (typically an indication of young stars) came as a surprise and has challenged
theory for nearly half a century. Several hypotheses have been proposed to explain the source
of the UV light, and many of them employ hot subwarf stars since they are both blue and
highly-evolved. Brown et al. (1997) present spectroscopy showing hot subdwarfs are the
most plausible source of the excess and implying they are quite common in many early-type
galaxies. Determining the number density and birthrate of sdB stars may shed additional
light on this problem.
Type Ia supernovae (SN Ia) are commonly used as standard candles for determining
dis-tances in the universe and are thus highly-regarded in cosmology. Some of the most important
results concerning cosmic evolution rely on our understanding the population of progenitors
that produce SN Ia. Theory shows they are thermonuclear explosions resulting from a white
dwarf reaching the Chandrasekhar limit (M=1.4 Msun) through mass accretion from a donor
or via a binary merger. Many hot subdwarfs, most notably those created via the common
envelope channel (see §1.3), are in close binary systems , and since they will evolve into
white dwarfs well before the systems merge, many sdB binaries might be SN Ia progenitors.
Observations of the eclipsing sdB+WD system KPD 1930+2752 suggest a combined mass
in excess of the Chandrasehkar limit, making it one of the most promising SN Ia progenitor
candidates known (Geier et al., 2007).
1.3
An Abundance of Binaries
Observationally, hot subdwarf stars seem to prefer companionship2, a characteristic first
noticed in the Palomar-Green survey, which revealed that about 50% of them have composite
colors and spectra indicative of cool main-sequence companions (Allard et al., 1994;
Fergu-son et al., 1984). Since then, reports of the sdB binary fraction have ranged from 20% up
to nearly 100%; the exact value remains uncertain even today. As discussed in §1.1, many
theories invoke the presence of binaries to expel the outer envelope of the sdB progenitor
as it evolves along the red giant branch, a hypothesis in line with the high binary fraction
shown by observations. This raises the question: Areall hot subdwarfs created by binary
companions?
Several composite-color studies have looked for infrared flux excesses and spectroscopic
signatures indicative of cool companions around hot subdwarf stars. Stark et al. (2004),
for instance, studied sdBs in the Two Micron All Sky Survey (2MASS) and found a binary
2sdOs seems to show a much smaller binary fraction than sdBs (Napiwotzki et al., 2004), suggesting they
fraction near 30% based upon the morphology of optical-IR color-color plots. Other studies
make use of spectral signatures (Lisker et al., 2005), infrared excesses (Thejll et al., 1995;
Ulla & Thejll, 1998), and spectral energy distributions (Aznar Cuadrado & Jeffery, 2001) and
together find an average value near 50%. In a select few cases, light variations from reflection
effects, ellipsoidal variations, and eclipses signify the presence of a binary. Photometric and
spectroscopic surveys preferentially find hot subdwarfs in systems where the sdB outshines
its companion, a condition met by G/K/M main sequence and white dwarf companions. Not
surprisingly, these stellar classes represent almost all of the companion types found to date.
The subdwarfs predicted to reside in binaries with early-type stars will be nearly impossible
to detect at optical wavelengths.
Radial velocity (RV) surveys can reveal the presence of both visible and non-visible
com-panions and find that many apparently-single sdB stars are RV-variable and reside in close
binaries. Example searches include those of Maxted et al. (2001), Napiwotzki et al. (2004),
and Copperwheat et al. (2011) which together show a close binary fraction up to two-thirds3.
Similar to the composite-color surveys, these studies are biased towards systems with small
separation distances, high masses, and short orbital periods.
Unbiased catalogs of sdB binaries and measurements of their orbital parameters can
strongly constrain binary evolution models. The majority of hot subdwarf orbital
param-eters calculated to date come from radial velocity measurements (Geier et al. 2011, Table
A.1). In almost all of these systems, the companion contributes a negligible amount of the
light, and measurements are confined to reflex motion of the sdB. By assuming the
canoni-3RV studies in globular clusters reveal an extremely low (<4%) fraction of binaries, implying sdBs here
form differently than their field counterparts (Moni Bidin et al., 2008).
cal mass (0.5 Msun) for the subdwarf, the mass function is simplified to the point where the
companion mass can be computed. Orbital parameters have been measured for around 100
binaries and show periods ranging from 0.07 to 28 days with a median at 0.61 days. Most
measured periods fall below 1 day; only two are longer than 10 days.
The observational biases mentioned above may distort our understanding of the binary
fraction and, consequently, the relative importance of various sdB formation channels. Most
of the companions found to date are cool, late-type main sequence stars or white dwarfs,
and nearly all of the sdB binaries for which orbital parameters have been calculated are
ex-tremely close binaries. No combination of the binary models of Han is completely consistent
with the observations; both single and binary hypotheses are necessary to reproduce the data.
Moreover, almost all binaries found have short periods and probably formed through the
CE scenario. The RLOF channel, which supposedly produces sdBs with early-type
com-panions, still awaits observational confirmation. Observational biases against detections of
bright companions with long orbital periods (and, thus, slow orbital velocities) are probably
to blame. Searches for sdBs around early-type main sequence stars showing an excess UV
flux will help address this problem and are currently being conducted (Wade et al., 2010).
Luckily, some hot subdwarfs pulsate, and their pulsations provide an alternative method
for detecting companions with smaller masses, slower velocities, and longer periods than
can be achieved using the RV and color-composite techniques. Additionally, comparisons of
model pulsators to observations can provide measurements of their masses, radii, and other
fundamental properties. We have done both these things in this dissertation and show how
and their relative contributions.
1.4
Pulsating Hot Subdwarf Stars
The discovery of the first pulsating hot subdwarf star was unarguably serendipitous; it
survived one stellar misclassification and required another. The Edinburgh-Cape (EC) survey,
a search for blue stars in the Southern hemisphere, has uncovered many new white dwarfs,
hot subdwarfs, cataclysmic variables, blue horizontal branch stars, quasars, and normal
B-type stars at high galactic latitudes since its inception (Kilkenny et al., 2010). One of its
objects, EC 14026-2647, was originally classified as an F- or G-type because of the presence
of Ca II lines and the G-band. Follow-up photometry, on the other hand, showed the star
was too blue to fit either classification, and so an additional, higher-quality spectrum was
obtained. Broad hydrogen Balmer lines pointed towards it being a hydrogen-atmosphere
white dwarf (DA), but the lines were much narrower than typical DAs; nonetheless, it was
marked down as a white dwarf and added as a candidate ZZ Ceti star since its colors matched
those of stars in the ZZ Ceti instability strip. During a high-speed photometric survey for
new pulsating white dwarfs from the EC sample, Kilkenny et al. (1997) discovered
multi-periodic oscillations in the star with periods on the order of minutes and amplitudes less than
1%. It was later realized EC 14026-2647 was in fact an sdB and represented the first pulsator
found amongst the hot subdwarfs. Since they were not expected to pulsate at the time, EC
14026-2647 would have been left offof the target list for their survey had it originally been
classified properly.
Class Name Aliases Periods Number Description
sdBVr EC14026, V361 Hya 80-600 s >50 rapid p-mode pulsations
sdBVs ’Betsy’ stars, V1093 Her 1-2 hr >50 slow g-mode pulsations
sdBVrs ’Hybrid’, DW Lyn 80 s - 2 hr <10 hybrid p- and g-mode pulsations
He-sdBV – 1954-5084 s 1 high-order non-radial g-modes?
sdOV – 60-120 s 1 p-mode pulsations?
Table 1.1: Classes of pulsating hot subdwarf stars. The nomenclature used is that proposed by Kilkenny et al. (2010)
1.4.1
Observations
Since this initial discovery, more than one hundred pulsating hot subdwarf stars have been
discovered; they come in five different flavors, as shown in Table 1.1. Only one example each
of the pulsating sdO (Woudt et al., 2006) and He-sdB stars (Ahmad & Jeffery, 2005) has been
found, and so confirmation that these stars are actually members of pulsating classes still
awaits. Members of the three confirmed classes show photometric variations falling into two
categories: rapid oscillations with periods from 1-10 min and amplitudes near 1% (sdBVr
stars), and slow oscillations with periods from 45 min to 2 hours and amplitudes nearer
0.1% (sdBVs stars). A small subset of hybrid pulsators exhibit both types of oscillations
(sdBVrsstars). Slowly-pulsating sdB stars are more difficult to observe and characterize than
their rapidly-pulsating counterparts; they generally require 10% longer observing baselines
to sample their lower frequencies and larger telescopes to resolve their lower amplitudes.
Due to these limitations, we have concentrated our efforts on rapid pulsations.
The sdBVrstars cluster together in the logg-Te f f plane in an empirical instability strip4
bounded by 28000 K ≤ Te f f ≤ 36000 K and 5.2 ≤ log g ≤ 6.2 (see Figure 1.3). Unlike
the ZZ Ceti instability strip, which might be pure (Castanheira et al., 2010), only about one
4g-mode pulsators also cluster together in an instability strip bounded by 28000 K≤T
e f f≤36000 K. Hybrid
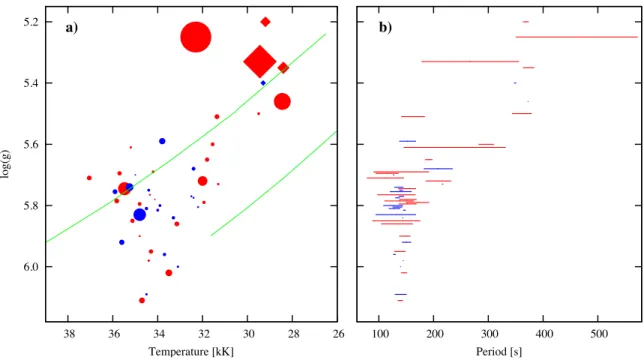
Østensen, Oreiro, Solheim et al.: A Survey for Pulsating sdB Stars 13 5.2 5.4 5.6 5.8 6.0 26 28 30 32 34 36 38 log(g) Temperature [kK]
a) 5.2
5.4
5.6
5.8
6
100 200 300 400 500
Period [s] b)
Fig. 6. a)Teff–logg diagram for the objects in Table 9. Filled circles indicate V361 Hya type pulsators and diamonds
indicate hybrid DW Lyn type pulsators. The size of the symbols is proportional to the pulsation amplitude,Amax. The
nineteen sdBVs from this survey that we haveTeffand loggfor are shown in blue, and short period pulsators from other
surveys in red. The green lines indicate the canonical zero age EHB (lower line) and terminal age EHB for an 0.47 M!
core (from Kawaler & Hostler 2005) with envelope mass increasing from bottom to top. The ZAEHB starts at a loggof 5.9 with an envelope mass fraction of only 0.02%, and the objects that appear to lie on the extension of this line cannot be explained by the canonical models. b)P–loggdiagram for the same pulsators. The bars indicate the range of detected pulsation periods in any particular star, excluding harmonics andg-modes. The loggvalues have been shifted by up to ±0.04 dex to avoid overlaps.
1 mma. This could probably be increased by focusing only on the hot end of the EHB, between 31 and 36 kK, at the cost of sacrificing discoveries of the rarer pulsators at the cool end of the instability region.
That the colour selected sample has a lower success frac-tion than the samples based on spectroscopy is not sur-prising, but it is surprising that there are so few pulsators in the sample from Saffer et al. (1994). The total number of sdB stars in that sample hotter than 28 kK are 44, of which we observed 16 (plus another eight that were out-side the borders of the instability region). Excluding the known g-mode pulsators on the cool end of that sample, we have two short period sdBVs in 41 stars; QQ Vir found by us and V1078 Her found by Bonanno et al. (2003). A large number of stars from this sample were surveyed by Bill`eres et al. (2002), and the remaining stars have been checked by other observers (but no limits have been pub-lished), so we do not expect more clear pulsators in this sample, although some low amplitude variables may have been missed. Similarly, the number of sdB stars in the insta-bility region in the sample of Maxted et al. (2001) is 34. We found no pulsators in this sample, but it has been heavily exploited by other groups; Bill`eres et al. (2002) surveyed 14 of them and found one: UY Sex. When combining informa-tion from this and other unpublished surveys, we can only find a single star that has yet to be surveyed. Thus, the best fraction from the Maxted et al. (2001) sample we can
infer is 3 %, which is lower than what we have found in the HS,spyand SDSS samples, but with such small samples this is barely significant.
6.3. The big picture
We have compiled all the known short period sdB pulsators in Table 9, using data from the literature and added the re-sults from this paper. We included preliminary physical pa-rameters on two new pulsators published by Kilkenny et al. (2009), based on recent low-resolution spectroscopy from not/alfosc (3 250 – 6 150 ˚A at ∼4.5 ˚A resolution), using the same atmosphere models as in our other determina-tions. A few stars still lack temperature and gravity esti-mates from spectroscopy, but we have supplied values from our own alfoscspectroscopy where available. The table may also not be entirely complete. PG 0856+121, for which Piccioni et al. (2000) reported what they termed ‘a pul-sation episode’, was dropped from the table as repeated attempts (Reed, priv. comm) have failed to confirm any pulsations. Such brief pulsation episodes may be common in sdB stars, but they are hard to catch and characterise.
The first sdB pulsator candidate in a globular clus-ter was reported by Randall et al. (2009a), but while the single clear period at 114 s makes this star a very likely sdBV, spectroscopic confirmation remains to be done. The same is the case for the pulsator candidate reported by
Figure 1.3: a) Te f f-log g diagram for the majority of rapidly-pulsating sdB stars. Filled circles indicate sdBVr star, and diamonds represent hybrid pulsators (sdBVrs); their sizes scale with pulsation amplitude. b)P-loggdiagram for the pulsators in a). The bars represent the range of detected periods. Plot taken from Østensen et al. (2010a).
in ten stars in the sdBVr strip pulsates. Current theory cannot explain this coexistence of
pulsators and pulsators. Analysis of high-resolution UV spectra of pulsators and
non-pulsators taken from HST/STIS showed no clear and consistent differences in the abundance
patterns (O’Toole & Heber, 2006). We note that recent studies of sdBV stars in the
Ke-pler field (Baran et al., 2011) reveal pulsation amplitudes down to unprecedented levels (<
0.01%), and so the apparent impurity of the strip might instead be an observational bias
against low-amplitudes.
Pulsators display a wide variety of pulsation spectra, as illustrated in Figure 1.4. Some
have extremely simple temporal spectra dominated by only a few frequencies (e.g., HS
0444+0458, Reed et al. 2007). Most, however, are multi-mode pulsators displaying several
Observations of pulsating subdwarf B stars 17
Figure 9.Schematic representation of the temporal spectra of sdBV stars with follow-up data ordered bylogg(from lowest to highest). Blue arrows indicate frequencies that are not regularly detected and green arrows for PG 0014 indicate frequencies only detecting using ULTRACAM. Shown here are the stars with lower gravities.
In the right panel, we have rescaled pulsation frequencies by1/g0.75 (assuming constant mass) which is an adjustment for both size and density using justlogg. For the three sdBV stars without
measured gravities, we estimated the gravity from the position of the shortest frequency compared
to pulsators with known gravities. These assumed gravities are provided in parentheses in Fig. 11
and Table 6. Such a study of pulsating white dwarfs revealed groups of frequencies which could
then be related to individual modes (Clemens 1994). However, as evidenced by the summation of
the right panel, no such groupings occur. The horizontal line just above the summation frequencies
(right panel of Fig. 11) shows the effect of an error oflogg = 0.05in the rescaling. It is therefore
possible that any groups are being smeared out by measurement errors inlogg. We attempted to
correct for this by fixing the lowest modified frequency to a given value, but no corrections or fixed
reference values ofloggshow reasonably-separated grouping that could be of use.
Relative pulsation amplitudes:The line lengths in Figs. 9 through 11 indicate another feature
that is observed about half the time; one or two amplitudes are significantly higher than the rest. Figure 1.4: Schematic representations of the temporal spectra of several sdBVrstars. Taken from Figure 9 of Reed et al. (2007)
pulsations frequencies with a large range of amplitudes. Baran (2009), for example, detected
nearly 100 independent oscillation modes in the hybrid pulsator Balloon 090100001.
Re-solving such dense pulsation spectra requires large amounts of observing time with as few
interruptions as possible; the Whole Earth Telescope, a world-wide network of telescopes,
was originally established to address these criteria in studies of white dwarfs (Nather et al.,
1990).
When considering the ensemble of all known sdBVr stars, only a few correlations stand
out. Reed et al. (2007) analyzed the pulsational properties of all known sdBV stars at the
time and found periods tend to decrease with increasing surface gravities and temperatures.
be weakly correlated with logg: the highest-gravity pulsators tend to have amplitudes evenly
distributed between frequencies while lower-gravity sdBVs show a more uneven distribution.
Interestingly, almost all pulsators observed for two or more seasons show amplitude
varia-tions (Kilkenny, 2010). Whether they represent intrinsic variavaria-tions in the star or beating due
to unresolved, closely-spaced frequencies remains to be seen.
Observations of sdBV pulsations are not limited to photometric studies; surface motions
in the atmosphere can be observed through radial velocity measurements. Such spectroscopic
analyses have been carried out for several sdB stars and show velocity variations at the same
frequencies as modes in the light curve but out-of-phase by approximately 90 degrees (e.g.,
O’Toole et al. 2000; Telting & Østensen 2004). Te f f and loggvariations during a pulsation
cycle as small as 100 K and 0.01, respectively, have even been measured through line profile
variations (Tillich et al., 2007).
1.4.2
Theory
Contemporaneous with the discovery of the first pulsator, Charpinet et al. (1997, 1996)
predicted the existence of a class of pulsating sdB stars based on the presence of acoustic
modes in the envelopes of their model stars at the right temperatures and surface gravities.
The oscillations they found were driven by a κ-γ mechanism associated with an opacity
bump in a region of the star where iron-group elements are partially ionized. Under the right
conditions, these layers can act like heat engines. A perturbation leading to a compression
of the gas increases the surrounding pressure, causing the opacity to go up. Since the gas is
more opaque, it traps more energy radiating outwards from the core and builds up excess heat.
A subsequent expansion driven by this buildup pushes the gas beyond its equilibrium state,
decreases the opacity, and allows the excess energy to escape. The layer then contracts again
to start the cycle over. Both radial and non-radial pulsations can be driven by this process
and are referred to asp-modes since pressure acts as the restoring force. The opacity bump
in the partial ionization zone is fundamental to this picture, and its sensitivity to temperature
gives rise to the instability strip.
The oscillations themselves are modeled using a superposition of spherical harmonics
defined by their degree (l), order (m), and radial order (k). lcounts the number of nodal lines
on the surface, whilem counts those intercepting the rotational axis of the star. The radial
order k represents the number of nodal lines in the radial direction. The total brightness
observed represents an integration of the flux over the entire surface. For this reason, modes
with high-ldisplay small observable amplitudes. A star pulsating with multiple modes shows
total brightness variations that can be represented using a superposition of sine waves with
different frequencies, amplitudes, and phases.
Models are able to reproduce periods almost identical to those observed (Fontaine et al.,
2008), but the calculated instability strip has a broader range of temperatures than the
em-pirical one. Moreover, the pulsation models cannot explain why pulsators and non-pulsators
with the same physical parameters co-exist in the empirical instability strip. Small changes
in the amount of iron available in the partial ionization zone, whether due to weak winds or
other phenomena, however, could greatly affect the driving of modes and might explain this
1.4.3
The Profit of Pulsations
The discovery of the first pulsator opened up the prospect of studying the structure and
interiors of hot subdwarfs using their pulsations. Just as geophysicists infer the interior
struc-ture of the earth by monitoring the propagation of vibrations along the crust and comparing
them to models, astronomers gain insight into stellar interiors by monitoring the pulsations
of stars. This research domain, called asteroseismology, has shed light on the Sun, white
dwarfs, RR Lyraes, and Cepheids, among other types of puslators. By matching observed
pulsation periods with computed modes, one can derive fundamental parameters including
mass, radius, temperature, surface gravity, and envelope mass. Measurements of these
pa-rameters, especially the mass, provide excellent tests of binary population synthesis models
and help constrain their relative contributions. The first effective application of
asteroseis-mology to a hot subdwarf was carried out on PG 0014+067 by Brassard et al. (2001), and
since then, solutions have been derived for at least 12 stars. In the case of PG 1336-018, an
eclipsing binary with a pulsating sdB star, the seismic analysis was found to be consistent
with an independent binary light curve analysis (Charpinet et al., 2008).
Although powerful, seismological techniques cannot be applied to all pulsating sdB stars.
Identification of thel andm of the modes, a pre-requisitie for period-matching techniques,
can be achieved by modeling the pulsational amplitudes at different wavelengths (see
Trem-blay et al. 2006 for a summary). Unfortunately, few studies are able to report convincingl
identifications since somelvalues, most notablyl=1,2, & 3, have nearly identical color
de-pendencies (Ramachandran et al., 2004) and amplitude limits are generally not good enough
to discriminate between these possibilities. Baran et al. (2008) demonstrated that
resolved spectroscopy can be combined with multi-color photometry to almost guarantee
identification, but this method is restricted to only the brightest pulsators for which high S/N
spectroscopy can be obtained. The rare case of a radially-pulsating sdB star with a single
mode offers an opportunity to apply the Baade-Wesselink method (Baade, 1926; Wesselink,
1946), which can be used to determine the mass, radius, distance, and density. We present
the first application of this method to an sdB star in Chapter 3.
Pulsation modes can reveal interesting information even for those stars not worthy of full
asteroseismic analyses. Rotation rates of sdBs can be determined by investigating small
fre-quency splittings of non-radial oscillation modes. Pulsations can also reveal small structural
changes exhibited by a star as it evolves. Analogous to the change in pitch of a vibrating
string upon varying its length, stellar pulsation spectra evolve with the structure of stars.
Once helium becomes depleted in the cores of sdB stars, they begin to contract, and the
fre-quency of acoustic oscillations increases. Charpinet et al. (2002) calculated values of ˙Pfor
p-modes (their Appendix C) for representative models at different ages and find typical
val-ues around 10−12. Measurements of period changes help constrain their evolutionary models
but are difficult to make.
Lastly, pulse timing measurements provide an opportunity to help assess the binary nature
of hot subdwarfs. The compact structure of pulsating sdB stars makes their oscillation periods
extremely stable, and for this reason, it is possible to measure small changes in the pulse
timings indicative of binary reflex motion or changing pulsation periods. Once a set of model
predictions has been made for the arrival times of photons, observations can be compared to
an observed-calculated (O-C) diagram (see Sterken 2005 for an overview of this method).
Silvotti (2007) applied the pulse timing method to V391 Peg and reported the discovery of
a 3.2 MJ mass planet in a 3-year orbit. Although the technique shows great potential for
detecting companions with orbital parameters out of reach of radial velocity seaches, no
independent observations have verified that the pulsations of sdB stars are adequate for the
method. We address this issue in Chapter 5.
1.5
Plan of this Work
The work in this thesis was originally motivated by two connected questions: “Are all
hot subdwarfs in binary systems?” and “What are the masses of hot subdwarfs?” As
pulsat-ing hot subdwarfs provide more observational avenues for addresspulsat-ing these questions than
their constant counterparts, we decided to conduct a survey for new pulsating sdB stars with
PROMPT. Chapter 2 discusses the nature of this survey and its findings. Specifically, we
were hoping to find pulsators with oscillations that lend themselves to the fruitful
observa-tional analyses discussed in §1.4.3. As luck would have it, one of the first sdB targets we
observed, CS 1246, proved to be a new pulsator fulfilling this role. The remainder of this
thesis centers around studies of this star.
In Chapter 3 we apply the Baade-Wesselink method to CS 1246 using time-series
spec-troscopy from the SOAR telescope and derive its mass, radius, and distance. This is the first
time this technique has been applied to an sdBV star. Our study paves the way for future
applications of the method to radially-pulsating sdBV stars, which may provide some of the
most precise measurements of an sdB mass ever made5.
Taking advantage of the simple pulsation spectrum of CS 1246, we were able to use
pre-cise measurements of the pulse arrival times to look for slow evolutionary changes in the
structure of the star and for the presence of binary companions. In Chapter 4 we present over
a year’s worth of pulse timings, from which we constructed an O-C diagram revealing the
presence of an undetectable M-dwarf or white dwarf. This represents the first unambiguous
detection of a binary companion around a hot subdwarf using this method. We verify this
result in Chapter 5 using precise radial velocity measurements from the Goodman
Spectro-graph on the SOAR telescope. Our study demonstrates that the rapid pulsations of sdB stars
are adequate clocks for the detection of unseen companions down to planetary-size.
Chapter 2
A Survey for Pulsating sdB Stars with
PROMPT
“Constant stars are awful.”
–Mike Breger
Although more than one hundred sdBV stars have been found to date, information cannot
be extracted from all of them. Many oscillate with amplitudes too small to be useful. Those
with reasonable amplitudes (>0.5%) display a wide-variety of characteristics. Pulsators with
only a few, well-separated modes are excellent for measuring small frequency changes and
phase variations, as long as their amplitudes are reasonably stable. The extreme case of a
pulsator with a single, large-amplitude mode could provide direct mass and radius
found. Simple pulsators are not great candidates for the period-matching techniques used in
asteroseismology, however, which are better-suited to stars with rich pulsation spectra. Here
we present results of a survey carried out with PROMPT to look for new variable and
pul-sating hot subdwarf stars in the Southern-hemisphere. CS 1246, a new rapidly-pulpul-sating sdB
star uncovered in our work, is one of the most exciting hot subdwarf stars found to date and
the subject of Chapters 3, 4, & 5.
2.1
Target Selection
As hot subdwarf stars represent the majority of faint blue stars in the Galaxy brighter
thanB' 18, they are available from numerous surveys. Targets for our survey were selected
from three primary sources: (i) the Online Subdwarf Database, an electronic catalog listing
nearly than 2500 hot subdwarfs of every spectral class (Østensen, 2006), (ii) the Sloan
Dig-ital Sky Survey, and (iii) unpublished stars in Zone 2 of the Edinburgh-Cape Survey, which
were kindly provided to us by Dave Kilkenny of the University of the Western Cape. The
primary source used is the Online Subdwarf Database, which compiles hot subdwarfs from
the Palomar Green (49%), Edinburgh-Cape (14%), and BPS (14%) surveys.
As discussed in the preceding chapter, sdBVrstars plotted in the logg-Te f f plane cluster
together in an empirical instability strip. Many past surveys have utilized this information
by selecting only candidates falling within this region (Bill`eres et al., 2002; Østensen et al.,
2010b). We, however, do not implement this criterion for two reasons: atmospheric fits
remaining biased towards the instability strip. Our only selection criteria were practical in
na-ture, governed by the aperture of the PROMPT telescopes and their location. We chose stars
that were in the Southern-hemisphere, brighter than V=15.5, and classified as hot subdwarfs.
2.2
Observations, Reductions, & Analyses
We obtained time-series photometry on each candidate pulsator using one of the PROMPT
telescopes1 (Reichart et al., 2005). Depending on the brightness of the target, we gathered
1-5 hours of photometry on each target using exposure times of 15-40 seconds. An additional
six seconds of dead time for readout and processing resulted in cycle times of 21-46 seconds
(71-87% duty cycle). In almost all cases, no filter was used in order to maximize the
num-ber of counts. Although an observed pulsation amplitude can vary greatly with wavelength,
usually being largest in the blue, the pulsationphasegenerally does not change significantly
with waveband (Randall et al., 2005). If there were a strong wavelength dependence on the
phase, a filter with too large a bandpass (or no filter) could partially wash out the pulsations.
In order to create light curves from the raw images, we extracted photometry using the
external IRAF package CCD HSP2, developed by Antonio Kanaan, and a photometry
pro-gram we wrote in IDL that uses the function APER3. We computed signal-to-noise (S/N)
estimates with different-sized apertures and used the aperture that maximized the S/N in the
light curve (Howell, 1989). We divided our light curves by those of constant comparison stars
to remove small-scale variations in the sky transparency and corrected atmospheric extinction 1One star, JL 166, was observed with SOAR.
2CCD HSP employs the aperture photometry preferred by O’Donoghue et al. (2000) 3APERis based on DAOPHOT (Stetson, 1987)
The Survey Dataset Number of target fields: 212
Number of exposures: 63,607 Number of telescopes: 4
Total integration time: 615 hours Size of data set: 65 GB
Table 2.1: Summary of Survey Observations
effects to first-order by fitting and normalizing the curves with parabolas. This
normaliza-tion may remove real varianormaliza-tions in the stellar brightness on the order of our run lengths, and
consequently, our survey is not designed to detect the low-amplitude, long-period variations
associated withg-mode instabilities.
We analyzed each reduced light curve by computing its discrete Fourier transform (FT)
using tools including WQED (Thompson & Mullally, 2009), Period04 (see Lenz & Breger
2005), and a suite of programs we wrote in IDL. Investigating the amplitude spectra created
from these FTs may reveal periodicities in the light curve that are not apparent to the eye. For
each target, we computed the mean noise level and highest peak in the amplitude spectrum
from 1000µHz out to the Nyquist frequency4. The frequency regime below 1000 µHz was
ignored due to the normalization procedures discussed earlier. By considering how high
above the mean noise level the largest peak was, we determined whether the star represented
a new pulsator (or variable), needed additional follow-up to determine its status, or was
observed not to vary (NOV) within our detection limits.
4The Nyquist frequency is half the sampling frequency of the data. For example, a dataset with a 36-s
2.3
Noise and False Alarms in the Data
Several phenomena can masquerade as stellar pulsations and are worth discussing briefly.
The first and most troublesome for our survey is a small, periodic mount wobble associated
with the PROMPT telescopes with a period of 150 s and amplitude around an arcsecond in
the images. This movement, albeit a small one, periodically elongates the shapes of objects
as they appear on the CCD. If the aperture used to measure stellar flux does not encompass
the entire star when it is most elongated, one will underestimate the flux in that particular
frame. The Fourier transform is quite sensitive to such changes and shows a large peak at
the telescope wobble frequency (6667 µHz). Unfortunately, 150 s falls right in the middle
of observed sdBV periods, and so we are cautious when dealing with peaks in the FT near
this frequency. We can usually decide whether a peak is wobble-induced by its response to
changes in the apertures size; the signal disappears quickly as the aperture size is increased
to extremely large values encompassing the elongation region.
Sky variations can also produce peaks in the amplitude spectra. While such variations are
typically incoherent, rows of thin clouds passing across the field of view can generate periodic
variations in the flux. Sky variations are typically removed through division of constant
comparison star light curves, but color differences between the target and comparisons can
leave residual flux variations in the reduced light curve. We can usually recognize such
residuals by comparing their patterns to raw, undivided light curves taken on that night.
Lastly, noise itself can produce peaks in the FT resembling a stellar pulsation. If a
ques-tionable signal is found in the FT of a single night’s light curve, we evaluate its significance
by calculating the false alarm probability, the odds of a peak with some amplitude
occur-ring by chance within a particular frequency range (Horne & Baliunas, 1986). Additional
follow-up photometry is the easiest way to address the nature of questionable peaks and is
the procedure we followed when possible.
2.4
Survey Results
In total, we checked 212 hot subdwarfs for variability using the PROMPT telescopes over
a period of two years. Appendix A presents a log of all survey observations. Our complete
dataset consists of over 63,000 individual exposure taken primarily with PROMPT 3 and
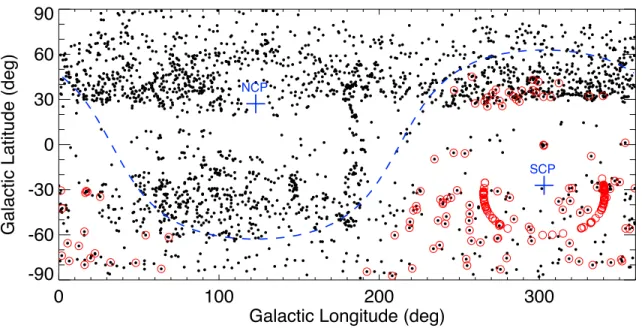
represents over 600 hours of time-series photometry. Figure 2.1 shows the locations of our
targets in Galactic coordinates; most of our targets are located at Southern Galactic latitudes.
The North and South celestial poles and the celestial equator are marked in blue for reference.
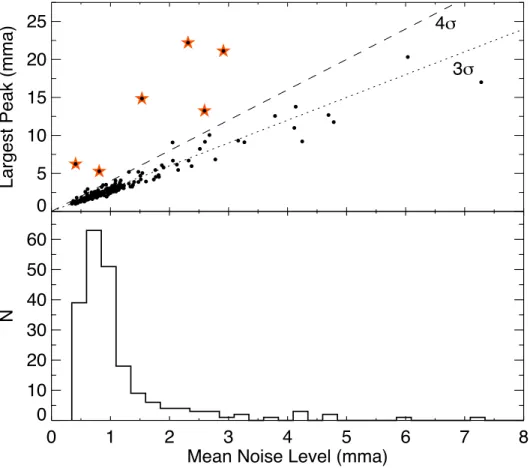
Figure 2.2 summarizes the quantitative results of our survey, which are also presented in
tabular format in Appendix A. The bottom panel shows a histogram of the mean noise levels
achieved in all of our survey light curves; the median is less than 0.1%, much lower than
typical pulsation amplitudes of sdBVr stars but an order of magnitude higher than the
low-amplitude sdBV modes recently detected by Kepler. The top panel of Figure 2.2 plots the
largest peak detected in each target’s FT against the mean noise level. 3- and 4-σ detection
levels are marked with dotted and dashed lines, respectively.
Almost all stars in our survey were not observed to vary (NOV). The detection
0 100 200 300 Galactic Longitude (deg)
-90 -60 -30 0 30 60 90
Galactic Latitude (deg)
SCP NCP
Figure 2.1: Targets observed in our survey (red circles) plotted over all hot subwarfs in the Online Subdwarf Database (black points). The celestial poles and equator are marked in blue for reference. EC Zone 2 targets easily stand out as a band of points in the lower right.
Sample Size Variables Fraction Selection Criteria
South Africa 1200 20 1.7 none
Bill´eres 74 4 5.4 Te f f
Dreizler 12 1 8.3 Te f f
Østensen 309 24 7.8 Te f f
THIS WORK 212 6 2.8 none
Table 2.2: Yields of sdBV Surveys
weather conditions, and total length of the run. Although one would typically expect a
cor-respondence between the brightest stars and lowest detection limits, this was not always the
case since brighter targets were often observed for a shorter amount of time and weather
conditions varied greatly from night to night.
0 5 10 15 20 25
Largest Peak (mma)
4m
3m
0 1 2 3 4 5 6 7 8
Mean Noise Level (mma) 0
10 20 30 40 50 60
N
sdB Target Field Variable Type Period Peak-to-Peak Amplitude HE 0231-3441 δScuti 50.5 min '20%
HE 0307-4554 unknown >3 hours >15% HE 0340-3820 unknown >2 hours 10% HE 0444-4945 RR Lyrae? >4 hours >50% HE 0505-3833 RR Lyrae? >3.5 hours >40% planet transit/eclipse? >4 hours 7.5 % EC 04582-5357 unknown >1.25 hours >6% EC 05282-3316 eclipse? >3 hours >10% EC 05395-4246 δScuti? '3 hours 10% EC 19269-6231 unknown >2 hours >2% EC 19385-5259 unknown >2 hours >2%
Table 2.3: Non-sdB variables uncovered in our survey, listed according to the sdB target field they fell in. Constraints on their periods and amplitudes based off of the light curves are shown.
2.5
Consolation Prizes
Occasionally, a star we tried to use as a constant comparison star turned out to be a
variable itself. As almost all of the sdB targets (the primary targets) were not observed to
vary, we refer to these new non-sdB variables as ‘consolation prizes.’ Although they are not
directly related to the topic of this dissertation, they may prove to be interesting additions to
their respective variable star classes. We have found at least ten such stars and list them in
Table 2.3 along with the type of variable we believe them to be. Unless they shared the field
with a variable hot subdwarf, follow-up light curves were not obtained.
2.6
Notable Detections
Targets marked with star symbols in Figure 2.2 represent confirmed or candidate variable
and pulsating stars uncovered by our survey and fall well above the 4-σline, as one would
expect. They are listed in Table 2.4. Of these six systems, two are pulsators that were already
Target Name Type Comments
CS 1246 sdBVr new pulsating subdwarf B star
EC 10246-2707 sdB+dM new eclipsing binary system
HE 0230-4323 sdBVr published contemporaneous with our discovery (Kilkenny et al., 2010)
HE 0341-2449 sdBVr candidate pulsating sdB; period close to mount wobble
JL 166 sdBVr new pulsating subdwarf B star; discovered with the SOAR telescope
PHL 252 sdBVr already published under EC 22221-3152 alias (Kilkenny et al., 2009)
Table 2.4: Notable Survey Detections
known or published contemporaneously with our discovery. We briefly discuss the other
targets in the sections that follow.
2.6.1
JL 166
JL 166 was the first pulsating hot subdwarf we discovered5. In fact, it was the first
hot subdwarf our group observed for variability. Although we knew JL 166 had atmospheric
parameters placing it in the instability strip (Heber, 1986), our discovery was surprising since
only one in ten stars in the strip pulsates. Moreover, Arlo Landolt had recently listed the
star as a candidate photometric standard (Landolt, 2007) and was planning on follow-up
observations to seal its status as one (priv. comm.) until we informed him of its variability.
Figure 2.3 shows the discovery light curve taken with SOAR, which shows beating due
to multiple pulsation frequencies. Although the pulsations were uncovered using SOAR, we
could have discovered it with PROMPT, given the star’s brightness and pulsation amplitude.
To test this, we re-observed it with PROMPT and re-discovered its pulsations using our
de-tection criteria. From two nights of SOAR data, we found at least 10 independent pulsation
modes with amplitudes range from 0.09% to 0.4%. The presence of the He II line at 4686