Department of Economics
21/2005
National Flood Damage Evaluation Methods
A Review of Applied Methods in England,
the Netherlands, the Czech Republic and Germany
Volker Meyer, Frank Messner
November 2005
Dr. Volker Meyer ([email protected]) Dr. Frank Messner ([email protected]) UFZ–Umweltforschungszentrum Leipzig–Halle Department Ökonomie Permoserstr. 15 D–04318 Leipzig Tel: +49 341 235-3263 bzw. -2204 Fax: +49 341 235-2825 .
National Flood Damage Evaluation Methods
A Review of Applied Methods in England, the Netherlands,
the Czech Republic and Germany
Volker Meyer and Frank MessnerS
UMMARYThis Report is the first deliverable of FLOODsite task 9, which is on flood damage evaluation methods. It summarises both the outcome of a literature survey on flood damage evaluation methods in selected EU countries and the major results of complementary expert interviews. The overall objective is to identify the methodological diversity regarding the practical application of flood damage evaluation methods in EU countries, which are known to have a leading position in this field. The results of this report are an important prerequisite for the major deliverable of task 9, which aims, among others, at proposing harmonised state-of-the-art methods and principles for flood damage analysis in EU countries.
The report shows that the four countries, England, the Netherlands, the Czech Republic and Germany, which feature very different histories of flood protection policy and different institutional settings, use sophisticated methods of flood damage evaluation. These in principle follow the same idea, namely trying to put economic values to elements of flood risk in order to estimate the benefits of flood protection measures in terms of prevented flood damage. In detail, though, the methods exhibit many different approaches. The major differences in flood damage evaluation methods relate to the damage categories considered, the degree of detail, the scale of analysis, the application of basic evaluation principles (e.g., replacement cost versus depreciated cost), and the application or non-application of results in benefit-cost and risk analyses. This diversity of flood damage evaluation methods, even in riparian states which share a major river, indicates that there is still a lack in transboundary cooperation in flood policy decision making in the EU.
A
CKNOWLEDGEMENTThe work described in this publication was supported by the European Community’s Sixth Framework Programme through the grant to the budget of the Integrated Project FLOODsite, Contract GOCE-CT-2004-505420.
D
ISCLAIMER OF LIABILITYThis document reflects only the authors’ views and not those of the European Community. This work may rely on data from sources external to the FLOODsite project Consortium. Members of the Consortium do not accept liability for loss or damage suffered by any third party as a result of errors or inaccuracies in such data. The information in this document is provided “as is” and no guarantee or warranty is given that the information is fit for any particular purpose. The user thereof uses the information at its sole risk and neither the European Community nor any member of the FLOODsite Consortium is liable for any use that may be made of the information.
C
ONTENTS Summary 1 Acknowledgement 1 Disclaimer 1 Contents 2 1. Introduction ... 42. Methods of Flood Damage Evaluation in England ... 5
2.1 Existing approaches on different spatial scales ... 5
2.2 Objective of damage evaluation ... 6
2.3 Damage categories considered ... 6
2.4 Description of methods used for damage evaluation... 8
2.5 Integration in benefit-cost analysis... 10
2.6 Shortcomings, Uncertainties, Improvements & Comments ... 11
3. Methods of Flood Damage Evaluation in the Netherlands ... 12
3.1 Existing approaches on different spatial scales ... 12
3.2 Objective of damage evaluation ... 12
3.3 Damage categories considered ... 12
3.4 Description of methods used for damage evaluation... 13
3.5 Shortcomings, Uncertainties, Improvements & Comments ... 16
4. Methods of Flood Damage Evaluation in the Czech Republic ... 17
4.1 Existing approaches on different spatial scales ... 17
4.2 Objective of damage evaluation ... 17
4.3 Damage categories considered ... 18
4.4 Description of methods used for damage evaluation... 19
4.5 Integration in benefit-cost analysis... 24
4.6 Shortcomings, Uncertainties, Improvements & Comments ... 24
5. Methods of Flood Damage Evaluation in Germany... 25
5.1 North Rhine-Westphalia ... 26
5.1.1 Existing approaches on different spatial scales... 26
5.1.2 Objective of damage evaluation... 26
5.1.3 Damage categories considered ... 27
5.1.4 Description of methods used for damage evaluation ... 28
5.1.5 Integration in benefit-cost analysis ... 29
5.1.6 Shortcomings, Uncertainties, Improvements & Comments... 29
5.2 Schleswig-Holstein... 30
5.2.1 Existing approaches on different spatial scales... 30
5.2.2 Objective of damage evaluation... 30
5.2.3 Damage categories considered ... 31
5.2.4 Description of methods used for damage evaluation ... 32
5.2.5 Shortcomings, Uncertainties, Improvements & Comments... 33
5.3 Saxony ... 35
5.3.1 Existing approaches and their objective... 35
5.3.2 Damage categories considered ... 36
5.3.3 Description of methods used for damage evaluation and their integration in benefit-cost analysis... 37
5.3.4 Shortcomings, Uncertainties, Improvements & Comments... 39
5.4 Saxony-Anhalt ... 40
5.4.1 Existing approaches on different spatial scales... 40
5.4.2 Objective of damage evaluation... 40
6. Conclusions ... 42
7. References ... 43
7.1 Country study England ... 43
7.2 Country study the Netherlands ... 44
7.3 Country study Czech Republic ... 44
7.4 Country study Germany... 45
Tables
Table 2.1: Damage categories considered (England) 7
Table 3.1: Damage categories considered in the Netherlands 13
Table 3.2: Categorisation of damage functions in the Standard Method 14
Table 3.3: Standard Method: damage categories, units, maximum damage amounts, damage
functions used and land use data sources (for low frequency flooded areas) 15
Table 4.1: Damage categories considered in the Czech Republic 19
Table 5.1: Damage categories considered in North Rhine-Westphalia 27
Table 5.2: Damage categories considered in Schleswig-Holstein 31
Table 5.3: Damage categories considered in Saxony 36
Table 5.4: Specific asset values in Saxony 37
Table 5.5: Depth-damage functions used in Saxony 38
Figures
Figure 2.1: Absolute damage functions for different residential house types (sector mean) 8
Figure 4.1: Zabaged-data: example from Decin 20
Figure 4.2: RSO address point data: example from Decin 20
Figure 4.3: Orthophoto: example from Decin 21
Figure 4.4: UPD town data: example from Decin 21
Figure 4.5: Damage to farm production according to month of flood occurrence 23
1.
Introduction
This Report is the first deliverable of task 9 in FLOODsite. It summarises both the outcome of a literature survey on flood damage evaluation methods in selected EU countries and the major results of complementary expert interviews. The overall objective is to identify the methodological diversity regarding the practical application of flood damage evaluation methods in EU countries, which are known to have a leading position in this field. The selected countries for the study are England and the Netherlands, which both have a long tradition of flood damage analysis, as well as the Czech Republic and Germany, which started much later with the practical application of flood damage evaluation. The results of this report are an important prerequisite for the major deliverable of task 9, which aims, among others, at proposing harmonised state-of-the-art methods and principles for flood damage analysis in EU countries.
Following a thorough literature survey nine interviews with national experts, who are responsible for the application of flood damage evaluation in their country, were carried out between October 2004 and June 2005: three interviews in England, one in the Netherlands, one in the Czech Republic and one interview in each of the German federal states of North Rhine-Westphalia, Schleswig-Holstein, Saxony, and Saxony-Anhalt. The following country reports summarise the major findings of the interviews and the literature survey. Each report follows – although not strictly – the same structure. In the beginning a short overview of the existing and applied approaches of flood damage evaluation is given. After that the objectives of damage evaluation are described and the damage categories considered are listed. The main part is the description of the methods used for damage evaluation. Finally, the implementation in benefit-cost analysis – if existing – is explained and comments on shortcomings, uncertainties and further improvements of the methods are given. We start with the country report for England, because flood damage analyses have a long tradition there and, in addition to this, England (and Wales) hold an authority and leadership position in this field. The next country discussed is the Netherlands. Since large regions of this coastal country are positioned below sea level, flood protection policy has a long tradition there. Although flood protection in the Netherlands has always been based on high safety standards, great efforts have been made to develop a new and standardised damage evaluation approach. The Czech Republic can be regarded as a leading EU accession country, which actively started with the practical application of flood damage analysis after the floods in 1997 and 2002. Finally, the country report on Germany summarises the different methods used in four selected federal states.
2.
Methods of Flood Damage Evaluation in England
Sources of information:
• Interview with Edmund Penning-Rowsell, FHRC, Enfield, 15.3.2005 (referred to as Penning-Rowsell 2005 in the following text)
• Interview with Jon Wicks, Halcrow Group, Swindon, 16.3.2005 (Wicks 2005)
• Interview with David Richardson, Kevin Andrews (DEFRA) & Bill Watts (Environment Agency), London, 17.3.2005 (Richardson et al 2005)
• Published and unpublished literature as listed in the reference list of chapter 7.1
2.1 Existing
approaches
on different spatial scales
In England (and Wales) there is a long history of developing and applying methods of flood damage evaluation. Since the 1970s a well developed system of methods for evaluating flood risks and damages on different spatial levels evolved, which is in the process of continuous improvement (Hall et al. 2003c). E.g., the research project RASP (Risk Assessment for Flood and Coastal Defence for Strategic Planning; DEFRA & EA 2003a; www.rasp-project.net) is currently trying to develop a consistent, tiered methodology for flood risk assessment.
The following listing can only give a rough overview of the methods used for damage evaluation on the different spatial scales:
• On the national level the National Appraisal of Assets at Risk (NAAR) was carried out for England and Wales (DEFRA 2001). This method has been further improved by the RASP high level method (Hall et al. 2003a; Sayers et al 2002). This improved method has been used for the
National Flood Risk Assessment (NaFRA), a follow-up of NAAR, and was also applied for
Foresight Future Flooding (Office of Science and Technology 2004; Hall et al. 2003b). The latter study aims at an evaluation of the development of flood risks in the next 100 years in the context of different future development scenarios.
• On the regional level damage evaluation is carried out for Catchment Flood Management Plans
(CFMP; EA 2004) and Shoreline Management Plans (SMP). While there are already numerous
SMP, CFMP are still in a pilot phase and only a few CFMP exist at present. Halcrow Group developed the ArcView-based Software MDSF (Modelling and Decision Support Framework; www.mdsf.co.uk; DEFRA et al. 2004a,b) mainly for CFMP to provide a unified approach for the evaluation of economic and social impacts of flooding.
• On an intermediate level between CFMP and detailed project appraisals two projects on the
Thames River are to be mentioned which are both not yet completely finished: The Lower Thames Strategy Study (EA 2005) and the Thames Estuary 2100 Study.
• On the local level pre-feasibility and feasibility studies have to be carried out for each scheme for
which governmental funding (grant aid) is requested. The DEFRA guidance for the procedures of these project appraisals are laid down in the Flood and Coastal Defence Project Appraisal Guidance-series (FCDPAG) of which the third part Economic Appraisal (DEFRA 1999) is the one mainly dealing with flood damage.
• In almost all levels standard damage data developed by the Flood Hazard Research Centre (FHRC, Middlesex University) is used for damage evaluation. This data has been published since 1977 starting with the Blue Manual (Penning-Rowsell & Chatterton 1977) mostly dealing with direct, tangible damage. The Red Manual (Parker et al. 1987) added more data on indirect losses and the Yellow Manual (Penning-Rowsell et al. 1992) focused on coastal erosion and flooding.
The newest and updated version of these manuals is the Multi-Coloured Manual (MCM;
Penning-Rowsell et al. 2003). FHRC also developed a FORTRAN-based software for the calculation of damages called ESTDAM, which is not GIS-based. ESTDAM is used for example within the Lower Thames study, but it is not – as one interview partner mentioned (Wicks 2005) – a standard in England for the calculation of damage as is the depth-damage data from the
MCM. For example within the MDSF software-package another software for the calculation of damages, called Damage Calculator, is used.
2.2 Objective of damage evaluation
Nearly all expenditure for flood defence in England comes directly or indirectly from central
government funding (grant aid; Green 2003). The Department for Environment, Food and Rural
Affairs (DEFRA) has the overall policy responsibility for flood defence in England, whereas the Environment Agency (EA) has the operational responsibility (Hall et al. 2003c). Both DEFRA and EA have the aim to get the most efficient use of these public investments (DEFRA 1999), and therefore it is mandatory to carry out project appraisals to evaluate the most efficient flood defence scheme to receive grant aid. The economic efficiency is measured in terms of the benefit-cost ratio which is a significant criterion for decision making in flood protection, though guidance encourages appraisers to ensure that non-costed impacts are also taken fully into account.
There are also standards of protection for different “land use bands” given by DEFRA (1999), but these are only indicative standards with a proposed range of service standard. That means that only if the option with the best benefit-cost ratio provides a lower protection than the lower boundary of the indicative standard range, the next option with a higher protection level might be chosen.
DEFRA’s prioritisation system for filtering projects for more detailed appraisals also considers other factors other than the pure monetary benefit-cost ratio. In the context of a multi-criteria score system the number of people affected and the habitat area protected are also taken into account (see Penning-Rowsell et al. 2003). But it can be summarized that the benefits of flood protection derived from damage evaluation play the most important role for decision making.
Therefore a hierarchical system of damage and risk analysis has been developed over the last years to provide decision support for management levels at different spatial scales (see Hall et al. 2003, Penning-Rowsell et al. 2003). The assessment on the national level like NAAR, NaFRA and FORESIGHT is used to provide a monitoring of risks and financial needs and to support long-term expenditure planning and allocation of financial resources. CFMP and SMP provide decision support on a catchment level and, when they are fully developed, will have a role in prioritising areas for project development. Pre-feasibility studies aim at the sub-catchment level and try to identify the need for further, more detailed investigations. Eventually, on the local level, different scheme options are compared in feasibility studies in order to identify the best flood defence option or policy.
2.3 Damage categories considered
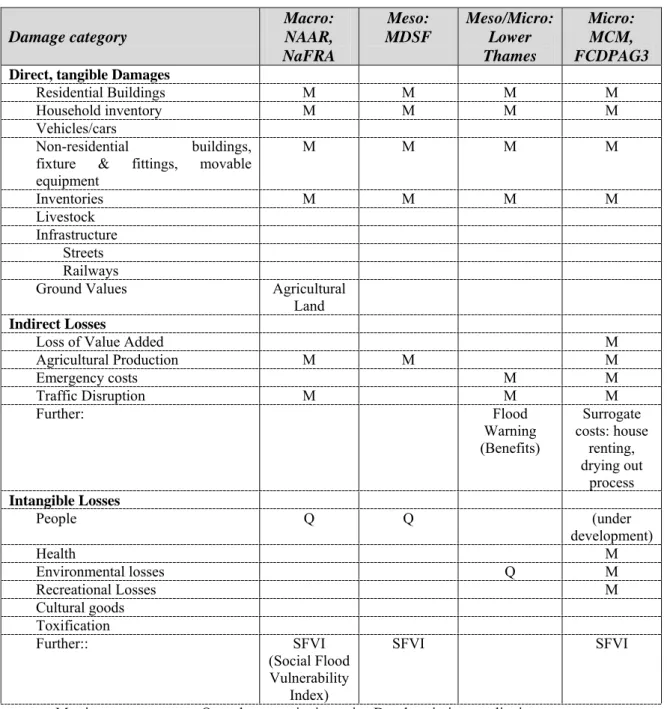
The damage categories or categories of valuables considered in four selected approaches are shown in Table 2.1.
The MCM provides methods for the quantification of many damage categories in monetary terms, not only for direct tangible damage, but also for indirect and some intangible losses. However, as was mentioned in one of the interviews (Wicks 2005), the focus of project appraisal often lies on direct tangible damage, although MCM and the FCDPAG3 are giving guidance for a whole range of damage categories. That means that if a scheme can be justified only by direct tangible benefits, other evaluation methods like the assessment of intangibles are not carried out because of the greater effort required for such examinations.
Nevertheless, there was just recently a supplementary note on the FCDPAG3 concerning a simplified incorporation of health impacts into economic appraisals in monetary terms (DEFRA 2004). The approximate average value of 200 British Pounds per year and household was derived from a detailed survey and it was recommended to use this average value in further studies (DEFRA & EA 2004).
Jon Wicks from Halcrow also mentioned in the interview that a simple method for the estimation of loss of life has been developed for the Thames Estuary Study. Furthermore, there is a research project funded by DEFRA and EA (2003c), which attempts to develop a method for the estimation of flood risks to people (including flood deaths). This is not implemented yet but it is intended to incorporate a methodology into future guidance (Richardson 2005).
At all spatial levels there are also examples for the use of the Social Flood Vulnerabilty Index (SFVI) as a measure for the coping capacity of the flood affected population. This index was developed by FHRC for CFMP at first (Tapsell et al. 2002) including indicators for vulnerable groups and persons like elderly people, lone parents as well as persons with pre-existing health and financial deprivation problems.
Table 2.1: Damage categories considered (England)
Damage category Macro: NAAR, NaFRA Meso: MDSF Meso/Micro: Lower Thames Micro: MCM, FCDPAG3
Direct, tangible Damages
Residential Buildings M M M M
Household inventory M M M M
Vehicles/cars
Non-residential buildings, fixture & fittings, movable equipment M M M M Inventories M M M M Livestock Infrastructure Streets Railways
Ground Values Agricultural Land
Indirect Losses
Loss of Value Added M
Agricultural Production M M M Emergency costs M M Traffic Disruption M M M Further: Flood Warning (Benefits) Surrogate costs: house renting, drying out process Intangible Losses People Q Q (under development) Health M Environmental losses Q M Recreational Losses M Cultural goods Toxification Further:: SFVI (Social Flood Vulnerability Index) SFVI SFVI
M = in monetary terms, Q = other quantitative units, D = descriptive, qualitative assessment
Although a large number of damage categories are considered, direct damage to infrastructure like streets and railway lines are not included. Only losses due to traffic disruption are estimated and there is also some consideration of highway repair costs in the emergency response allowance (Richardson
2005). Damage to cars or other motor vehicles is also not included. Richardson mentions the difficulty estimating damage rates for cars due to their mobility. For example the amount of damage sustained in a supermarket car park would be highly dependent on the time of day and day of the week when the flood struck as well as the warning time provided. According to Richardson, it is usually assumed that most damage to easily moveable property, such as cars, can be avoided by good flood warning and precautionary road closures hence the emphasis on evaluating delays and diversions. Assuming such damages as a benefit of both warning and alleviation schemes would be double counting.
2.4 Description of methods used for damage evaluation
As already mentioned above, the damage data of the Multi-Coloured Manual (MCM) builds the basis for damage evaluation at almost all levels, particularly regarding the damages to residential and non-residential properties.
The procedure for the derivation of these damage functions is the following. Regarding residential
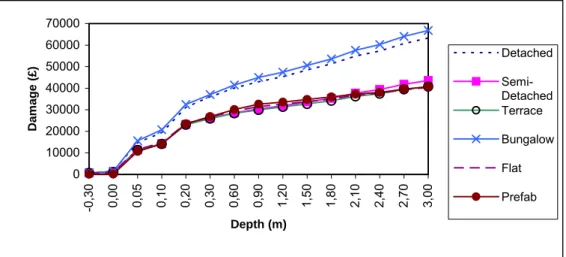
properties, at first a classification is carried out on type, age and social status. After that a typical inventory is compiled for each of these altogether 100 types. The depreciated value of the complete building structure inclusive its inventories is then determined according to replacement costs and market prices. On the basis of the assessment of loss adjusters the susceptibility of these assets to inundation depth is then assessed and finally absolute depth-damage functions are derived. Moreover, long and short flood durations are differentiated. Fig. 2.1 shows the damage functions for different types of houses.
Figure 2.1: Absolute damage functions for different residential house types (sector mean)
Source: Penning-Rowsell et al. 2003
Regarding non-residential properties, the classification of properties for large scale studies is taken from the focus database, a national property database. To derive damage functions for these different types of properties, interviews were carried out at a large number of firms to estimate, firstly, the approximate value of assets at risk in the different sectors and, secondly, the susceptibility of the respective properties. Unlike the damage functions for residential properties, these damage functions do not reflect absolute damages per property but per square meter of commercial property of a certain sector. At the detailed level of scheme appraisal it is recommended that further investigations of the damage potential for particular industrial or commercial properties is undertaken where these are likely to be significant in the overall evaluation.
This standard depth-damage data is used for damage evaluation on all spatial levels. However, the full level of detail, i.e. differentiation of this depth-damage data is not always used. It depends on the scale and the objective of a study and how detailed land use information is evaluated.
0 10000 20000 30000 40000 50000 60000 70000 -0 ,3 0 0, 00 0, 05 0, 10 0, 20 0, 30 0, 60 0, 90 1, 20 1, 50 1, 80 2, 10 2, 40 2, 70 3, 00 Depth (m) Dam a g e (£) Detached Semi-Detached Terrace Bungalow Flat Prefab
Regarding land use data for properties for large scale studies at national, regional or catchment scale,
two important secondary sources exist in the UK: The AddressPoint database, which contains the location of every property, and the Focus database for non-residential properties, which includes information about the type of property (for example, residential, high street shop, etc) and its rateable value. Merging these two sources Halcrow created a database which includes all properties within floodplains in England and Wales (National Property Dataset). For each property category an average ground floor area is assumed (DEFRA et al. 2004b).
Within detailed project appraisals the whole level of detail of the standard damage data from FHRC is used. That means that in addition to the secondary land use data mentioned above it is necessary to carry out field surveys to evaluate the type and age of residential properties or the ground floor area of non-residential properties. Furthermore the threshold level, i.e. the water level at which water runs into the building, is estimated for every property in order to be able to determine inundation depth as exactly as possible. The social class of residential properties, however, is not determined by field surveys but from census data, where the distribution of households over four social classes is given for every enumeration district (approx. 150 households).
Within pre-feasibility studies and CFMP, however, no field surveys are carried out, i.e. only the above mentioned secondary sources are used to identify the land use. Correspondingly, only a sector average damage function can be used for all residential properties. Regarding non-residential properties, at least damage functions for a two-digit land use code can be used. According to Mr. Wicks, however, average ground floor areas for buildings have to be used. For the determination of the elevation of properties a Digital Terrain Model (LIDAR) may be used.
At the national level, at least regarding the NAAR (DEFRA 2001) no depth-damage functions are applied, because only inundation areas but no inundation depths are evaluated in this study. For the loss estimation so called “weighted average annual damages” are used. This average damage for properties is based on the assumption of an average depth of flooding for a range of return periods derived from empirical flood data (see Penning-Rowsell et al. 2003). While in the NAAR only a differentiation between residential and non-residential property is made, the newer NaFRA based on the RASP high level method (Sayers et al. 2002) is implementing the standard damage data (sector
averages) of the Multi-Coloured Manual at the same level of detail as in CFMP. This becomes
possible because the National Property Database is now available, which allows at least to distinguish between different types of non-residential properties.
While the evaluation of direct tangible damage builds the core of most damage evaluation studies, methods for the assessment of indirect or intangible losses are also described in the MCM and in the FCDPAG3 (DEFRA 1999).
The costs of emergency services during floods as an indirect loss are analysed by FHRC (Penning-Rowsell et al. 2003). As a result of the analysis of the losses of the autumn 2000 floods the MCM recommends a multiplier of 1.107 for emergency costs on top of property damages.
The methods for the evaluation of losses due to road and railway traffic disruption described in the MCM are quite extensive. Therefore, it is recommended only to include these losses in appraisals if main roads or railways are affected. The calculation is mainly based on the costs of delay when alternative routes have to be used.
The indirect losses for non-residential properties can be calculated as the loss of value added during
the flood. Indeed, as it is mentioned in the FCDPAG3 (DEFRA 1999) and in the MCM (Penning-Rowsell et al. 2003) these losses are financial rather than economic, which means that there do occur losses for the affected firms but mostly not for the national economy, because nearly all production losses can be transferred to other firms. Therefore, in FCDPAG3, it is recommended to carry out such evaluations only for special circumstances, e.g. if a loss of production to other countries is likely to occur.
For the evaluation of agricultural losses the FCDPAG3 (DEFRA 1999) describes a method which considers the changes in agricultural net product. According to Richardson, this method is currently under review.
As indirect costs for residential properties the MCM (Penning-Rowsell et al. 2003) mentions the loss of own accommodation opportunities and it is recommended to use average costs of renting an equivalent home for about one month to estimate this kind of damage. Furthermore, moisture problems in buildings are listed as an indirect damage, which can be monetised by means of average costs for dehumidification.
Regarding intangible losses, health effects have recently been incorporated in the project appraisal
process. As mentioned above, an average value per household and year of 200 British Pounds is used as a basis for the calculation of the benefits of avoiding these impacts (DEFRA 2004).
One interview partner mentioned that recreational losses could only occur in a few cases as a consequence of coastal erosion (Penning-Rowsell 2005). For the evaluation of these losses it is necessary to evaluate the number of visits per year and the value of enjoyment per visit. The latter can be derived through Contingent Valuation techniques or, if only a rough estimation is required, standard values from the MCM (Penning-Rowsell et al. 2003) can be used.
There are also methods described in the MCM and FCDPAG3 for the monetary assessment of environmental losses (non-use values). The value of these sites or goods can be estimated through replacement cost, relocation costs, costs for local protection or, if a more detailed approach is required, Contingent Valuation techniques can be used. Nevertheless, it is pointed out that such a monetary valuation is only necessary if it is likely that a significant part of all losses arise from environmental losses. If not evaluated in monetary terms, environmental consequences are nevertheless taken into account in non-monetary terms by means of environmental assessment and as part of DEFRA’s prioritisation system for flood defence measures (see chapter 2.2).
Another major criterion in this prioritisation system is the number of people or households at risk. The estimation of the number of flood-affected persons is therefore an integral part of, e.g., the MDSF. However, up to now no standardised methods for the estimation of casualties due to flooding exist. As mentioned by Wicks, a rough estimation will be part of the Thames Estuary study, which is based on variables like the rise rate of inundation, the mobility of people and the effects of flood warning. Representatives of DEFRA and FHRC said that a research project dealing with this “Risk to Life”-issue is currently in process (DEFRA & EA 2003c) and, as noted above, the results will be incorporated in future guidance.
2.5 Integration in benefit-cost analysis
At all spatial levels damage evaluation is used as a part of a benefit-cost analysis. Therefore, it is not sufficient to calculate the expected damages for just one inundation scenario but for all possible floods with the whole range of probabilities of occurrence. By evaluating the damages for at least three inundation scenarios of different probabilities a loss-probability curve can be derived, showing the total risk as the area under the curve (annual average damage). For each scheme the estimated changes of the loss probability curve and consequently the risk reduction or benefit against the “do nothing” option is calculated (annual average benefit). As the whole life of a scheme has to be taken into account, future benefits have to be discounted to come to the present value of benefits which could be finally compared with the costs of each scheme (see DEFRA 1999).
2.6 Shortcomings,
Uncertainties, Improvements & Comments
Even though the methodology of risk and damage analysis is quite sophisticated in England and Wales, the interview partners were also asked about shortcomings of the existing methods and major sources for uncertainties within the results. Considering damage evaluation it was stated that the accuracy of digital elevation data was a problem but has been improved recently, so that it is now easier to estimate property thresholds and inundation depth (Wicks 2005). Regarding the standard damage data from FHRC some interview partners noted that the non-residential depth-damage data, which was restructured and simplified in the MCM (Penning-Rowsell et al. 2003) still needs further substantiation by more survey data (Penning-Rowsell 2005, Wicks 2005). It was also mentioned that it might be necessary to update the depth-damage data more frequently due to the changes in value of properties over time (Penning-Rowsell 2005). Although a lot of research is done about the integration of intangibles in England it was also stated that further improvements should be made in this area (Penning-Rowsell 2005).
As a great disadvantage of the common approach of benefit assessment it was noted that it could lead to preferential treatment of rich people (Richardson et al. 2005). As poorer people possess less expensive properties the benefit of protecting them from floods, according to the strict benefit-cost approach, is comparably low. In view of this, weighted factors are now included, as advocated by the Treasury (HM Treasury, 2003) for different social groups in appraisals to reflect socio-economic equity (DEFRA 2004). The result is that for most appraisals involving residential property, the use of average loss values for property types across all social groups is recommended (Richardson 2005). Another shortcoming may be the omission of direct damages regarding traffic infrastructure and cars. Ex-post analyses of the Elbe 2002 flood show that in particular damage to public infrastructure can be one of the most important damage categories (IKSE 2004).
Pertaining to the assessment of flood risks in the long run it was mentioned that major sources of uncertainties exist as regards crucial future development variables like impacts of climate change, policy changes, patterns of economic development, and land use changes (Richardson et al. 2005). Agreed precautionary approaches to climate change are included in current guidance and kept under review as further research results become available and likely development patterns are taken into account in larger scale studies but there is ongoing work to consider other areas of uncertainty (Richardson 2005).
Last but not least one interview partner said that until now no comparison of the results of the methods used on different levels has been executed in order to test or demonstrate their degree of accuracy (Penning-Rowsell 2005). However, a comparison of ex-ante with ex-post damage analysis results of the autumn 2000 floods has been done, revealing that ex-ante analyses are leading to quite good results.
3.
Methods of Flood Damage Evaluation in the Netherlands
Sources of information:
• Interview with Stephanie Holterman from Rijkswaterstaat, Delft, 17.2.2005 (Holterman 2005)
• Published and unpublished literature as listed in the reference list of chapter 7.2
3.1 Existing
approaches
on different spatial scales
In the Netherlands (NL) flood protection today is still very much based on high safety standards. Nevertheless, as benefit-cost aspects gained in importance over the last years, a standard method for flood damage evaluation in all 53 Dutch dike ring areas has been developed. The development of this
method is carried out by HKV consultants and TNO Bouw and supervised by the Highway and
Hydraulic Engineering Department of the Department of Public Works (Rijkswaterstaat) for the Ministry of Transport, Public Works and Water Management. The newest version is called “Standard Method 2004 – Damages and Casualties caused by Flooding” (Kok et al. 2004; Kok et al. 2002) and it is part of the Flood Management System (Hoogwater Informatie Systeem; HIS). There also exists standardised software for this method called HIS-SSM (Schade en Slachtoffers Module; Huizinga et al. 2002).
3.2 Objective of damage evaluation
Up to now there are four different safety standards for the 53 dike rings in the NL defined by law (with return periods of 1250, 2000, 4000 and 10000 years). The decision as to which safety standard is provided for which dike ring depends on the type of threat (coastal or river flooding) and on the value of the assets which are located and protected in each dike ring. There was only a rough estimation of values of elements at risk in the 1960s when safety standards were fixed by the Delta Commission (Holterman 2005). Only for one dike ring area was a benefit-cost analysis carried out.
With the development of the HIS and the Standard Method a new scientific basis for the estimation of the risk within each dike ring is provided. Up to now the results of the HIS (and HIS-SSM) are mainly used for the information of decision makers on the national and regional level, for example to show where the most severe damage could occur, or as a decision support in land use planning. In the longer run the results are also intended to be a basis for benefit-cost oriented planning of flood defence measures (Holterman 2005).
3.3 Damage categories considered
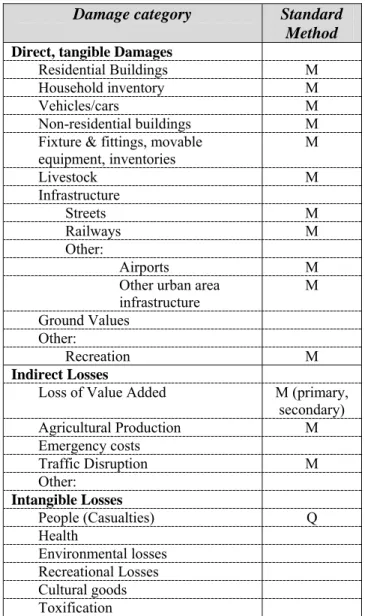
The damage categories or categories of valuables considered in the standard method are shown in Table 3.1. The standard method considers quite a lot of asset categories (see also Tab. 3.3). For most of them a differentiation is made between direct damage, primary indirect damage (which are called direct damage through business interruption in the context of the standard method) and secondary indirect damages (losses occurring outside the dike ring area). As the only intangible category the standard method tries to give an estimation of the number of casualties (see Jonkman et al. 2004; Jonkman & Vrijling 2005).
Table 3.1: Damage categories considered in the Netherlands
Damage category Standard
Method
Direct, tangible Damages
Residential Buildings M Household inventory M
Vehicles/cars M
Non-residential buildings M Fixture & fittings, movable
equipment, inventories M Livestock M Infrastructure Streets M Railways M Other: Airports M
Other urban area infrastructure M Ground Values Other: Recreation M Indirect Losses
Loss of Value Added M (primary, secondary) Agricultural Production M Emergency costs Traffic Disruption M Other: Intangible Losses People (Casualties) Q Health Environmental losses Recreational Losses Cultural goods Toxification
M = in monetary terms, Q = other quantitative units, D = descriptive, qualitative assessment
3.4 Description of methods used for damage evaluation
As an input for the Standard Method inundation characteristics derived from representative dike breach scenarios are used. For each of these scenarios an aggregate failure probability is calculated by software like PC-Ring. The inundation characteristics are calculated by a hydrodynamic model for a 100m grid. Especially inundation depth is needed for the damage evaluation. In case of residential buildings impacts of velocity and waves are also considered. Regarding casualties, three different inundation characteristics are taken into account: velocity, rise rate and inundation depth.
The amount of tangible damage for each grid cell is calculated by the formula
S in S i n i i = =
∑
α
1with ni= number of units in category i
Si= maximum damage per unit in category i
That means the three essential parts of the damage evaluation of the standard method are: firstly, the gathering of land use information, secondly the estimation of maximum damage amounts (or maximum damage potential or value) per unit of each category and thirdly the derivation of (depth-) damage functions.
• Land use data: There is a differentiation in the level of detail between the damage categories
considered (see Tab. 3.3). Some land use categories which are more or less extensively used like agricultural land etc. are included in land use units, i.e. in square meters based on CBS land use data. Linear infrastructure elements, like streets and railways are indicated in metres based on data from other official sources. Regarding households and firms a more detailed approach is followed: household property is evaluated per dwelling. Due to the use of commercial land use data (Bridgis) five dwelling types can be distinguished. Regarding companies, the number of employees in each economic sector is used to approximate the intensity of economic land use. In this context Dunn & Bradstreet data is applied. All land use information gathered is transformed in the same 100m grid used within the inundation simulation.
• Maximum damage amounts: For each of these damage categories a maximum damage amount
(i.e. the total value) for the particular unit is given, based on surveys and estimations of Briene et al. (2002; see Tab. 3.3). Basis for the calculation are prices of the year 2000. There is no regional differentiation made, although Briene et al. (2002) are specifying the range of the values.
For example, for the estimation of dwelling damage, median market values are used, adjusted by the approximate ground value. The value of average contents per dwelling of 70.000 EUR was derived in a study by www.ineas.nl, an insurance company. The amount of capital assets is calculated by the amount of depreciation over a certain period in each sector, using current replacement values. For agriculture the production value per hectare of grass- and farmland is applied as well as the market value of inventories, stables and machinery. Regarding infrastructure the value of investments on assets (e.g. streets, railways, and other forms of public infrastructure) is taken. The current value of cars per household is calculated on the basis of market values for new cars, assuming a linear depreciation. In contrast to all other damage categories a correction factor is applied to consider the fact that not all cars would be damaged in case of flooding (Briene et al. 2002). However, it is not explicitly described how this correction factor is derived.
Indirect maximum damage amounts through business interruption are evaluated on the basis of gross value added. For the secondary indirect losses outside the respective dike ring area a multiplier on this value is derived by regional input-output tables for each economic sector. For national trunk roads and railways there is also an estimation of losses due to traffic disruption.
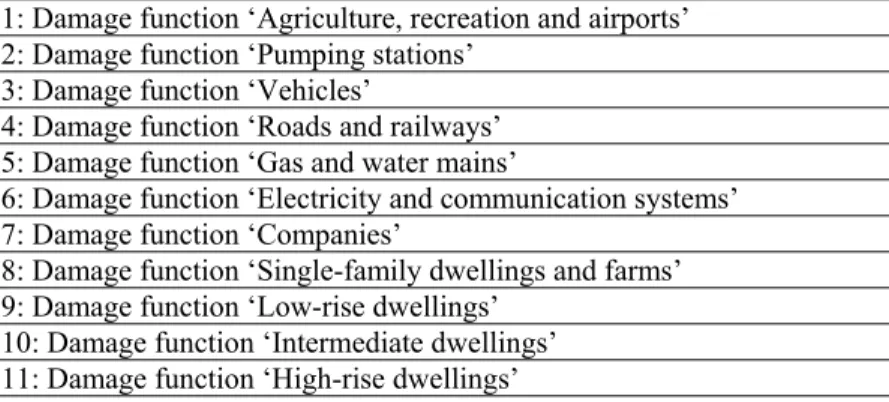
• Damage functions: Altogether eleven damage functions are derived from a study by
Vrouwenfelder (1997). The categorisation is shown in table 3.2. Basis for the development of the functions are both damage data and expert judgement (Holterman 2005). There is only a small damage database in the NL due to the fact that flooding does not occur very frequently. The damage functions are mostly depth-damage functions. Only the damage factor for dwellings additionally takes into account a critical velocity of inundation and the impact of waves caused by storms (Kok et al. 2004).
Table 3.2: Categorisation of damage functions in the Standard Method
1: Damage function ‘Agriculture, recreation and airports’ 2: Damage function ‘Pumping stations’
3: Damage function ‘Vehicles’
4: Damage function ‘Roads and railways’ 5: Damage function ‘Gas and water mains’
6: Damage function ‘Electricity and communication systems’ 7: Damage function ‘Companies’
8: Damage function ‘Single-family dwellings and farms’ 9: Damage function ‘Low-rise dwellings’
10: Damage function ‘Intermediate dwellings’ 11: Damage function ‘High-rise dwellings’
The approach described above refers to areas with a low frequency of flooding, i.e. to dike ring areas with a high protection standard. Regarding high-frequency flooded areas, i.e. less protected areas at the upper parts of some rivers, it is expected by Kok et al. (2004) that total damage amounts will be lower due to a kind of preparedness for flooding. Until further research is carried out on this topic, it is recommended in the Standard Method to include preparedness aspects by reducing the maximum damage amount by 25%.
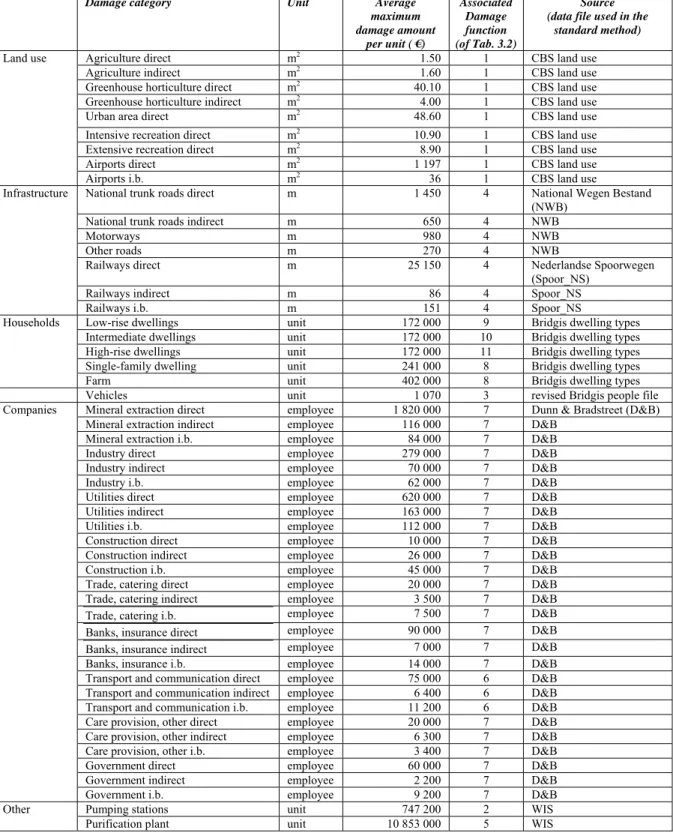
Table 3.3: Standard Method: damage categories, units, maximum damage amounts, damage functions used and land use data sources (for low frequency flooded areas)
Damage category Unit Average
maximum damage amount per unit ( €) Associated Damage function (of Tab. 3.2) Source (data file used in the
standard method)
Agriculture direct m2 1.50 1 CBS land use
Agriculture indirect m2 1.60 1 CBS land use
Greenhouse horticulture direct m2 40.10 1 CBS land use
Greenhouse horticulture indirect m2 4.00 1 CBS land use
Urban area direct m2 48.60 1 CBS land use
Intensive recreation direct m2 10.90 1 CBS land use
Extensive recreation direct m2 8.90 1 CBS land use
Airports direct m2 1 197 1 CBS land use
Land use
Airports i.b. m2 36 1 CBS land use
National trunk roads direct m 1 450 4 National Wegen Bestand
(NWB)
National trunk roads indirect m 650 4 NWB
Motorways m 980 4 NWB
Other roads m 270 4 NWB
Railways direct m 25 150 4 Nederlandse Spoorwegen
(Spoor_NS)
Railways indirect m 86 4 Spoor_NS
Infrastructure
Railways i.b. m 151 4 Spoor_NS
Low-rise dwellings unit 172 000 9 Bridgis dwelling types
Intermediate dwellings unit 172 000 10 Bridgis dwelling types
High-rise dwellings unit 172 000 11 Bridgis dwelling types
Single-family dwelling unit 241 000 8 Bridgis dwelling types
Households
Farm unit 402 000 8 Bridgis dwelling types
Vehicles unit 1 070 3 revised Bridgis people file
Mineral extraction direct employee 1 820 000 7 Dunn & Bradstreet (D&B)
Mineral extraction indirect employee 116 000 7 D&B
Mineral extraction i.b. employee 84 000 7 D&B
Industry direct employee 279 000 7 D&B
Industry indirect employee 70 000 7 D&B
Industry i.b. employee 62 000 7 D&B
Utilities direct employee 620 000 7 D&B
Utilities indirect employee 163 000 7 D&B
Utilities i.b. employee 112 000 7 D&B
Construction direct employee 10 000 7 D&B
Construction indirect employee 26 000 7 D&B
Construction i.b. employee 45 000 7 D&B
Trade, catering direct employee 20 000 7 D&B
Trade, catering indirect employee 3 500 7 D&B
Trade, catering i.b. employee 7 500 7 D&B
Banks, insurance direct employee 90 000 7 D&B
Banks, insurance indirect employee 7 000 7 D&B
Banks, insurance i.b. employee 14 000 7 D&B
Transport and communication direct employee 75 000 6 D&B
Transport and communication indirect employee 6 400 6 D&B
Transport and communication i.b. employee 11 200 6 D&B
Care provision, other direct employee 20 000 7 D&B
Care provision, other indirect employee 6 300 7 D&B
Care provision, other i.b. employee 3 400 7 D&B
Government direct employee 60 000 7 D&B
Government indirect employee 2 200 7 D&B
Companies
Government i.b. employee 9 200 7 D&B
Pumping stations unit 747 200 2 WIS
Other
Purification plant unit 10 853 000 5 WIS
Regarding the estimation of casualties as a consequence of flooding, further research has been
executed recently by Jonkman et al. (2004; Jonkman & Vrijling 2005), with the result that the method used in the Standard Method 2002 (Kok et al. 2002) could be improved for the current version (Kok et al. 2004). While the 2002 approach gives a rough estimation of the number of casualties based on information about the inundation characteristics depth and rise rate, the new approach refers to further empirical data and distinguishes three factors which might lead to death during a flood:
• High velocity (mostly in areas near the location of dike breach)
• High rise rate in combination with inundation depth (in areas with a high rise rate)
• Hypothermia, exhaustion, getting trapped (in the remaining areas)
Each grid cell is assigned to one of these three cases, so that there is only one function for each location. The number of residents for each grid cell is derived by means of commercial data (Geo-Marktprofiel BV). It is assumed that residents living in high-rise dwellings (>4 floors) will find shelter in the upper floors, so their number is removed from the dataset and not used for the estimation of casualties. The Standard Method also permits the inclusion of an evacuation factor, derived from a tool called EvacuatieCalculator developed at University of Twente.
Finally, in combination with the probabilities of the representative breach scenarios the flood risk for each grid cell can be calculated in terms of expected damages and number of casualties.
3.5 Shortcomings,
Uncertainties, Improvements & Comments
The development of a Standard Method for the whole Netherlands has the advantage that there is a method which is easy to apply and provides comparable results. On the other hand this standardisation on a meso scale of course cuts down the accuracy in some respects. As it is stated in the Standard Method (Kok et al. 2004; Briene et al 2002), it is not possible, for example, to make any regional differentiation regarding the maximum damage amounts, or to make a distinction between damages caused by salt or fresh water.
Another shortcoming refers to the fact that the same depth-damage functions used for the calculation of direct damages are also used for the estimation of indirect losses. For example, regarding losses due to business interruption, inundation depth does not seem to be the most important factor. In this case, the duration of flooding might be a more important variable to be used for damage calculations. Concerning the variability of damage potential over time Holterman stated that the maximum damage amounts are updated about every four years1, and land use data seems to be updated periodically, too.
With regard to uncertainty in the whole HIS-process of risk analysis it was expected by Holterman that the most uncertain parts are, firstly, the estimation of breach locations and corresponding probabilities and, secondly, the calculation of the number of casualties – although some improvements have been made in this field of research.
References for this country study are listed in chapter 7.2.
4.
Methods of Flood Damage Evaluation in the Czech Republic
Sources of information:
• Interview with Ladislav Satrapa and Martin Horsky from the Faculty of Civil Engeneering of the Czech Technical University in Prague, Prague 23.6.2005 (Satrapa & Horsky 2005)
• Published and unpublished literature and presentations as listed in the reference list of chapter 7.3
4.1 Existing
approaches
on different spatial scales
The practical application of flood damage analysis is a relatively new element in Czech flood policy. Its application was promoted after major flood events in 1997 and 2002. Over the last years Mr Satrapa’s group from the Czech Technical University (CTU) developed a system of three methods of damage evaluation with different levels of accuracy. All three methods are based on the same approach, using object-orientated land use information, an estimation of values of assets at risk per metre or cubic metre, mainly based on data from official statistics, and a kind of relative damage functions (Satrapa et al. 2005; Satrapa & Horsky 2005):
- “Method 3” is a detailed method for studies on a local scale. For this method site surveys are necessary. This method has been applied in three pilot studies, among others at Elbe River sites. It is also applied by Mr Drbal for the study of the International Commission for the Protection of the Elbe (IKSE).
- “Method 2” is a simplified version of method 3 for a regional scale. It relies mostly on secondary digital land use data. Site surveys are only necessary for special objects for which the secondary data is not sufficient.
- “Method 1” is a quick method for the national level, which relies completely on secondary data, but in other respects is more or less the same as method 2.
Furthermore, another method of damage evaluation is part of the Flood Analysis Toolbox (FAT) developed by the Danish engineering consultant DHI and the Morava Waterboard (Biza et al. 2001). It applies object-orientated (digitised) land use information and absolute damage functions which are derived from 1997 flood data. According to Satrapa, this approach is not as detailed as the methods mentioned above. The FAT also provides a tool for a complete benefit-cost analysis in order to assess flood protection measures.
4.2 Objective of damage evaluation
After the floods in 1997 and 2002 the responsible Ministry, the Ministry of Agriculture (before: Ministry of the Environment) sought to optimize flood protection policy through the integration of efficiency aspects. General rules for this new approach are formulated in the “Strategy of the flood preventive measures in CR” by the Ministry of Agriculture.
Up to the year 2008 several million Czech Crowns will be spent on flood protection measures, funded on the one hand by national budgets, but on the other hand also by the European Investment Bank. It is required by the European institution that its funds are used efficiently. Accordingly, an economic assessment of the planned policy measures has to be carried out. Currently about 400 measures are proposed by the responsible Czech Waterboards and other responsible institutions. Up to an early stage in the planning process the design of these measures is not influenced by criteria of economic efficiency, but is based mainly on water engineering expertise. A first assessment of these measures was mainly based on cost and water engineering criteria. For the second stage of the assessment, which is envisaged to be finished in November 2005, a complete benefit-cost analysis is carried out for about 300 measures. This study, undertaken by the group from CTU on behalf of the Ministry of Agriculture, applies Method 2 of damage evaluation as described above. The measures will be
prioritised during this assessment and, if not efficient, rejected or refined. However, the final decision on flood protection measures does not depend exclusively on benefit-cost criteria, but on the criteria people at risk and employees at risk, too. The weighing of these criteria is left to the decision makers, i.e. there is no fixed weighing system like in DEFRA’s prioritisation system in England (see chapter 2.2).
Method 1, which is the quick, more approximate method, will not be used for the assessment of single measures, but more for information about potential damage on the national level and for a justification of financial needs for flood protection. The most detailed Method 3, which is applied in three pilot areas, is used for verification and validation of the other two methods.
The results of damage and risk analysis have no explicit influence on land use planning, but are obviously considered among other aspects.
4.3 Damage categories considered
The damage categories considered in three methods are shown in Table 4.1.
The methods are mainly focussing on the evaluation of direct, tangible damage. In particular the estimation of damage to buildings is very sophisticated. All kind of building equipment (household inventories, commercial and industrial inventories, municipal equipment) is included as well as a lot of categories of technical infrastructure.
Regarding indirect losses, in particular losses to agricultural production are considered. Furthermore, consequences on the turnover of firms of other sectors are estimated (per number of employee) and flood insurance costs are assessed (at least for properties which are surveyed).
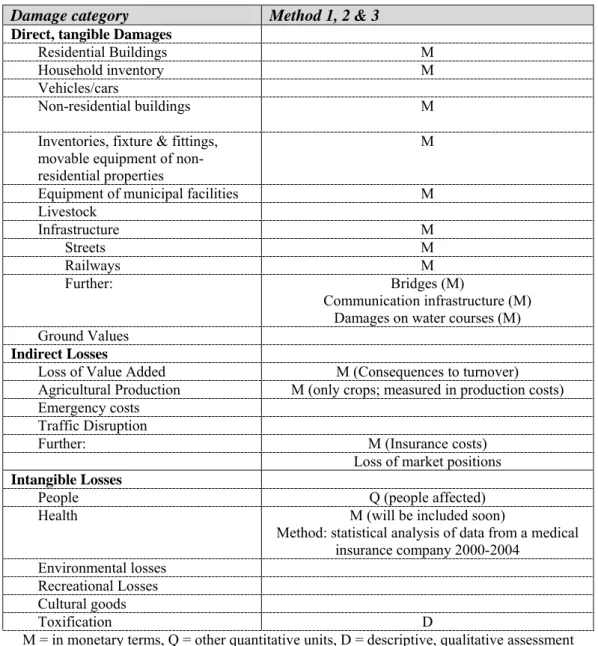
Table 4.1: Damage categories considered in the Czech Republic
Damage category Method 1, 2 & 3
Direct, tangible Damages
Residential Buildings M
Household inventory M
Vehicles/cars
Non-residential buildings M Inventories, fixture & fittings,
movable equipment of non-residential properties
M Equipment of municipal facilities M Livestock Infrastructure M Streets M Railways M Further: Bridges (M) Communication infrastructure (M) Damages on water courses (M) Ground Values
Indirect Losses
Loss of Value Added M (Consequences to turnover) Agricultural Production M (only crops; measured in production costs) Emergency costs
Traffic Disruption
Further: M (Insurance costs)
Loss of market positions
Intangible Losses
People Q (people affected)
Health M (will be included soon)
Method: statistical analysis of data from a medical insurance company 2000-2004
Environmental losses Recreational Losses Cultural goods
Toxification D
M = in monetary terms, Q = other quantitative units, D = descriptive, qualitative assessment
4.4
Description of methods used for damage evaluation
As mentioned above, the approach to damage calculation is more or less the same in all three methods. The main difference refers to the kind of data, especially land use data, used. I.e., a major
distinguishing factor of the methods refers to the aspect, whether site surveys are executed or mainly secondary sources are used.
• Zabaged, a basic digital topographic data source (see Fig. 4.1) with information on the location and size of buildings, streets, rivers etc.
Figure 4.1: Zabaged-data: example from Decin
Source: Satrapa et al. 2005
• Register of economic subjects: contains the address of each firm, its size (number of employees), branch and legal form.
• RSO address point data with the number of people and flats per address point. The small yellow dots in Fig. 4.2 each symbolise one address point.
Figure 4.2: RSO address point data: example from Decin
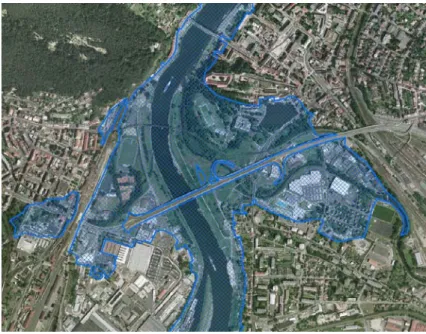
• Orthophotos (Fig. 4.3)
Figure 4.3: Orthophoto: example from Decin
Source: Satrapa et al. 2005
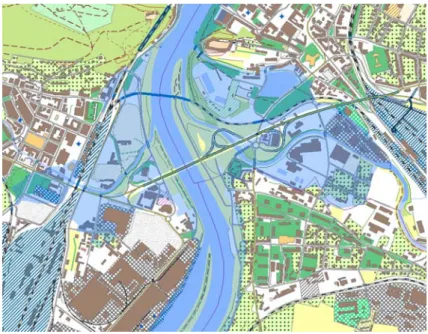
Method 3 additionally applies cadastral maps, providing detailed information of location and ground floor area of each property and building as well as its usage. Method 2 uses an aggregated land use data source for towns, called UPD (see Fig. 4.4), while Method 1 uses a more generalised version of UPD for whole districts.
Figure 4.4: UPD town data: example from Decin
The main difference between the methods is the extent of gathering detailed object-orientated land use information by site surveys. For the pilots of method 3, complete site surveys are carried out, collecting the following additional information:
• Construction material
• Number of floors
• Height of each floor
• Height of first floor above ground
• Information about cellarage
• Age of objects
• Photo documentation
Within Method 2, site surveys are only carried out for special objects and in Method 1, they are not used at all. This is reflected in the level of detail of differentiation of land use: While Method 3 distinguishes between about 200 different types of buildings (types, subtypes and construction characteristics) in Method 1 and 2 only five different types (residential buildings, industrial buildings and halls, municipal facilities, buildings and halls) are used.
The total value of elements at risk is not explicitly calculated, but more or less included in the
damage calculation theorem. For example, the value of buildings is estimated by construction costs (full replacement value) per cubic metre based on data on building components from JKSO (ÚRS Praha, a.s., Engineering and Consulting Company). By multiplication of the construction cost per cubic metre with the height of each floor affected and the ground floor area (based on land use data), the total value of the each floor is calculated as a basis for the damage calculation with relative damage functions. In Method 2 and 3 a lower and upper limit of value per cubic metre is used to reflect the diversity of different house types.
The costs of technical infrastructure per metre or square metre and the approximate value of household inventories per flat/property are also derived from official data (Czech Statistical Institute). The costs per square metre of equipment of municipal facilities stem from surveys.
The value of industrial inventories and stocks as well as annual turnover is derived from statistics and additional surveys.
The value of agricultural production per hectare is based on production costs for different crops published by the Czech Institute for Agriculture Economy (Satrapa & Horsky 2005).
For the damage calculation of buildings relative depth-damage functions are used, showing the
damage share of total construction costs. These are mainly derived synthetically, based on the assumptions of structure components per type of building, but are also refined by experience from the last floods. While for Method 3 about 200 different damage functions have been developed for each building-subtype, Method 1 & 2 are applying only five different functions for the five main building types. As already practised in the calculations for the object values, upper and lower susceptibility limits are used for the damage functions to reflect the variety within each class. In Method 1 and 2 only inundation depth is considered as a flood characteristic for damage calculation. Method 3 also includes velocity – at least if data is available – and envisages the application of depth/velocity-damage relationships.
For household goods or other kinds of inventories or equipment no depth-damage functions are used. That means that the total value of inventories is assumed to be lost in case of flooding, but only for houses and flats affected by flooding higher than 0.7 m (Satrapa & Horsky 2005).
Regarding streets, an approximate share of damage independent from inundation depth is assumed. As far as damages to the sewerage system are concerned, only clean-up costs are considered.
Referring to agricultural production, not inundation depth but the month of occurrence of the flood is used as the main indicator to estimate the proportion of loss in production (see Fig. 4.5).
Figure 4.5: Damage to farm production according to month of flood occurrence
Source: Satrapa et al. 2005
Consequently, the theorem of flood damage calculation depends on three pieces of information: the damage categories affected and included, the data on damaged objects as well as the damage functions and factors to be applied. For buildings, which form the most significant damage category, the formula for the estimation of damages to an individual building floor under water reads:
DAMAGE = H • C • %p • A [Kč] with
H [m] – Height of each floor of an individual building
C [Kč/m³] – Price of a cubic metre of a building based on JKSO data (from ÚRS, a.s); (C*H = price of one square metre of a building´s ground floor area)
A [m2] – Ground floor area of the building (GIS based)
%p [-] – Percentage of damage to building according to damage function (source: Analysis of CTU)
Costs of health problems due to flooding are the only intangible loss category, which is estimated in monetary terms. In this regard, a statistical analysis of data from a medical insurance company for the years 2000-2004 has been carried out to determine which diseases have occurred significantly more often during or after the 2002 floods. In a second step the societal costs of these diseases will be monetised. Medical experts will be asked in a survey, which therapy is provided for each of the relevant diseases and what amount of therapy costs are likely to arise. Based on the survey results the average therapy costs will be estimated in monetary terms. The study on this subject is still on-going and will be finished by the end of 2005.
1 2 3 4 5 6 7 8 9 10 11 12 cereals maize rape sunflower spinningflax potatoes sugar beet 0 10 20 30 40 50 60 70 80 90
% damage (from total production costs) month of flooding crop Damage to farm production cereals 15 15 35 50 80 80 80 5 5 15 15 15 maize 15 15 15 40 50 70 80 80 80 80 15 15 rape 50 50 60 65 90 90 10 50 50 50 50 50 sunflow er 20 20 20 40 55 70 80 80 80 80 10 10 spinningflax 15 15 15 40 50 80 80 80 80 15 15 15 potatoes 20 20 20 40 60 60 80 80 80 20 20 20 sugar beet 15 15 15 30 30 50 70 80 80 15 15 15 1 2 3 4 5 6 7 8 9 10 11 12
4.5
Integration in benefit-cost analysis
For every flood protection measure a complete benefit-cost analysis is carried out. Therefore, flood damages are calculated by the methods described above for three flood scenarios: the HQ 5, 20 and 100 events.2 From the results a loss-probability curve is created. Flood risk in terms of the annual average flood damage is calculated by applying a Monte-Carlo simulation creating a synthetic series of peak flows for 10000 years and a corresponding series of flood damages. A discount rate of 3% is applied to arrive at the present value of risk.
This risk calculation is carried out for the situation before and after implementing the respective measure. By comparing the results Risk before and Risk after the benefit of each measure can be estimated. Three benefit-cost criteria are calculated as a result of the analysis (Fosumpaur et al. 2005):
• payback period , i.e. the time period in which the benefits will exceed the costs of the measure
(costs / annual average damages).
• relative efficiency [-] = relation of discounted benefits to discounted costs (benefit / costs)
• total efficiency [$] = benefits minus costs (benefits – costs)
As described above, these efficiency-criteria will be used for the selection and prioritisation of flood protection measures.
4.6
Shortcomings, Uncertainties, Improvements & Comments
The uncertainties in the results of damage evaluation are very well integrated and documented in the methods by using minimum and maximum estimations of asset values and applying lower and upper limits of damage functions. As a result, a minimum and a maximum for the expected flood damage can be estimated for each measure considered.
Satrapa stated that results of these ex-ante flood damage calculations compared to outcomes of ex-post damage calculations for the 2002 floods showed that the ex-ante results regarding building damages and especially the damages of agricultural production were lower than the ex-post results. These deviations could of course also be due to overestimations in the ex-post analysis.
Last but not least, it was stated that for a further improvement of ex-ante damage estimation a refinement of the damage functions by empirical damage data would be helpful.
References for this country study are listed in chapter 7.3
2 According to Satrapa, for special, detailed analyses, more events are taken into account (HQ 2, 5, 10, 20, 50, 100 and Qmax).
5.
Methods of Flood Damage Evaluation in Germany
Contrary to the countries discussed above, the competencies of flood and water policy in Germany lie with the individual German federal states and not with the central government. As a consequence, given the different geographical circumstances, different levels of flood hazards and risks in each of the federal states, and also different philosophies regarding flood protection, the activities in flood protection policy and flood damage analysis vary quite significantly.
For example, there is a relatively long tradition in flood damage evaluation alongside the River Rhine in North-Rhine Westphalia. One reason for this might be the frequency and severity of floods on the River Rhine which were further fuelled in the past through intensive river regulations. Another reason refers to the enormous economic importance of the River Rhine for transportation of cargo, fishing, and the like. Since floods did not only threaten people, but also important economic activities on the Rhine, the consideration of benefits and costs of flood protection measures started relatively early in North Rhine-Westphalia. Regarding coastal protection, the state of Schleswig-Holstein is one of the leading regions considering the use of flood damage evaluation as a decisions support in flood risk management.
The federal states alongside the River Elbe – which flows through the former German Democratic Republic, some north-western states and then empties into the North Sea – were less concerned with flood protection policy. The River Elbe is much less regulated, there are larger natural flood retention areas, the river basin is flat in most of its parts and hence less flood-prone, there are less transportation activities on the river due to historical reasons (iron curtain), and the frequency of floods is much lower than in other parts of Germany. However, especially after the Elbe flood of 2002, major flood protection activities started to improve technical protection and, also, to include efficiency aspects in the decision over new measures.
In order to cope with the variety of different flood protection policies in the German federal states, four federal states were selected for expert interviews. North-Rhine Westphalia and Schleswig-Holstein were chosen to reflect the states with long traditions in flood protection policy and flood damage evaluation along the River Rhine and on the German Coast. Furthermore, Saxony and Saxony-Anhalt were included, which are two important East German riparian federal states of the River Elbe with quite different flood policy philosophies.