Issue 2015-01 | February 2015 ISBN 978-92-79-45368-7, ISSN: 2363-3468
Occasional papers by the Competition Directorate–General of the European Commission
Competition
State aid brief
State aid to European banks: returning to viability
Guillaume Adamczyk and Bernhard Windisch
In a nutshell
Since the beginning of the European financial crisis, EU countries have provided €671 billion in capital and repayable loans and €1288 billion in guarantees1 to financial institutions in distress, subject to EU State aid rules. Between 2007 and 2014, DG Competition has taken more than 450 State aid decisions, determining the restructuring or orderly resolution of 112 European banking institutions2. In this State aid brief, we evaluate the effectiveness of these restructuring measures. The results are striking:
(1) Around 25% of the entire European banking sector has been restructured under EU State aid rules. The Commission reviewed State aid granted to some of Europe's biggest financial institutions. Out of the top 20 European banks, the Commission approved aid to 12 banks, of which six were subsequently restructured, five received aid through approved aid schemes, and one was orderly liquidated.
(2) This aid has paid off. Supported and restructured banks are showing significant improvement in operational and risk indicators, and in funding and solvency positions. However, the recovery is a time-consuming process. It is only towards the end of the restructuring period that the performance of restructured banks converges towards the values of banks that did not receive aid.
(3) Results from the recent asset quality review and stress test conducted by the ECB on the main European banks confirm these findings. Most banks under State aid control successfully passed the test confirming their solvency. Ten banks under State aid restructuring that failed the exercise are only in the first couple of years of restructuring plan implementation. If the Single Supervisory Mechanism accepts all capital-generating actions implemented in 2014, only two of these banks will have a net capital shortfall, and one has announced recourse to private measures to fill the gap.
1 Total of peak amounts of outstanding guarantees issued by each Member State. 2 Figures date from December 2014.
Introduction
From 2007 onwards, the European Union faced the most serious financial crisis since its creation. The Commission played a very active role in dealing with the European sovereign crisis, and swiftly adapted the State aid framework to put in place an effective response to the financial crisis. The Commission made sure that banks were restructured or resolved under State aid rules, which preserved financial stability and the integrity of the internal market. This laid the foundation for the banking system to be able to resume its pivotal role in providing credit to the real economy.
Don't be afraid of the numbers…
Since the beginning of the financial crisis, 112 banks in the EU, representing around 30% of the EU banking system by assets, have received State aid3. The aid provided in cash expenditure
represents 5.4% of the EU's GDP in 2008 (or €671 billion in capital and loans injected into banks) and 10.3% in contingent exposure (or €1288 billion of liquidity and asset guarantees provided to banks). To overcome the risks to financial stability, almost all Member States have made State aid available. In fact, in quite a few countries, more than half of the banking sector has received State support4. The Commission approved restructuring
plans for 56 of these banks, agreed on plans for orderly wind-down for 33 banks, and reviewed the viability of 14 others without further need for a restructuring plan. As of December 2014, the Commission was in the process of assessing the viability and restructuring of 9 banks.
Has it worked?
Because of the importance of the restructured banks to the European banking system and the significant amounts of aid granted, it is essential to know how effective the EU-approved restructuring measures have been. It is critical to know whether the restructured banks are returning to long-term viability without further need for aid, and especially whether they could
3 112 banks have been examined individually with respect to State aid received.
This excludes cases receiving State aid under a governmental scheme but in amounts smaller than the relevant thresholds above which a separate notification would have been required. Note that the specific conditions for notification have evolved during the crisis.
4 Overall, 22 Member States provided aid to the financial sector. In Belgium,
Cyprus, Greece, Ireland, Netherlands, Portugal and Slovenia, more than 50% of the financial system by assets has received State support.
withstand renewed stress in the banking system. This State aid brief presents answers to these questions5.
Viability requirements under State aid rules
Three main pillars
The Commission's assessment of bank restructuring plans under the State aid crisis rules is built on three pillars6:
i. Restore long-term viability without further need for State support in the future, by restoring sustainable profitability and reducing risk; if this proves not possible, consider an orderly winding-down;
ii. Minimise the use of taxpayers' money, through appropriate burden-sharing measures, including aid remuneration and contributions by the bank, shareholders and junior creditors;
iii. Limit distortions of competition through proportionate remedies. Giving State aid to a particular bank can distort competition, as it gives the bank an advantage over its competitors.
Restoring long-term viability is key
This brief focuses on restoring long-term viability of aided, viable banks and the convergence of their performance towards that of their non-aided peers. We assess banks based on their overall performance, taking into account the full implementation of the decision including the restructuring plan, i.e. of the three pillars mentioned above.
Throughout the crisis, the Commission has stressed the importance of financial stability when implementing State aid rules. Especially at the beginning of the crisis, exceptional market conditions made it necessary to ensure that conditions attached to State aid to systemic banks would not create disturbances in the financial markets. This is why State aid rules initially permitted relatively generous conditions for granting State aid. These conditions have been progressively adapted and tightened in order to reflect changing market conditions and the evolving nature of the crisis.
Restoring viability was, and remains, a fundamental element of assessing banks in need of State support. Maintaining unviable banks on the market would further impair the financial system and monetary transmission mechanisms, and create a medium- to long-term risk to financial stability. It would also distort competition by crowding out viable banks capable of lending capital to the real economy. When a bank is assessed as unviable and unable to be turned around on the basis of a credible restructuring plan, it can receive liquidation aid in order wind down in an orderly fashion.
5 The assessment is based on all aided banks that the Commission considered
viable, i.e., capable of returning to long-term viability on the basis of their restructuring plans. It does not include those banks which received State aid to enable their orderly winding-down.
6 http://eur-lex.europa.eu/legal-content/
EN/ALL/;ELX_SESSIONID=m19STvHHQ8YFp0QCRJr35CY27hzlQv9bT3VJGHC1pLj dmKYzQ26F!-1234597632?uri=CELEX:52013XC0730(01)
What does long-term viability mean?
According to the Restructuring Communication, "long-term viability is achieved when a bank is able to cover all its costs including depreciation and financial charges and provide an appropriate return on equity, taking into account the risk profile of the bank.7" In order to minimise costs to the taxpayer, it is
essential to ensure that State aid is appropriately remunerated and eventually recovered by the State. To achieve this, banks must have the ability to generate a sustainable income and an appropriate return on equity.
The Commission examines a large number of elements in order to assess whether the bank will be able to generate sustainable income and manage costs and risks. The Commission conducts a fundamental review of the bank’s business model and identifies the root causes of the bank's problems, finds the best path to an improved or new business model, and produces a technical feasibility assessment and a stress scenario to ensure that the bank can withstand shocks. The Commission also examines the quality of the bank's risk and credit management, and looks at the bank's funding strategy and the development of its solvency position. Last but not least, the Commission reviews the overall governance structure as well as the appropriateness of remuneration and incentive structures.
The restructuring plan needs to demonstrate on the basis of all these elements that the bank can return to sustainable profitability within five years. The key elements of the new business model are laid down in legally binding commitments in a Commission decision approving State aid endorsing the restructuring plan. The proper implementation of the restructuring plan and commitments contained in it is subsequently monitored by trustees, acting as the Commission's "eyes and ears".
Performance of aided banks compared to
peers before and after receiving State aid
Here we examine the performance of viable banks that received aid following Commission-approved restructuring plans compared to the peer group of unaided banks. The comparison is done by looking at the performance of aid recipients in "year zero" when they first received aid, and the relative pre-aid and post-aid developments8. The comparison is based on key performance
indicators relating to developments in operative and risk management, overall profitability and capital and funding positions.
Adjusting costs
We assessed changes in operative management using the operating income over total assets9 and the cost-to-income ratio
as indicators. Graph 1 shows how operating income of viable aid recipients drops significantly in the period leading up to the need for state intervention. Following state intervention, there is a clear trend reversal, even though the pre-crisis levels and the comparative values for peers are not (yet) reached. Graph 2 displays the cost-to-income ratio and shows how in the year
7 Recital 13,
http://eur-lex.europa.eu/legal-content/EN/TXT/PDF/?uri=CELEX:52009XC0819(03)&from=EN.
8 For a detailed explanation of the methodology, please refer to the
methodological note in the annex.
9 The normalisation by total assets is done to make banks of different sizes
immediately preceding state intervention it increases significantly, mainly driven by important losses affecting some banks (base effect). However, the ratio is then reduced successively during the restructuring period, eventually falling to the level of peers.
Graph 1: Operating income to total assets
Graph 2: Cost to income ratio
Lowering risks
We assessed changes in balance sheet risk using the ratio of risk-weighted assets (RWA) over total assets, non-performing loan levels (NPL) and the coverage ratio10. A high RWA/Total assets
ratio indicates a higher level of risk taken per assets on the balance sheet. Following regulatory changes during the crisis period, Graph 3 shows how the value of this ratio in the banking sector has generally been decreasing, mainly due to greater requirements for liquidity buffers, which can be enhanced by investing in high-quality, low-risk liquid assets. In spite of the general persisting trend, most aided banks tend to have started out with much riskier balance sheets.
It is important to note here that these values tend to come close to the levels of peers, even though the main reduction happens already before the intervention.
10 The coverage ratio is the ratio between loan loss provisions and non-performing
loans.
The declining values for RWA/Total Assets also reflect the removal from the balance sheet of riskier assets with associated higher RWA values through mandatory deleveraging actions embedded in Commission-approved restructuring plans. Net loan balances are further reduced through provisioning as soon as NPLs are recognised in the accounts, at which point provisions have to be built11. Removing risky assets from the balance sheet
and building provisions against recognised NPLs both lead to declining values of RWA/Total Assets12.
Graph 3: Risk Weighed Assets to total Assets
NPLs (Graph 4) and coverage ratio (Graph 5) display an interesting dynamic: viable aid recipient NPL levels are initially lower than for peers, but then rise sharply, while the coverage ratio drops in the period leading up to State aid intervention. Receipt of State aid is then followed by stabilisation of NPL levels and a consistent rise in coverage ratio, bringing levels back in line with peers.
11 "Recognition" is a technical accounting term which refers to the acknowledgment
of non-performing loans in the official balance sheet. In turn, recognition requires setting aside money from profits for the expected losses from these non-performing loans. "Provisions" is the technical accounting term for that money which on the balance sheet decreases the value of the outstanding loans.
12 This argument is based on the standard approach for calculating RWA. A similar
argument, although more complex, can be made also for the Internal Rating Based approach.
Graph 4: Non-Performing Loan ratio
Graph 5: Coverage ratio
A likely explanation is that (some) banks initially tend to delay recognition of non-performing loans. Supervisory guidelines, asset quality reviews and stress test exercises in programme countries and other vulnerable Member States can speed up balance sheet recognition of NPLs. However, the increased speed of NPL recognition often does not allow for offsetting accounting provisions on NPLs to be built quickly enough, particularly in a situation of economic crisis where profits and the capital situation are under heavy pressure. The time lag in these offsetting processes leads to losses which have to be taken immediately, even though coverage ratios are still insufficient, which contributes to the need for state assistance. In order to account for the different time scales of these two processes, most State aided banks are given time to clean up their portfolios gradually, without putting financial stability at risk.
Restoring profitability
The overall profitability situation, assessed using Return on Equity (RoE), again shows the very high losses (negative RoE) suffered the year prior to the state intervention, and the cost of sorting out rising NPL levels afterwards. It is encouraging to see profits coming roughly in line with peers from the middle of the restructuring period onwards and becoming slightly positive towards the end of the observation period.
This trend shows that the restructuring plans, and the organisational, behavioural, efficiency and cost-funding measures they comprise, are supporting and driving the successful turnaround of the State aided banks.
Graph 6: Return on Equity ratio
Enhancing solvency
We assessed changes in solvency and funding using the Core Equity Tier1 Capital (CET) Ratio and the Loan-to-Deposit (LtD) ratio. Here, it is important to note that restructured banks start from a much riskier position than their peers on both accounts, solvency as well as funding. Restructured banks have a lower capital position overall to start with, and, at the same time, a much higher Loan-to-Deposit ratio, indicating greater reliance on wholesale funding. While the weaker capital position is very likely linked to profitability issues, the weaker funding position is most likely linked to the strong credit growth leading up to the crisis, very often funded via the wholesale market. The trend reversal in the Loan-to-Deposit ratio following state intervention is very positive. It is achieved by reducing excessive loan books – and related risks – compared to peers. The peak at year zero is associated with some deposit outflows which are usually reversed following the state intervention. For the capital ratio, the public capital injection usually occurs around the same time as losses related to NPLs are realised (for example through Impaired Asset Measures).
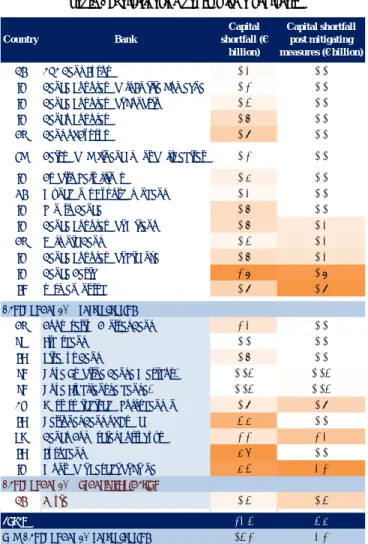
Table 1: Participating banks with a shortfall Graph 8: Core equity capital ratio
Results from the Comprehensive
Assessment confirm findings
During 2014, the European Central Bank (ECB) conducted a comprehensive assessment of 130 main European banks, consisting of an in-depth Asset Quality Review (AQR) and a Stress Test. The results were published on 26October201413.
Of 25 banks failing the comprehensive assessment, 10 were already in restructuring under State aid control
In the comprehensive assessment, 25 banks were identified with a capital shortfall either under the AQR or in the Stress Test. Of these 25 banks, ten had been subject to a restructuring decision under State aid control14. Only five of these banks displayed a
net capital shortfall after taking into account capital-generating mitigating measures implemented through private means in 2014 and approved by the SSM. Three of the five banks had implemented additional measures during 2014, which were not recognised by the SSM as mitigating measures during the comprehensive assessment, but could still reduce capital need if recognised as part of the capital raising plan. The remaining two banks have announced their intention to cover the capital shortfall by private means subject to successful implementation. Two points are important to keep in mind: (1) the fundamental prerequisite of long-term viability is the ability of the bank to finance itself at market conditions. All but two of the ten banks restructuring under State aid control have already raised the required capital through private means. (2) All ten banks restructuring under State aid control are in the early implementation phase of their restructuring plan (year two or earlier). As we have showed in section three above, restoring viability takes time - this means a failure in year one or two of the implementation is potentially less of a problem than a failure in year four or later, providing, of course, the bank does not need to resort to further State aid and is able to meet the capital requirements through private means.
13 For detailed results, please consult the ECB/SSM website:
https://www.bankingsupervision.europa.eu/banking/comprehensive/html/index.en.html 14 In addition, one bank, Dexia, has been subject to a liquidation decision and has
accordingly been freed from the obligation to raise capital.
Country Bank Capital shortfall (€ billion) Capital shortfall post mitigating measures (€ billion)
BE AXA Bank Europe 0.2 0.0
IT Banca Popolare dell'Emilia Romagna 0.1 0.0
IT Banca Popolare di Sondrio 0.3 0.0
IT Banco Popolare 0.7 0.0
CY Bank of Cyprus 0.9 0.0
FR Caisse de Refinancement de l’Habitat 0.1 0.0
IT Credito Valtellinese 0.4 0.0
DE Münchener Hypothekenbank 0.2 0.0
IT Veneto Banca 0.7 0.0
IT Banca Popolare di Milano 0.7 0.2
CY Hellenic Bank 0.3 0.2
IT Banca Popolare di Vicenza 0.7 0.2
IT Banca Carige 1.8 0.8
EI permanent tsb 0.9 0.9
CY Cooperative Central Bank 1.2 0.0
SP Liberbank 0.0 0.0
EL Piraeus Bank 0.7 0.0
SI Nova Kreditna Banka Maribor3 0.03 0.03
SI Nova Ljubljanska banka3 0.03 0.03
AT Oesterreichische Volksbanken 0.9 0.9
EL National Bank of Greece 3.4 0.0
PO Banco Comercial Português 1.1 1.2
EL Eurobank 4.6 0.0
IT Monte dei Paschi di Siena 4.3 2.1
BE Dexia 0.3 0.3
24.6 6.8
16.2 4.2
Total
o/w Banks under SA restructuring Banks under SA / restructuring
Banks under SA / orderly liquidation
Source: European Central Bank / DG Competition
Conclusion
We have shown15 that the banking restructuring plans approved
by the Commission under State aid rules have helped to save many European banks. The data shows significant improvement in operational and risk indicators, and funding and solvency positions. Only a few years after commencing a Commission-monitored restructuring scheme, recipients of aid start converging towards their peers. This suggests that in general, banks that received aid during the financial crisis have bounced back after implementing a considerable part of their restructuring plans, and can today be considered to be as healthy as ordinary bank16
15 Please note that these conclusions are made on aggregate level and cannot be
extrapolated to every individual case.
16 The authors would like to thank Sophie Bertin-Hadjiveltcheva, AnnaJarosz-Friis
Annex I - Methodological note
The Sample
(1) The Sample consists of 175 banks which fulfil at least one of the following conditions:
a. The bank is part of those banks for which supervision will be taken over by the SSM in November 2014 as published by the ECB.
b. The bank is part of the concurrent stress-test exercise as published by the EBA.
c. The bank is an independent public or private entity with a balance sheet of greater than 10bn at the last available filing in Bloomberg.
d. At least one State aid decision has been taken on this bank in the years between 2007 and 2014.
(2) Dedicated state development banks are excluded from the study.
Data items & quality
(3) Data was sourced from Bloomberg.
(4) Historical time series were taken for the years 2002 to 2013. It has to be noted that not all banks full-year results for 2013 are available via Bloomberg at the date of this publication.
(5) Data was subjected to a sensibility check and some obvious errors were corrected (for example, figures provided in billions where the base unit is millions).
(6) Various time series contain discontinuities / "holes" which can be exacerbated by, for example, banking sector consolidation activity seen, for instance, in Spain over the recent years. We did correct these, discontinuities, apart from the most obvious cases (for example, renaming of banks).
(7) All ratios in the study were calculated based on the underlying balance sheet reporting figures. Bloomberg's pre-calculated ratios were only used to cross-check with our own calculated values.
Sample aggregation
(8) The sample was separated into two main groups for the purpose of the study: banks which had received State aid as determined by at least one decision having been taken on the bank between 2007 and 2014 (State aided banks/aid recipients) and other banks headquartered in Europe (Peers). (9) Using the Commission decision as indicator for the presence of
State aid tends to – if anything – underestimate the aid provided because it will exclude State aid provided in the form of aid schemes unless the aid received under a scheme was such that it also necessitated an individual Commission approval later. This excludes in particular some banks from the aided category which received usually small amounts of capital early on in the crisis (e.g. under the French and Danish aid schemes in 2008/2009).
(10) The aggregation of data in the different groups has to contend with a number of particular issues:
a. Aggregation over a wide range of different bank sizes b. Holes and discontinuities in the data time series
c. Time series of data which can take positive and negative values (e.g. RoE)
d. For the category of State aided banks specifically, aid reception in different years
Aggregation methodology
(11) In order to address the issues pointed out in point (10), the following methodology has been developed:
a. Using only dimensionless quantities (ratios) for which banks remain comparable independent of the differences in their respective sizes.
b. Focusing on year-over-year change rates when calculating averages to exclude biases from incomplete time series in the sample.
c. Developing a shifted weighted average approach resulting in corrected averages without biases from either crossing between negative and positive values as well as incomplete time series.
d. Re-defining the time scale as relative to the year of reception of State aid.
(12) Following from this methodology, the time series for all State aided banks were re-aligned along the year when each bank received State aid – the "year 0" (e.g. Bank1 receiving aid in 2008 and Bank2 in 2012, the respective time series would be: for Bank1 year 0 (2008), and correspondingly -1 (2007), -2 (2006), etc. and 1 (2009), 2 (2010), etc., for Bank2 year 0 (2012), and correspondingly -1 (2011), -2 (2010), etc. and 1 (2013), no year 2 as no data is available for 2014 as yet). From the example, it should become clear why data is becoming more scarce for relative years >0 which is why a cut off was introduced at year 4 (2013 for banks having received aid in 2009 and 2012 for banks having received aid in 2008). This reflects the scarcity of data available for aggregation in any further points.
(13) Using these re-aligned time series, the data is aggregated using the shifted weighted average approach mentioned in (11)c. In addition, the decision was taken to use averages weighted with the total balance sheet size for all data items. This was done in order to emphasize the importance of the performance of bigger banks relative to the overall system. (14) An additional issue introduced by the re-alignment of time
series for aided banks is that Peers can no longer be aggregated correspondingly in a simple way. In order to get to a benchmark from the data for Peers, the following process has been followed:
a. Averages have been calculated on the original time series for Peers according to method (11)c.
b. In order to arrive at a value for Peers in year 0 (or -1, -2, …, 1, 2, …), a weighted average over values from different real time years has then been taken.
The weights used in this average correspond to the total balance sheet size of aided banks which had the relevant combination of real time year and relative year.
Annex II - Sample
Austria LANDESBANK BERLIN HOLDING AG BANK NEDERLANDSE GEMEENTEN
ALLG SPARKASSE OBEROESTERREI LANDESBANK HESSEN-THURINGEN COOPERATIEVE CENTRALE RAIFFE
BAWAG P.S.K. BANK FUER ARBEI LANDESBANK SAAR ING BANK NV
ERSTE GROUP BANK AG LANDESKRED BADEN-WUERTT FOER NEDERLANDSE WATERSCHAPSBANK HYPO ALPE ADRIA BANK INTL AG MUENCHENER HYPOTHEKENBANK NIBC BANK NV
HYPO TIROL BANK AG NORDDEUTSCHE LANDESBK GIROZ SNS REAAL
KOMMUNALKREDIT AUSTRIA AG NRW.BANK VAN LANSCHOT NV-CVA
OBERBANK AG OLDENBURGISCHE LANDESBANK AG Poland
OESTERREICH VOLKSBANKEN-PART PORTIGON AG ALIOR BANK SA
RAIFFEISEN ZENTRALBNK-PART A SPARKASSE KOELNBONN BANK BPH SA
RAIFFEISENLANDESBANK NIEDERO VOLKSWAGEN BANK GMBH BANK HANDLOWY W WARSZAWIE SA RAIFFEISEN-LANDESBANK STEIER WGZ-BANK AG WESTDEUTSCHE GEN BANK OCHRONY SRODOWISKA SA RAIFFEISENLANDESBK OBEROESTE WUESTENROT & WUERTTEMBERG GETIN NOBLE BANK SA
Belgium Greece PKO BANK POLSKI SA
AXA BANK BELGIUM SA AGRICULTURAL BANK OF GREECE Portugal
BELFIUS BANK & INSURANCE ALPHA BANK A.E. BANCO BPI SA.- REG SHS
DEXIA SA ATTICA BANK SA BANCO COMERCIAL PORTUGUES-R
KBC GROEP NV EMPORIKI BANK OF GREECE SA BANCO ESPIRITO SANTO-REG
Bulgaria EUROBANK ERGASIAS SA BANIF - BANCO INTERNACIONAL
CB FIRST INVESTMENT BANK AD NATIONAL BANK OF GREECE CAIXA ECONOMICA MONTEPIO GER CORPORATE COMMERCIAL BANK AD PIRAEUS BANK S.A CAIXA GERAL DE DEPOSITOS-REG
Cyprus PROTON BANK SA Spain
BANK OF CYPRUS PUBLIC CO LTD TT HELLENIC POSTBANK S.A. BANCO BILBAO VIZCAYA ARGENTA
CYPRUS POPULAR BANK PUBLIC C Hungaria BANCO DE SABADELL SA
HELLENIC BANK PUBLIC CO LTD FHB MORTGAGE BANK PLC BANCO DE VALENCIA SA
Denmark OTP BANK PLC BANCO GALLEGO SA
AMAGERBANKEN A/S Ireland BANCO MARE NOSTRUM SA
DANSKE BANK A/S ALLIED IRISH BANKS PLC BANCO POPULAR ESPANOL
FIH ERHVERVSBANK A/S BANK OF IRELAND BANCO SANTANDER SA
FIONIA HOLDING A/S IRISH BANK RESOLUTION CO/OLD BANKIA SA
HAANDVAERKERBANKEN-NEW PERMANENT TSB GROUP HOLDINGS BANKINTER SA
JYSKE BANK-REG ULSTER BANK IRELAND LTD CAJA DE AHORROS DEL MEDITERR
NYKREDIT BANK AS Italy CAJA ESPANA DE INVERSIONES S
ROSKILDE BANK BANCA CARIGE SPA CAJA ZARAGOZA ARAGON Y RIOJA
SPAR NORD BANK A/S BANCA DELLE MARCHE CAJAS RURALES UNIDAS SCC
VESTJYSK BANK A/S BANCA MONTE DEI PASCHI SIENA CATALUNYA BANC SA
Finland BANCA POPOL EMILIA ROMAGNA KUTXABANK SA
AKTIA BANK OYJ BANCA POPOLARE DELL'ETRURIA LA CAIXA
NORDEA BANK FINLAND ABP BANCA POPOLARE DI BARI SCRL LIBERBANK SA
OP-POHJOLA OSK BANCA POPOLARE DI MILANO NCG BANCO SA
France BANCA POPOLARE DI SONDRIO UNICAJA
BANQUE PSA FINANCE SA BANCA POPOLARE DI VICENZA Slovenia
BNP PARIBAS BANCO POPOLARE SC ABANKA VIPA DD
CAISSE REFINANCEMENT L'HABIT BCC ROMA BANKA CELJE
CREDIT AGRICOLE SA CASSA DEPOSITI & PRESTITI NOVA KREDITNA BANKA MARIBOR CREDIT IMMOBILIER DE FRANCE CREDITO EMILIANO SPA NOVA LJUBLJANSKA BANKA DD
CREDIT MUTUEL GROUP CREDITO VALTELLINESE SCARL PROBANKA D.D.-PFD
GROUPE BPCE ICCREA BANCA SPA SID BANKA DD LJUBLIJANA
LA BANQUE POSTALE INTESA SANPAOLO Sweden
SOCIETE DE FINANCEMENT LOCAL MEDIOBANCA SPA KOMMUNINVEST I SVERIGE
SOCIETE GENERALE SA UBI BANCA SCPA LANSFORSAKRINGAR BANK AB
Germany UNICREDIT SPA NORDEA BANK AB
AAREAL BANK AG UNIPOL BANCA SPA SKANDINAVISKA ENSKILDA BAN-A
BAYERISCHE LANDESBANK VENETO BANCA SCPA SVENSKA HANDELSBANKEN-A SHS
COMMERZBANK AG Lithuania SWEDBANK AB - A SHARES
DEKABANK DEUTSCHE GIROZENTRA UKIO BANKAS United Kingdom
DEUTSCHE APOTHEKER- UND AERZ Luxembourg BARCLAYS PLC
DEUTSCHE BANK AG-REGISTERED BANQUE ET CAISSE D'EPARGNE D BRADFORD & BINGLEY PLC DZ BANK AG DEUTSCHE ZENTRAL- BANQUE INTERNATIONALE A LUXE HSBC HOLDINGS PLC HAMBURGER SPARKASSE AG ESPIRITO SANTO FINL GROUP SA LLOYDS BANKING GROUP PLC
HSH NORDBANK AG KREDIETBANK SA LUXEMBOURGEOI NRAM PLC
HYPO REAL ESTATE HOLDING AG Malta ROYAL BANK OF SCOTLAND GROUP
IKB DEUT INDUSTRIEBANK AG BANK OF VALLETTA PLC SKIPTON BUILDING SOCIETY
KFW Netherlands STANDARD BANK PLC
KREISSPARKASSE KOELN ABN AMRO BANK NV STANDARD CHARTERED PLC