CONTRIBUTION OF EDUCATION TO INFANT
AND UNDER-FIVE MORTALITY DISPARITIES
AMONG CASTE GROUPS IN INDIA
WORKING
PAPERS
VIENNA INSTITUTE OF DEMOGRAPHY
03/2018
Vienna Institute of Demography Austrian Academy of Sciences
Welthandelsplatz 2, Level 2 | 1020 Wien, Österreich [email protected] | www.oeaw.ac.at/vid
JAYANTA KUMAR BORA, RAJESH RAUSHAN AND
WOLFGANG LUTZ
VID – VIENNA INSTITUTE OF DEMOGRAPHY WWW .OEA W .A C. ATAbstract
The level of infant and under-five mortality is high among scheduled castes (SCs) and scheduled tribes (STs) in India. This study intends to quantify the contribution of education in explaining the gap in infant and under-five mortality between SCs/STs and non-SC/ST population in India with a special focus on the effect of maternal education. We used data from three rounds of National Family Health Survey (NFHS): 1992–93, 1998–99 and 2005–06. The synthetic cohort probability approach using full birth histories was used to estimate childhood mortality. We performed binary logistic regression analysis to examine the association of infant mortality (IM) and under-five mortality (U5M) with maternal education and selected other covariates. Further, we applied Fairlie's decomposition technique to understand the relative contribution of maternal education and other covariates on IM and U5M risk between the caste groups. The IM rate (IMR) among children born to illiterate mothers is about 3 times higher than those born to mothers with higher education across all caste groups. Similarly, the U5M rate (U5MR) is 5 times higher among ST population and 3 times higher among SC population during the 14-year observation period (1992–2006). The proportions of secondary and higher educated SC and ST mothers are relatively lower than among non-SC/ST mothers. The regression analysis shows that mother’s education has a statistically significant effect on reducing IM and U5M. A number of socio-economic covariates are found associated with IM and U5M; such as father’s education, mother’s age at first birth, mother’s work status, household wealth, exposure to media and socio-economic empowerment of the mother. A decomposition analysis shows that more than 90 percent of the gap in IM and U5M between social groups is explained by the differences in the distribution of maternal education and household wealth. The findings of this study emphasise the need to provide education to disadvantaged girls and health counselling to women, particularly among SC/STs with more focus on backward regions or states, to further reduce IM and U5M in India.
Keywords
Infant and under-five mortality, NFHS, scheduled tribe, scheduled caste, maternal education.
Authors
Jayanta Kumar Bora (corresponding author), Wittgenstein Centre for Demography and Global Human Capital (IIASA, VID/ÖAW, WU), Vienna University of Economics and Business, Vienna, Austria and Indian Institute of Dalit Studies (IIDS), New Delhi, India. Email: [email protected]
2
Rajesh Raushan, Indian Institute of Dalit Studies (IIDS), New Delhi, India. Email: [email protected]
Wolfgang Lutz, Wittgenstein Centre for Demography and Global Human Capital (IIASA, VID/ÖAW, WU), Austria. Email: [email protected]
3
Contribution of Education to Infant and Under-Five
Mortality Disparities among Caste Groups in India
Jayanta Kumar Bora, Rajesh Raushan, Wolfgang Lutz
1.
Introduction
Childhood mortality continues to be a major public health concern particularly in low- and middle-income countries (LMICs) where it is mostly concentrated and keeps occurring in large numbers. Within LMICs, India’s contribution to infant and under-five mortality is the highest.Within India, the burden of children dying under five years of age is disproportionately carried by socially disadvantaged groups. Previous studies in developing countries showed that parental education played a crucial role in improving the survival of children (Caldwell and McDonald, 1982; Cochrane et al., 1982). The aim of the present study is to examine the role of education on infant and under-five mortality disparities among caste groups in India.
There is a well-established body of literature documenting maternal education as a significant determinant of child health outcome (Bicego and Boerma, 1993, 1990; Caldwell, 1979; Choudhury, 2015; Cleland et al., 1991; Cleland and Van Ginneken, 1988; Gakidou et al., 2010; Govindasamy and Ramesh, 1997; Hatt and Waters, 2006; Pamuk et al., 2011; Vikram et al., 2012, Alemayehu Azeze and Huang, 2014; Arnold et al., 1998; Cleland and Van Ginneken, 1988; Desai and Alva, 1998; Frost et al., 2005; Grépin and Bharadwaj, 2015; Jain, 1985; Keats, 2014; Mohanty, 2011; Po and Subramanian, 2011). These studies discuss several reasons for the negative association between maternal education and infant and child mortality. First, it was found that better maternal education leads to higher use of the modern health care system (Frost et al., 2005). Second, mothers with higher education levels are more likely to take decisions on personal illness control (Basu and Stephenson, 2005; Desai and Alva, 1998) which helps prevent premature deaths (Alemayehu Azeze and Huang, 2014; Aslam and Kingdon, 2012; Frost et al., 2005; Glewwe, 1999; Webb and Block, 2004), and increases autonomy and empowerment of women with regard to health care and decision-making (Aslam and Kingdon, 2012; Choudhury, 2015; Frost et al., 2005). Finally, educated women have higher levels of physical mobility which is further associated with their uptake of antenatal care (Bloom et al., 2001) and treatment seeking for a sick child (Das Gupta, 1990).
The Indian caste system, which has existed for more than 3000 years, is a traditional system of social segregation which works on the principle of purity and pollution. Out of all the caste groups, the most disadvantaged and deprived ones are the Scheduled Castes (SCs) and Scheduled Tribes (STs), with some expansion into Other Backward Classes (OBCs) (Nayar, 2007). The SC people are the ones who used to be referred to as ‘untouchables’. According the Hindu mythology, this is the fifth category in the Varna
4
system of social classification. They are called Ati Shudras (untouchables) and were condemned to do dirty and polluting jobs. On the other hand, Scheduled Tribes are communities of people living in tribal areas (mainly forest).
SCs and STs are historically marginalised and disadvantaged social groups who are officially recognised and listed by the Indian Constitution. According to the 2011 Census of India, together they constitute 25.2 percent of the country’s total population (with SCs contributing 16.6 percent and STs 8.6 percent). The Indian Constitution has given them a special status since 1950 and provided quotas in politics, education and jobs and various other provisions such as laws to abolish practices prolonging social inequities, and development programmes specially designed to cater to their needs (Parikh, 1997). However, they continue to face multiple difficulties compared with the rest of the population (Borooah, 2005; Mitra and Singh, 2008; Van de Poel and Speybroeck, 2009), and they still show lower social and economic development indicators than rest of the population (Government of India, 2012). These people are generally exposed to poor living conditions, observe a poor diet and have limited access to health care. Consequently, children born in disadvantaged castes are facing the threat of poor health outcomes from high mortality to high malnutrition. In addition to their low socio-economic circumstances, people in disadvantaged castes experience other adverse circumstances such as caste-based discrimination which is associated with poor access to health care system in India (Baru et al., 2010). Their life expectancy is relatively low and both child and adult mortality are relatively high (Subramanian et al., 2006a); they also contribute almost 50 percent of all maternal deaths in the country, and their children are more undernourished compared to the rest of the population (UNICEF, 2011; Wax, 2010). One major reason behind this depressing health situation prevailing among SCs and STs may be the mothers’ level of educational attainment.
The association between caste and child mortality is well documented (Das et al., 2010; Dommaraju et al., 2008; Mohindra et al., 2006; Nguyen et al., 2013; Po and Subramanian, 2011; Ram et al., 2017; Sahu et al., 2015; Singh-Manoux et al., 2008; Subramanian et al., 2006a, 2006b). In general, these studies find that caste differences in infant and child mortality are substantially reduced after parental socio-economic characteristics are held constant (Ram et al., 2017). The study by Dommaraju and colleagues (2008) examines the effect of caste on child mortality and maternal health care utilisation in rural India and concluded that children belonging to lower castes have higher risks of death and women belonging to lower castes have lower rates of antenatal and delivery care utilisation than children and women belonging to upper castes. The study further suggested the need to target low-caste members in the provision of maternal and child health services. A recent study shows that children from the lower caste groups are significantly more likely than better-off caste children to die at a young age (Ram et al., 2017).
Nonetheless previous studies documented the association between the contribution of castes with child mortality. To our knowledge, no previous study has quantified the role
5
of education and other important socio-economic characteristics to examine the disparity in infant and under-five mortality by caste groups in India. In this study, we first documented the trends in infant and under-five mortality by caste groups during 1992– 2006, and then we investigated the contribution of education in explaining the average gap in infant and under-five mortality between SC/ST and non-SC/ST populations in India.
2.
Data
We used data from three rounds of Demographic Health Surveys, commonly known as National Family Health Surveys (NFHS) conducted during the years 1992–93, 1998–99 and 2005–06 in the present study. However, we did detailed analysis on the third round of the NFHS survey conducted during 2005–06 (IIPS and ORC Macro, 2007). NFHS provides information—at state and national levels—on fertility, family planning, infant and child morbidity and mortality, maternal and reproductive health, the nutritional status of women and children and the quality of health services. Multistage stratified sampling methods were used to create a sample representing individuals from all 29 states (NHFS-3) of India. In NFHS, all eligible women aged 15–49 year were asked to provide information on their complete birth histories, which included sex, month and year of birth as well as the survival status for each live birth. The information on age at death was recorded in days for children who had died in the first month of life; in months for children who had died after the first month but before completion of their second birthday, and in years for children who had died at later ages. For children who had died after their second birthday, we computed the age at death in months. Detailed information on antenatal, delivery and postnatal care for the births to eligible women which occurred during the five years preceding the 2005–2006 survey. A detailed description of the survey design of the NFHS-3 is available in the respective national reports (IIPS and ORC Macro, 2007).
3.
Methods and Measures
3.1 Outcome Variables
The outcome variable in the study is infant mortality rate (IMR) and under-five mortality rate (U5MR). We used the information on births during the last ten years preceding the survey date for both infant and under-five mortality in the analysis. IMR is defined as the probability (expressed as a rate per 1,000 live births) of dying before the first birthday and U5MR is the probability (expressed as a rate per 1,000 live births) of dying before reaching the age of five. We assigned a value of 1 if the child died and 0 if the child was alive.
6
3.2 Predictors
Caste groups: The caste group is the core predictor used in the analysis. In NFHS-2 and NFHS-3, caste/tribe is defined based on the respondent’s self-report as belonging to SCs, STs, other backward classes (OBCs) and others. In our analysis, we use SCs, STs individually and combined OBC, while other caste groups are referred to as the ‘non-SC/ST population’. However in NFHS-1, caste/tribe is categorised as SCs, STs and others.
Mother’s literacy: Mother’s literacy is measured by whether a respondent who attended primary schooling can read a whole or part of a sentence shown to her. In our study mother’s literacy is categorised as can't read, partly read and completely able to read. Mother’s and father’s education: This is categorised in 4 groups: no education (0 years), primary for 1 to 5 years of education, secondary for 6 to 12 years of education and higher for more than 12 years of education.
Other predictors used were mother’s age at the time of first child birth (<15, 15–19, 20+ yrs), sex of the child (female, male), birth order (1, 2–3, 4+), mother’s work status (not working, working at home, working away from home), wealth quintile of household (poorest, poorer, middle, richer, richest) and place of residence (rural, urban).
Region of residence: This was measured following the NFHS categorisation according to the six major geographical locations having more or less similar cultural settings: North (Jammu and Kashmir, Himachal Pradesh, Punjab, Haryana, Rajasthan, Delhi and Uttarakhand), Central (Uttar Pradesh, Madhya Pradesh and Chhattisgarh), East (Bihar, Jharkhand, West Bengal and Odisha), North-East (Arunachal Pradesh, Assam, Manipur, Meghalaya, Mizoram, Nagaland, Sikkim and Tripura), West (Gujarat, Maharashtra and Goa) and South (Andhra Pradesh, Karnataka, Kerala and Tamil Nadu).
Mothers’ media exposure: The mother’s exposure to mass media was measured by asking questions about the frequency (almost every day, at least once a week, less than once a week, not at all) at which they read newspapers or magazines, watched television or listened to the radio. Individuals who did not read newspapers or magazines, did not watch television or did not listen to the radio at least once a week were considered as ‘not regularly exposed’ to any media. The mother’s exposure to mass media in this study is taken as a dummy variable, that is, 1 if the mother listens to radio or reads newspapers or watches television at least once a week (labelled as ‘with media exposure’), and 0 if the mother does not listen to radio or does not read newspapers or does not watch television even once in a given week (labelled as ‘without media exposure’).
Women’s socio-economic empowerment: Questions were asked to married women about their decisions on four important aspects of autonomy, namely; health care, deciding on large household purchases, making purchases for daily household needs and visiting their
7
family or relatives. Four different levels of decision-making include the following: mainly you, mainly your husband, you and your husband jointly, or someone else. In this study it is included as a dummy variable and takes the value 1 if the mother has taken decisions alone in any of the four indicators (labelled as ‘takes decisions alone in the household’), and 0 if the mother has not taken decisions alone in any of those four indicators (labelled as ‘does not take decisions alone in the household’).
3.3 Statistical Analysis
Mortality estimation is carried out from a dataset with full birth histories. Full birth histories information was taken from all women aged 15–49 years surveyed in NFHS. We used a procedure developed to estimate child mortality in Demographic and Health Surveys using a synthetic cohort probability approach (Rutstein and Rojas, 2006). In that study a bivariate analysis is used to examine the differences of outcome and selected predictors between SCs, STs and non-SC/ST population. A binary logistic regression model is employed to examine the association between infant and under-five mortality with exposure variables. All exposure variables were tested for possible multicollinearity before inserting them into the binary logistic regression model.
The Blinder–Oaxaca decomposition technique (Blinder, 1973; Oaxaca, 1973) is a commonly used approach to identify and quantify the factors associated with inter-group differences in mean level of outcome. In the present study, it reveals how the differences in IM and U5M between social groups can be explained by inequalities in socio-economic status (O’Donnell et al., 2008; Wagstaff et al., 2007). This technique, however, is not appropriate if the outcome variable is binary, such as child death (Fairlie, 2005). Hence, we used an extension of the Blinder–Oaxaca technique (Fairlie, 2005) which is appropriate for binary models to decompose the gap between social groups in infant and under-five mortality risk into contributions that can be attributed to different factors. For the decomposition analysis, we used the ‘fairlie’ command available in Stata 10 or higher versions and 1000 random subsamples of non-SC/ST children to calculate their means. Since the independent contribution of each variable in the non-linear decomposition depends on the order in which the variables are introduced in the model, we randomised the order of the variables as suggested by Fairlie (2005) to get robust estimates. The decomposition method proposed by Fairlie is described in detail in the Appendix. For the decomposition analysis we combine the social group predictor SCs and STs and refer to them as ‘SCs/STs’ and the other two groups (OBC and others) are referred to as the ‘non-SC/ST population’.
We used STATA S.E. 14.0 (STATA Corp., Inc., College Station, TX) version software to carry out all the mentioned analysis in this study.
8
4.
Results
4.1 Trends in the Social Group’s Gap for Infant and Under-Five Mortality in India Figure 1 shows the trends in IMR and U5MR within the SC, ST and non-SC/ST populations for 1992–93 to 2005–06. Both IMR and U5MR are higher among SCs and STs than non-SC/ST population during 1992 to 2006. The infant mortality rate among SCs dropped to 70.5 deaths per 1000 live births in 2006 from 107.2 in 1992–93, a 34 percent decline, and for STs (76 in 2006 and 90.9 in 1992) there was a 16 percent decline. Among non-SC/STs (61.8 in 2006 and 82.2 in 1992) the decline was around 25 percent. The picture is similar for under-five mortality: among SCs, it dropped to 96.5 deaths per 1000 live births in 2006 from 149.2 in 1992–93, a 35 percent decline; for STs (111.8 in 2006 and 135.5 in 1992) the decline was 17 percent and among non-SC/STs (78.4 in 2006 and 111.6 in 1992) 30 percent. It is notable that the decline was stronger among SCs than among STs.
Figure 1: Trends in IMR and U5MR among social groups, India, 1992–2006
Source: NHFS 1,2, and 3.
Note: Authors estimated IMR and U5MR per 1000 live births for the 10-year period preceding the survey 107.2 82.9 70.5 90.9 83.8 76.0 82.2 68.7 61.8 86.3 73.0 65.0 50 60 70 80 90 100 110 120 NFHS1 (1992-1993) NFHS2 (1998-1999) NFHS3 (2005-2006) IM R ( p er 1 0 0 0 l iv e b irt h s IMR SC ST Non-SCST All 149.2 119.1 96.5 135.5 126.1 111.8 111.6 92.8 78.4 118.8 101.3 85.3 50 70 90 110 130 150 170 NFHS1 (1992-1993) NFHS2 (1998-1999) NFHS3 (2005-2006) U 5M R ( p er 1000 l iv e b ir th s) U5MR SC ST Non-SCST All
9
Table 1: Trends of infant and under-five mortality rate among social groups by mother’s education, 1992–2006, India
NFHS
rounds Social Groups
IMR/U5MR (per 1000 live births)
Level of Mother’s education
No education Primary Secondary Higher
NFHS-1 (1992–93)
SC IMR 115.8 80.8 44.0 20.7 U5MR 161.3 110.5 53.0 61.2 ST U5MR IMR 145.4 96.5 55.4 76.2 58.4 70.3 40.0 40.0 Non-SC/ST U5MR IMR 135.3 97.7 67.7 88.6 49.1 59.4 27.8 30.5 All IMR 100.5 68.2 49.1 27.9 U5MR 140.7 89.8 59.4 31.3 NFHS-2 (1998–99) SC IMR 91.2 78.3 46.2 38.3 U5MR 135.1 96.1 54.7 45.1 ST IMR 91.9 54.9 56.1 46.5 U5MR 140.4 77.5 68.6 48.1 Non-SC/ST U5MR IMR 117.4 84.4 65.5 84.5 44.5 54.4 31.1 34.4 All U5MR IMR 124.5 86.9 67.0 86.0 45.3 55.2 32.1 35.6
NFHS-3 (2005–06) SC IMR 78.5 68.2 49.2 42.7 U5MR 111.9 83.4 55.9 43.3 ST IMR 83.2 65.3 50.5 13.8 U5MR 123.9 91.1 65.8 13.8 Non-SC/ST IMR 76.3 62.5 44.9 19.7 U5MR 100.6 74.8 50.8 23.9 All U5MR IMR 77.7 63.8 45.9 21.2 106.3 77.6 52.4 25.1 Absolute Change (NHFS3-NFHS1) SC IMR -37.3 -12.6 5.2 22.0 U5MR -49.4 -27.1 2.9 -17.9 ST IMR -13.3 9.9 -7.9 -26.2 U5MR -21.5 14.9 -4.5 -26.2 Non-SC/ST IMR -21.4 -5.2 -4.2 -8.1 U5MR -34.7 -13.8 -8.6 -6.6 All IMR -22.8 -4.4 -3.2 -6.7 U5MR -34.4 -12.2 -7.0 -6.2 Notes: Authors estimated IMR and U5MR for the 10-year period preceding the survey
Table 1 shows the trends in IMR and U5MR among SC, ST and non-SC/ST populations during 1992–2006 by the level of mother’s educational attainment. We observe that the higher the level of educational attainment of the mother, the lower level of IMR and U5MR among SC, ST and non-SC/ST populations in India. The IMR among children born to illiterate mothers is about three times higher than the IMR of children born to mothers with higher education across all the social groups. Similarly, U5MR seems to be five times
10
higher among the ST population and three times higher among SC population during the 14-years period (1992–2006). Also during that period, childhood mortality among illiterate mothers was declining across all social groups. There are some contradictory findings: among ST mothers with completed primary education, the absolute change in IMR and U5MR increased by 9.9 and 14.9 points, respectively; among SC mothers with completed secondary education, the absolute change in IMR and U5MR increased by 5.2 and 2.9, respectively; and for SC mothers with higher education, the absolute change in IMR increased by 22.0 points during this period. This may be due to increased coverage of mothers with secondary or higher education in NFHS-3 as compared to NFHS-1, or to persisting educational disparities among SC or ST mothers.
4.2 Socio-Economic Characteristics of Each Caste Group
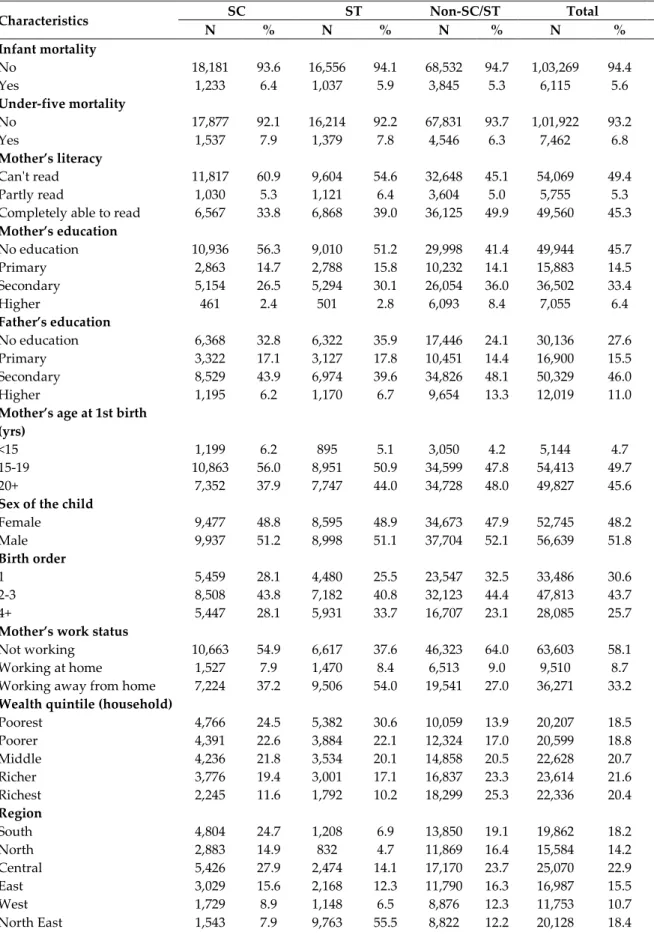
Table 2 shows differences in the selected socio-economic and demographic indicators for ever-married women from SCs, STs and the non-SC/ST population. Infant and under-five mortality rates are higher among SCs and STs compared to the non-SC/ST group. Individual literacy level, schooling and husband’s schooling are all found to be lower among SCs and STs than in the non-SC/ST population. For instance, only 2 percent of SC and 3 percent of ST women have completed higher education, compared to 8 percent of non-SC/ST women. About 56 percent of SC and 51 percent of ST women have their first birth at age 15–19 as compared to 48 percent of non-SC/ST women. Birth order 4 or more is higher among SC (28 percent) and ST (34 percent) women than for non-SC/ST women (23 percent). About 37 percent of SC women and 54 percent of ST women are working away from home, compared to 27 percent of non-SC/ST women. About 25 percent SC and 31 percent of ST women belong to the poorest wealth quintile compared to only 14 percent non-SC/ST women. About 64 percent SC and 78 percent of ST women live in rural areas whereas about 58 percent of the non-SC/ST women are rural inhabitants. There are more women without mass media exposure within the SC and ST group compared with the non-SC/ST group. For detail information please see Table 2.
11
Table 2: Comparison of selected characteristics by social groups in India, 2005–06
Characteristics SC ST Non-SC/ST Total
N % N % N % N % Infant mortality No 18,181 93.6 16,556 94.1 68,532 94.7 1,03,269 94.4 Yes 1,233 6.4 1,037 5.9 3,845 5.3 6,115 5.6 Under-five mortality No 17,877 92.1 16,214 92.2 67,831 93.7 1,01,922 93.2 Yes 1,537 7.9 1,379 7.8 4,546 6.3 7,462 6.8 Mother’s literacy Can't read 11,817 60.9 9,604 54.6 32,648 45.1 54,069 49.4 Partly read 1,030 5.3 1,121 6.4 3,604 5.0 5,755 5.3 Completely able to read 6,567 33.8 6,868 39.0 36,125 49.9 49,560 45.3
Mother’s education No education 10,936 56.3 9,010 51.2 29,998 41.4 49,944 45.7 Primary 2,863 14.7 2,788 15.8 10,232 14.1 15,883 14.5 Secondary 5,154 26.5 5,294 30.1 26,054 36.0 36,502 33.4 Higher 461 2.4 501 2.8 6,093 8.4 7,055 6.4 Father’s education No education 6,368 32.8 6,322 35.9 17,446 24.1 30,136 27.6 Primary 3,322 17.1 3,127 17.8 10,451 14.4 16,900 15.5 Secondary 8,529 43.9 6,974 39.6 34,826 48.1 50,329 46.0 Higher 1,195 6.2 1,170 6.7 9,654 13.3 12,019 11.0
Mother’s age at 1st birth (yrs)
<15 1,199 6.2 895 5.1 3,050 4.2 5,144 4.7 15-19 10,863 56.0 8,951 50.9 34,599 47.8 54,413 49.7 20+ 7,352 37.9 7,747 44.0 34,728 48.0 49,827 45.6
Sex of the child
Female 9,477 48.8 8,595 48.9 34,673 47.9 52,745 48.2 Male 9,937 51.2 8,998 51.1 37,704 52.1 56,639 51.8 Birth order 1 5,459 28.1 4,480 25.5 23,547 32.5 33,486 30.6 2-3 8,508 43.8 7,182 40.8 32,123 44.4 47,813 43.7 4+ 5,447 28.1 5,931 33.7 16,707 23.1 28,085 25.7
Mother’s work status
Not working 10,663 54.9 6,617 37.6 46,323 64.0 63,603 58.1 Working at home 1,527 7.9 1,470 8.4 6,513 9.0 9,510 8.7 Working away from home 7,224 37.2 9,506 54.0 19,541 27.0 36,271 33.2
Wealth quintile (household)
Poorest 4,766 24.5 5,382 30.6 10,059 13.9 20,207 18.5 Poorer 4,391 22.6 3,884 22.1 12,324 17.0 20,599 18.8 Middle 4,236 21.8 3,534 20.1 14,858 20.5 22,628 20.7 Richer 3,776 19.4 3,001 17.1 16,837 23.3 23,614 21.6 Richest 2,245 11.6 1,792 10.2 18,299 25.3 22,336 20.4 Region South 4,804 24.7 1,208 6.9 13,850 19.1 19,862 18.2 North 2,883 14.9 832 4.7 11,869 16.4 15,584 14.2 Central 5,426 27.9 2,474 14.1 17,170 23.7 25,070 22.9 East 3,029 15.6 2,168 12.3 11,790 16.3 16,987 15.5 West 1,729 8.9 1,148 6.5 8,876 12.3 11,753 10.7 North East 1,543 7.9 9,763 55.5 8,822 12.2 20,128 18.4
12
Characteristics N SC % N ST % Non-SC/ST N % N Total %
Type of residence
Urban 6,980 36.0 3,818 21.7 30,481 42.1 41,279 37.7 Rural 12,434 64.0 13,775 78.3 41,896 57.9 68,105 62.3
Mother’s media exposure
Without media exposure 8,337 42.9 9,130 51.9 25,671 35.5 43,138 39.4 With media exposure 11,077 57.1 8,463 48.1 46,706 64.5 66,246 60.6
Mother’s socio-economic empowerment
Does not take decisions
alone in the household 10,249 52.8 8,543 48.6 39,983 55.2 58,775 53.7 Takes decisions alone in the
household 9,165 47.2 9,050 51.4 32,394 44.8 50,609 46.3
Total 19,414 100.0 17,593 100.0 72,377 100.0 1,09,384 100.0
Source : NFHS-3
4.3 Results of Regression Analysis
We carried out binary logistic regression analysis to examine the association between maternal education and infant/under-five mortality for each caste group (Table 3). Mother’s education is found to have a statistically significant effect on reducing infant and under-five mortality for SC, ST and non-SC/ST populations. Children are less likely to die when their mother had completed primary education than children born to illiterate mothers. Moreover, as expected, infant and under-five mortality also shows significant declines simultaneously with increases in the educational level of the mother.
There might be one of the pathway to provide knowledge and awareness to the mothers through advertisements and public awareness campaigns using different mass media tools such as television, radio and newspapers, which enables them to take better care of their children, thus reducing child mortality. Examining the effect on infant and under-five mortality among the social groups is important, because access to different mass media tools by a household differs according to the level of education of household members. Logit estimates show that children born to mothers having any kind of exposure to the mass media are less likely to die than children born to mothers having no mass media exposure and the coefficients are found to be statistically significant across all social groups.
Interestingly, the effect of mass media exposure on the odds of infant mortality is higher for SCs and STs than non-SC/STs, the ratio of the odds value being 0.94 (p<0.01) for SCs and 1.09 (p<0.1) for STs. Similarly, the mother’s mass media exposure considerably reduces the odds of under-five mortality among SCs and STs compared to non-SC/STs, with the odds values ratio of 0.99 (p<0.01) in SCs and 1.10 (p<0.1) in STs. The socio-economic empowerment of the mother is also found to be statistically significant in the determination of infant and under-five mortality as the odds ratio of infant and under-five
13
mortality turns out lower among the socially and economically empowered mother than among those who are not.
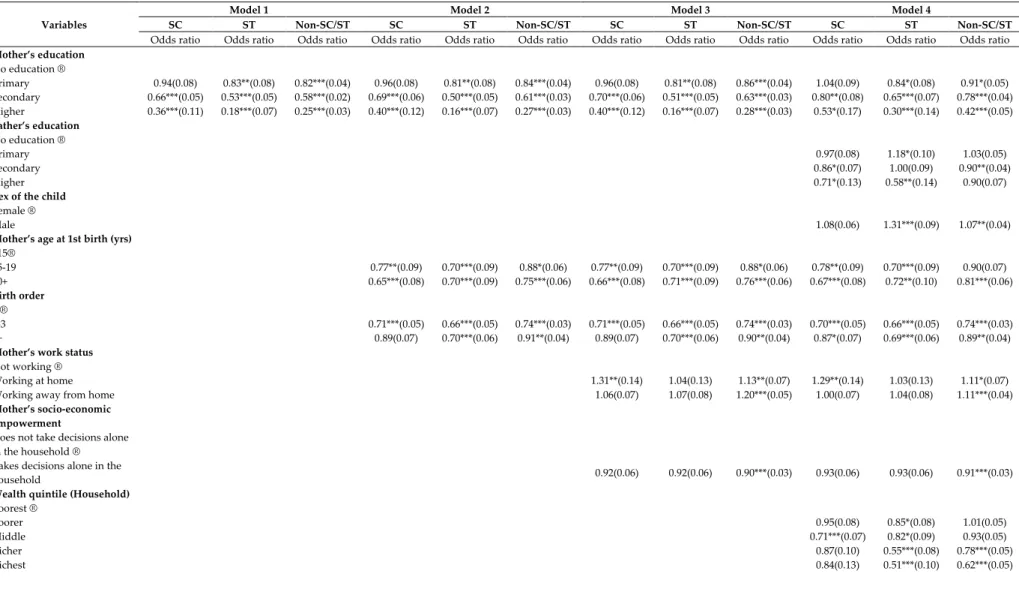
Tables 4.1 and 4.2 in the Appendix shows results of stepwise binary logistic regression and corresponding significance levels for infant and under-five mortality on the selected socio-economic and demographic variables among caste groups. We have employed four different models controlled on region to observe the effect of said variables along with mother’s education on the dependent variable under study. Results revealed a significant negative association between mother’s education and child mortality. Mother’s age at first child birth was also found to be significantly associated with infant and under-five mortality. Children born to women aged 15 years and above had significantly lower odds of child mortality than babies born to women aged less than 15 years. Birth order was also significantly associated with infant and under-five mortality. Higher odds of infant and under-five mortality were also observed in the case of working mothers which may be due to the fact that lower-caste women mostly do labour work in less hygienic condition in rural India. The father’s education also helps in reducing child mortality among social groups. Model 4 includes all independent variables and the results show that male children had higher odds of dying during infancy and under five years of age compared to female children. The spatial variable (geographical region) was also found to play a significant role in infant and under-five mortality. It is the central region where the odds of child mortality were found higher compared to the south of the country.
1
Table 3: Logit estimates in infant and under-five mortality by mother's education, media exposure & socio-economic empowerment among SC, ST & non-SC/ST populations, India, 2005-06
Variables
IM U5M
SC ST Non-SC/ST SC ST Non-SC/ST Odds ratio Odds ratio Odds ratio Odds ratio Odds ratio Odds ratio Mother’s literacy Can't read ®
Partly read 1.137 (0.179) 0.739* (0.120) 0.809** (0.076) 0.968 (0.142) 0.689** (0.101) 0.792*** (0.070)
Completely able to read 1.015 (0.177) 0.735* (0.131) 0.880 (0.080) 0.899 (0.144) 0.768* (0.119) 0.879 (0.074)
Mother’s education
No education ®
Primary 0.914 (0.111) 0.916 (0.113) 0.913 (0.062) 0.887 (0.097) 0.876 (0.095) 0.870** (0.055)
Secondary 0.664** (0.126) 0.652** (0.127) 0.655*** (0.065) 0.618*** (0.109) 0.564*** (0.097) 0.586*** (0.054)
Higher 0.386*** (0.132) 0.214*** (0.096) 0.298*** (0.040) 0.322*** (0.108) 0.151*** (0.067) 0.280*** (0.035)
Mother’s media exposure
Without media exposure ®
With media exposure 0.811*** (0.052) 0.946* (0.069) 0.866*** (0.032) 0.817*** (0.047) 0.896* (0.057) 0.818*** (0.028)
Mother’s socio-economic empowerment
Doesn’t take decisions alone ®
Takes decisions alone 0.912 (0.054) 0.871** (0.057) 0.893*** (0.030) 0.922 (0.050) 0.865** (0.049) 0.912*** (0.029)
Constant 0.088*** (0.004) 0.089*** (0.005) 0.085*** (0.002) 0.118*** (0.005) 0.128*** (0.006) 0.108*** (0.003)
Observations 19,414 17,593 72,377 19,414 17,593 72,377
1
4.4 Result of the Decomposition Analysis
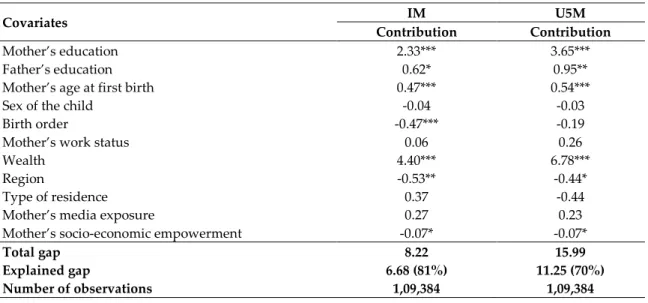
In this study we used the Fairlie decomposition analysis to quantify the contribution of different socio-economic and demographic predictors explaining the gap in infant mortality and under-five mortality between SCs/STs and the non-SC/ST population. Results of the detailed decomposition are presented in Table 5. To make our result more readable, we present the coefficient in terms of percentage (Fig. 2). The positive contribution of a covariate indicates that this particular covariate contributed to widening the infant and under-five mortality gap between SCs/STs and non-SC/ST populations, while the negative contribution of a covariate indicates it was helping to reduce the gap. Results further indicate that 81 percent of the infant mortality gap between SCs/STs and SC/ST and 70 percent of the under-five mortality gap between SCs/STs and non-SC/ST are explained by the factors included in the analysis. Among the explained gap, more than 90 percent of it is explained by differences in the distribution of women education and household wealth for both infant and under-five mortality risk. The unexplained gap—19 percent for infant mortality and 30 percent for under-five mortality—might be related to other structural factors not covered by the dataset.
Table 5: Fairlie decomposition of average gap in infant and under-five mortality risk between social groups in India, 2005–06
Covariates IM U5M
Contribution Contribution
Mother’s education 2.33*** 3.65*** Father’s education 0.62* 0.95** Mother’s age at first birth 0.47*** 0.54*** Sex of the child -0.04 -0.03
Birth order -0.47*** -0.19
Mother’s work status 0.06 0.26
Wealth 4.40*** 6.78***
Region -0.53** -0.44*
Type of residence 0.37 -0.44 Mother’s media exposure 0.27 0.23 Mother’s socio-economic empowerment -0.07* -0.07*
Total gap 8.22 15.99
Explained gap 6.68 (81%) 11.25 (70%)
Number of observations 1,09,384 1,09,384
Notes: *** p<0.01, ** p<0.05, * p<0.1
Mother’s education is an important contributor as well, explaining 35 percent of the infant mortality gap and 32 percent of the under-five mortality gap. Household wealth is the maximum contributor explaining 66 percent of the infant mortality gap and 60 percent of the under-five mortality gap between SCs/STs and the non-SC/ST population. Father’s education contributes 8–9 percent, hence the total contribution of education rises to 44 percent and 41 percent for IMR and U5MR, respectively. Mother’s age at first birth contributes 5–7 percent in explaining the infant and under-five mortality gap between the
2
caste groups. Mother’s work status and mother’s media exposure are also contributors widening the caste gap in infant and under-five mortality risk though they are not significant. Birth order narrowed the gap on infant mortality risk, though its contribution is negligible. Geographical region and woman’s autonomy minimise the social gap in infant and under-five mortality risk though the contributions are very small.
Figure 2: Result of Fairlie decomposition analysis showing the percentage contribution of each covariate to the gaps in infant mortality (IM) and under-five mortality (U5M) risk between social groups, India, 2005–06
5.
Discussion and Conclusion
Childhood mortality is an outcome of a country’s general medical and public health conditions, and consequently of its level of socio-economic development. Considerably higher infant and under-five mortality among SCs and STs in India indicates an unequal distribution and use of resources which triggers unequal development among the social groups. The importance of understanding IMR and U5MR by social groups has increased in the era of Sustainable Development Goals (SDG), as these goals are inclusive to improve children health for marginalised population sections of any country too.
-10% 0% 10% 20% 30% 40% 50% 60% 70% % C o n tr ib u tio n Covariates IM U5M
3
The present study documented disparities in infant and under-five mortality by mother’s education in India. To our knowledge, this is the first study in India which systematically investigates the factors explaining IMR/U5MR by caste groups. It highlights three important results. First, our findings reveal unequal access to education by caste groups in India during the study period. The levels of mother’s educational attainment in secondary and higher schools constitute lower shares among SCs (29 percent) and STs (33 percent) compared with non-SC/ST (44 percent) mothers. Illiteracy among SC and ST mothers is 15 percent and 10 percent higher, respectively, than for non-SC/ST mothers.
Second, IMR and U5MR are substantially higher among deprived caste groups. Once caste interacts with education, this disparity increases further. Regression analysis also confirms that there is a negative relationship of maternal education and childhood mortality in each caste groups. These findings are consistent with those of previous national and sub-national studies for India (Bicego and Boerma, 1993, 1990; Caldwell, 1979; Choudhury, 2015; Cleland et al., 1991; Cleland and Van Ginneken, 1988; Gakidou et al., 2010; Govindasamy and Ramesh, 1997; Hatt and Waters, 2006; Pamuk et al., 2011; Vikram et al., 2012).
Finally, the gap in infant and under-five mortality by caste groups is mainly due to their disadvantages in education and economic condition. Since 55 percent of SC/ST women are from the poorest backgrounds, it is not astonishing that household economic status turns out to be the largest contributing factor in widening the caste gap regarding infant and under-five mortality. The effect of household economic status on child mortality is well documented (Alemayehu Azeze and Huang, 2014; Arnold et al., 1998; Caldwell, 1979; Cleland and Van Ginneken, 1988; Mohanty, 2011; Po and Subramanian, 2011). It is argued that poor SC/ST households do not have enough resources for child and maternal health care expenses. In contrast, the non-SC/ST population is economically better off and more educated, may have a more advanced view, more knowledge about child care, preventive care (greatly associated with the modern health care system), higher confidence in dealing with health care providers and a greater ability and readiness to travel outside the community for their health needs (Cleland and Van Ginneken, 1988), all of which may help reduce the poor child health outcome.
Education of mothers and fathers is an important contributor for the gap in infant and under-five mortality between SCs/STs and the non-SC/ST population. Possibly, the lower level of education among SCs/STs is accompanied by a low awareness of health services, less knowledge of the benefits of preventive child health care, poor communication with the husband and other family members on health-related issues and poor decision-making power within the family, low self-confidence, poor surviving abilities and negotiating skills in reducing power differentials towards health care providers and hence a reduced capability of insisting on adequate health services (Burgard, 2004). Our regression analysis also reveals that mother’s exposure to mass media and her socially and economically empowered ability is an important factor in reducing infant and
under-4
five mortality among SCs and STs in conjunction with the mother’s education. This finding is consistent with the findings of a study by Choudhury(2015) pertaining to factors reducing infant mortality in India.
Notably, SC and ST populations have always lagged behind: they are less likely to use maternal health care and they are also discriminated by society compared with the non-SC/ST population (Adamson et al., 2012; Bhardwaj and Tungdim, 2010; Saroha et al., 2008). The effect of caste along with household income, education of the women and her husband’s and mother’s age at first birth all have been found to be significantly associated with child mortality in India (Das et al., 2010; Dommaraju et al., 2008; Mohindra et al., 2006; Nguyen et al., 2013; Po and Subramanian, 2011; Ram et al., 2017; Sahu et al., 2015; Singh-Manoux et al., 2008; Subramanian et al., 2006a, 2006b).
Our findings suggest that increasing maternal education among socially deprived groups should be prioritised to reduce infant and under-five mortality as well as the overall state of health of children in India. In order to reduce child mortality, the Government of India launched an ambitious National Rural Health Mission (NRHM— now as NHM: National Health Mission), a major concern of which is the Child Health Programme (CHP) that includes comprehensive interventions to improve child health and addresses factors contributing to infant and under-five mortality (Ministry of Health and Family Welfare, 2011). Although the Government of India has made significant progress in increasing the coverage of MCH (Maternal and Child Health Care), services under this programme constitute a major policy initiative to serve economically marginalised groups. A further success in lowering child mortality is needed by focusing on disadvantaged social groups and helping to achieve the sustainable development goals (SDG) for child mortality by 2030 (UN, 2015).
As our findings indicate, reducing childhood mortality and narrowing the gaps between social groups in India can be realised by improving female education as health education provided to mothers, along with interventions for economic support for SCs and STs. However, this is possible only through long-term programmes. In the short term, some proper measures would be: sensitisation and generation of awareness with regard to preventive care against child health, maternal care and the mother’s food habits, awareness about infectious diseases, availability of and access to clean water and sanitation as well as information about the provision of subsidised maternal health care services among the populations at risk. Moreover, there is also a need to both ensure quality care and eradicate social discrimination against socially disadvantaged people in health facilities (Baru et al., 2010). This can be argued by the evidence that lower-caste women have little antenatal care and often prefer home deliveries with traditional birth attendance from their community out of fear of being stigmatised and discriminated at health facilities (Saroha et al., 2008). Another possible initiative might be to involve parents of SC and ST children in health-related intervention programmes at village level, and educate them about preventive care for their infants at home and the importance of antenatal care for women during pregnancy. Our study emphasises that among socially
5
deprived groups the educational attainment of mothers is crucial and policies should be developed to ensure greater health equity, bridge gaps and reduce differentials in child mortality among disadvantaged caste groups across the country.
6
References
Adamson, P.C., Krupp, K., Niranjankumar, B., Freeman, A.H., Khan, M., Madhivanan, P., 2012. Are marginalized women being left behind? A population-based study of institutional deliveries in Karnataka, India. BMC Public Health 12, 30.
Alemayehu Azeze, A., Huang, W., 2014. Maternal education, linkages and child nutrition in the long and short-run: evidence from the Ethiopia Demographic and Health Surveys. Int. J. Afr. Dev. 1, 3.
Arnold, F., Choe, M.K., Roy, T.K., 1998. Son preference, the family-building process and child mortality in India. Popul. Stud. 52, 301–315.
Aslam, M., Kingdon, G.G., 2012. Parental education and child health—understanding the pathways of impact in Pakistan. World Dev. 40, 2014–2032.
Baru, R., Acharya, A., Acharya, S., Kumar, A.S., Nagaraj, K., 2010. Inequities in access to health services in India: caste, class and region. Econ. Polit. Wkly. 49–58.
Basu, A.M., Stephenson, R., 2005. Low levels of maternal education and the proximate determinants of childhood mortality: a little learning is not a dangerous thing. Soc. Sci. Med. 60, 2011–2023.
Bhardwaj, S., Tungdim, M.G., 2010. Reproductive health profile of the scheduled caste and scheduled tribe women of Rajasthan, India. Open Anthropol. J. 3, 181–187.
Bicego, G.T., Boerma, J.T., 1990. Maternal education use of health services and child survival: an analysis of data from the Bolivia DHS Survey.
Bicego, G.T., Boerma, J.T., 1993. Maternal education and child survival: a comparative study of survey data from 17 countries. Soc. Sci. Med. 36, 1207–1227.
Blinder, A.S., 1973. Wage discrimination: reduced form and structural estimates. J. Hum. Resour. 436–455.
Bloom, S.S., Wypij, D., Gupta, M.D., 2001. Dimensions of women’s autonomy and the influence on maternal health care utilization in a north Indian city. Demography 38, 67– 78.
Borooah, V.K., 2005. Caste, inequality, and poverty in India. Rev. Dev. Econ. 9, 399–414. Burgard, S., 2004. Race and pregnancy-related care in Brazil and South Africa. Soc. Sci. Med. 59, 1127–1146.
Caldwell, J.C., 1979. Education as a factor in mortality decline an examination of Nigerian data. Popul. Stud. 395–413.
Caldwell, J., McDonald, P., 1982. Influence of maternal education on infant and child mortality: levels and causes. Health Policy Educ. 2, 251–267.
7
Choudhury, P.K., 2015. Explaining the Role of Parental Education in the Regional Variations in Infant Mortality in India. Asia Pac. Policy Stud. 2, 544–572.
Cleland, J., Bicego, G., Fegan, G., 1991. Socio-economic inequalities in childhood mortality: the 1970s compared with the 1980s. [Unpublished] 1991. Presented at the Demographic and Health Surveys World Conference Washington DC August 5-7 1991.
Cleland, J.G., Van Ginneken, J.K., 1988. Maternal education and child survival in developing countries: the search for pathways of influence. Soc. Sci. Med. 27, 1357–1368. Cochrane, S.H., Leslie, J., O’Hara, D.J., 1982. Parental education and child health: intra country evidence. Health Policy Educ. 2, 213–250.
Das, M.B., Kapoor, S., Nikitin, D., 2010. A closer look at child mortality among Adivasis in India.
Das Gupta, M., 1990. Death clustering, mothers’ education and the determinants of child mortality in rural Punjab, India. Popul. Stud. 44, 489–505.
Desai, S., Alva, S., 1998. Maternal education and child health: Is there a strong causal relationship? Demography 35, 71–81.
Dommaraju, P., Agadjanian, V., Yabiku, S., 2008. The pervasive and persistent influence of caste on child mortality in India. Popul. Res. Policy Rev. 27, 477–495.
Fairlie, R.W., 2005. An extension of the Blinder–Oaxaca decomposition technique to logit and probit models. J. Econ. Soc. Meas. 30, 305–316.
Frost, M.B., Forste, R., Haas, D.W., 2005. Maternal education and child nutritional status in Bolivia: finding the links. Soc. Sci. Med. 60, 395–407.
Gakidou, E., Cowling, K., Lozano, R., Murray, C.J., 2010. Increased educational attainment and its effect on child mortality in 175 countries between 1970 and 2009: a systematic analysis. The Lancet 376, 959–974.
Glewwe, P., 1999. Why does mother’s schooling raise child health in developing countries? Evidence from Morocco. J. Hum. Resour. 124–159.
Govindasamy, P., Ramesh, B.M., 1997. Maternal education and the utilization of maternal and child health services in India.
Grépin, K.A., Bharadwaj, P., 2015. Maternal education and child mortality in Zimbabwe. J. Health Econ. 44, 97–117.
Hatt, L.E., Waters, H.R., 2006. Determinants of child morbidity in Latin America: a pooled analysis of interactions between parental education and economic status. Soc. Sci. Med. 62, 375–386.
8
National Family Health Survey (NFHS-3), 2005-2006. India. Mumbai: IIPS; 2007.
Jain, A.K., 1985. Determinants of regional variations in infant mortality in rural India. Popul. Stud. 39, 407–424.
Keats, A., 2014. Women’s schooling, fertility, and child health outcomes: Evidence from Uganda’s free primary education program. Mimeo: Wesleyan University.
Mitra, A., Singh, P., 2008. Trends in literacy rates and schooling among the scheduled tribe women in India. Int. J. Soc. Econ. 35, 99–110.
Mohanty, S.K., 2011. Multidimensional poverty and child survival in India. PLoS One 6, e26857.
Mohindra, K.S., Haddad, S., Narayana, D., 2006. Women’s health in a rural community in Kerala, India: do caste and socioeconomic position matter? J. Epidemiol. Community Health 60, 1020–1026.
Nayar, K.R., 2007. Social exclusion, caste & health: a review based on the social determinants framework. Indian J. Med. Res. 126, 355.
Nguyen, K.-H., Jimenez-Soto, E., Dayal, P., Hodge, A., 2013. Disparities in child mortality trends: what is the evidence from disadvantaged states in India? the case of Orissa and Madhya Pradesh. Int. J. Equity Health 12, 45.
Oaxaca, R., 1973. Male-female wage differentials in urban labor markets. Int. Econ. Rev. 693–709.
O’Donnell, O., Doorslaer, E. van, Wagstaff, A., Lindelow, M., 2008. Analyzing health equity using household survey data: a guide to techniques and their implementation. Anal. Health Equity Using Househ. Surv. Data Guide Tech. Their Implement.
Pamuk, E.R., Fuchs, R., Lutz, W., 2011. Comparing relative effects of education and economic resources on infant mortality in developing countries. Popul. Dev. Rev. 37, 637– 664.
Parikh, S., 1997. The politics of preference: democratic institutions and affirmative action in the United States and India. University of Michigan Press.
Po, J.Y., Subramanian, S.V., 2011. Mortality burden and socioeconomic status in India. PLoS One 6, e16844.
Planning Commission, Government of India. Twelfth Five Year Plan (2012-2017) of the Government of India [online], 2012. http://planningcommission. gov.in/plans/planrel/ fiveyr/welcome.html
9
Ram, B., Singh, A., Yadav, A., 2017. The persistent caste divide in India’s infant mortality: A study of Dalits (ex-untouchables), Adivasis (indigenous peoples), Other Backward Classes, and forward castes. Can. Stud. Popul. 43, 249–63.
Rutstein, S.O., Rojas, G., 2006. Guide to DHS statistics. Calverton MD ORC Macro.
Sahu, D., Nair, S., Singh, L., Gulati, B.K., Pandey, A., 2015. Levels, trends & predictors of infant & child mortality among Scheduled Tribes in rural India. Indian J. Med. Res. 141, 709.
Saroha, E., Altarac, M., Sibley, L.M., 2008. Caste and maternal health care service use among rural Hindu women in Maitha, Uttar Pradesh, India. J. Midwifery Women’s Health 53.
Singh-Manoux, A., Dugravot, A., Smith, G.D., Subramanyam, M., Subramanian, S.V., 2008. Adult education and child mortality in India: the influence of caste, household wealth, and urbanization. Epidemiol. Camb. Mass 19, 294.
Subramanian, S.V., Nandy, S., Irving, M., Gordon, D., Lambert, H., Davey Smith, G., 2006a. The mortality divide in India: the differential contributions of gender, caste, and standard of living across the life course. Am. J. Public Health 96, 818–825.
Subramanian, S.V., Smith, G.D., Subramanyam, M., 2006b. Indigenous health and socioeconomic status in India. PLoS Med. 3, e421.
UNICEF, 2011. Maternal And Perinatal Death Inquiry and Response. 2008. Httpwww Unicef OrgindiaMAPEDIR-Matern.-India Pdf Fa.
Van de Poel, E., Speybroeck, N., 2009. Decomposing malnutrition inequalities between Scheduled Castes and Tribes and the remaining Indian population. Ethn. Health 14, 271– 287.
Vikram, K., Vanneman, R., Desai, S., 2012. Linkages between maternal education and childhood immunization in India. Soc. Sci. Med. 75, 331–339.
Wagstaff, A., O’Donnell, O., Van Doorslaer, E., Lindelow, M., 2007. Analyzing health equity using household survey data: a guide to techniques and their implementation. World Bank Publications.
Wax, E., 2010. Lure of cash aids India's efforts to reduce number of women dying in childbirth. Wash. Post.
Webb, P., Block, S., 2004. Nutrition information and formal schooling as inputs to child nutrition. Econ. Dev. Cult. Change 52, 801–820.
10
Appendix
Fairlie decomposition (2005)
As per Standard Blinder–Oaxaca decomposition, the SC/ST vs. non-SC/ST gap in the average value of the dependent variable, Y, (here, infant mortality/under-five mortality) can be expressed as
(
)
[
]
[
s
(
n
s
)
]
X
n
s
X
n
X
s
Y
n
Y
−
=
−
β
ˆ
+
β
ˆ
−
β
ˆ
, (i) where jX
is a row vector of average values of the independent covariates andβ
ˆ
jis avector of coefficient estimates for infant mortality/under-five mortality j. An extension of this decomposition for a non-linear equation, Y= F (
X
β
ˆ
), can be written as(
)
(
)
(
)
( )
= − ∑ = − ∑= + ∑ = − ∑= s N i s N i N s s X s i F N s n X s i F n N i s N i N s n X s i F N n n X n i F s n Y Y 1 1 ˆ ˆ 1 1 ˆ ˆ β β β β , (ii) An equally valid expression for the decomposition is:(
)
( )
(
)
(
)
= − ∑ = − ∑= + ∑ = − ∑= n N i n N i N n s X n i F N n n X n i F n N i s N i N s s X s i F N n s X n i F s n Y Y 1 1 ˆ ˆ 1 1 ˆ ˆ β β β β , (iii) where jN is the sample size for interest group j.
Y
jis the average probability of the binaryoutcome of the interest group j and F is the cumulative distribution function from the logistic distribution. Here, superscripts ‘n’ and ‘s’ stand for ‘non-SC/ST population’ and ‘SCs/STs’.
In both (ii) and (iii), the first term in brackets represents the part of the gap between social groups due to group differences in distributions of the entire set of independent variables, and the second term represents the part due to differences in the group processes determining levels of Y. The second term also captures the portion of the group gap due to group differences in unmeasurable or unobserved endowments.
For total contribution, we need to calculate two sets of predicted probabilities for SCs/STs and the non-SC/ST population and take the difference between the average values of the two. However, obtaining the contribution of a specific covariate is not direct. As the sample sizes of the two groups are not the same, we need to carry out a regression for pooled data (SCs/STs and the non-SC/ST population together) and calculate the predicted probabilities, for each SCs/STs and the non-SC/ST population observation in the sample. Since the SC/ST population is bigger than SCs/STs, a random subsample of the non-SC/ST population equal in size to the full SCs/STs sample should be drawn. Each observation in the non-SC/ST population sample and full SCs/STs sample is then separately ranked by predicted probabilities and matched by their respective rankings. This procedure matches the SCs/STs infants/under-fives who have characteristics placing them at the bottom (top) of their distribution with infants/under-fives from the non-SC/ST
11
population who have characteristics placing them at the bottom (top) of their distribution. Now assume that Ns=Nn and a natural one-to-one matching of SCs/STs and non-SC/ST
population observations exists. Also assume that there are two independent variables to explain the social group gap in infant/under-five mortality.
Using coefficient estimates from a logit regression for a pooled sample,
β
ˆ
*, theindependent contribution of X1 to the group gap can then be expressed as:
(
) (
*)
2 2 * 1 1 * 1 * 2 2 * 1 1 *ˆ
ˆ
ˆ
ˆ
ˆ
ˆ
1
α
β
β
α
β
nβ
i s i N i n i n i sF
X
X
F
X
X
N
s+
+
−
+
+
∑
=Similarly, the contribution of X2 can be expressed as:
(
) (
*)
2 2 * 1 1 * 1 * 2 2 * 1 1 *ˆ
ˆ
ˆ
ˆ
ˆ
ˆ
1
α
β
β
α
β
sβ
i s i N i n i s i sF
X
X
F
X
X
N
s+
+
−
+
+
∑
=The contribution of each variable to the gap is thus equal to the change in the average predicted probability from replacing SCs/STs distribution with non-SC/ST population distribution while holding the distributions of the other variables constant.
However, the assumption of equal sample size is rarely true in practical situations. Since the non-SC/ST sample is substantially larger, a large number of random subsamples of the infants/under-five of the non-SCs/STs (equal size to total SCs/STs sample) are drawn to match each of them to the SCs/STs sample and calculate separate decomposition. Finally, the mean value of all these separate decomposition estimates is used as an approximate decomposition for the entire non-SC/ST population sample. We used 1000 replications of such decomposition and presented the average result. It must be noted here that increasing the number of replications improves the stability of the results.
12
Table 4.1. Stepwise logit estimates of infant mortality by socio-economic and demographic characteristics among SC, ST and Non-SC/ST populations, India, 2005–06
Variables
Model 1 Model 2 Model 3 Model 4
SC ST Non-SC/ST SC ST Non-SC/ST SC ST Non-SC/ST SC ST Non-SC/ST
Odds ratio Odds ratio Odds ratio Odds ratio Odds ratio Odds ratio Odds ratio Odds ratio Odds ratio Odds ratio Odds ratio Odds ratio
Mother’s education No education ® Primary 0.94(0.08) 0.83**(0.08) 0.82***(0.04) 0.96(0.08) 0.81**(0.08) 0.84***(0.04) 0.96(0.08) 0.81**(0.08) 0.86***(0.04) 1.04(0.09) 0.84*(0.08) 0.91*(0.05) Secondary 0.66***(0.05) 0.53***(0.05) 0.58***(0.02) 0.69***(0.06) 0.50***(0.05) 0.61***(0.03) 0.70***(0.06) 0.51***(0.05) 0.63***(0.03) 0.80**(0.08) 0.65***(0.07) 0.78***(0.04) Higher 0.36***(0.11) 0.18***(0.07) 0.25***(0.03) 0.40***(0.12) 0.16***(0.07) 0.27***(0.03) 0.40***(0.12) 0.16***(0.07) 0.28***(0.03) 0.53*(0.17) 0.30***(0.14) 0.42***(0.05) Father’s education No education ® Primary 0.97(0.08) 1.18*(0.10) 1.03(0.05) Secondary 0.86*(0.07) 1.00(0.09) 0.90**(0.04) Higher 0.71*(0.13) 0.58**(0.14) 0.90(0.07)
Sex of the child
Female ®
Male 1.08(0.06) 1.31***(0.09) 1.07**(0.04)
Mother’s age at 1st birth (yrs)
<15® 15-19 0.77**(0.09) 0.70***(0.09) 0.88*(0.06) 0.77**(0.09) 0.70***(0.09) 0.88*(0.06) 0.78**(0.09) 0.70***(0.09) 0.90(0.07) 20+ 0.65***(0.08) 0.70***(0.09) 0.75***(0.06) 0.66***(0.08) 0.71***(0.09) 0.76***(0.06) 0.67***(0.08) 0.72**(0.10) 0.81***(0.06) Birth order 1 ® 2-3 0.71***(0.05) 0.66***(0.05) 0.74***(0.03) 0.71***(0.05) 0.66***(0.05) 0.74***(0.03) 0.70***(0.05) 0.66***(0.05) 0.74***(0.03) 4+ 0.89(0.07) 0.70***(0.06) 0.91**(0.04) 0.89(0.07) 0.70***(0.06) 0.90**(0.04) 0.87*(0.07) 0.69***(0.06) 0.89**(0.04)
Mother’s work status
Not working ®
Working at home 1.31**(0.14) 1.04(0.13) 1.13**(0.07) 1.29**(0.14) 1.03(0.13) 1.11*(0.07)
Working away from home 1.06(0.07) 1.07(0.08) 1.20***(0.05) 1.00(0.07) 1.04(0.08) 1.11***(0.04)
Mother’s socio-economic empowerment
Does not take decisions alone in the household ® Takes decisions alone in the
household 0.92(0.06) 0.92(0.06) 0.90***(0.03) 0.93(0.06) 0.93(0.06) 0.91***(0.03)
Wealth quintile (Household)
Poorest ®
Poorer 0.95(0.08) 0.85*(0.08) 1.01(0.05)
Middle 0.71***(0.07) 0.82*(0.09) 0.93(0.05)
Richer 0.87(0.10) 0.55***(0.08) 0.78***(0.05)
13
Variables
Model 1 Model 2 Model 3 Model 4
SC ST Non-SC/ST SC ST Non-SC/ST SC ST Non-SC/ST SC ST Non-SC/ST
Odds ratio Odds ratio Odds ratio Odds ratio Odds ratio Odds ratio Odds ratio Odds ratio Odds ratio Odds ratio Odds ratio Odds ratio
Region South® North 0.86(0.09) 1.05(0.20) 1.03(0.06) 0.84*(0.09) 1.01(0.19) 1.01(0.06) 0.83*(0.09) 1.01(0.19) 1.00(0.06) 0.82*(0.09) 0.95(0.18) 0.94(0.06) Central 1.31***(0.10) 1.46***(0.20) 1.53***(0.08) 1.26***(0.10) 1.47***(0.20) 1.49***(0.08) 1.25***(0.10) 1.45***(0.20) 1.49***(0.08) 1.18**(0.10) 1.31*(0.19) 1.40***(0.07) East 0.92(0.09) 1.26(0.18) 1.22***(0.07) 0.86(0.09) 1.24(0.18) 1.17***(0.07) 0.84*(0.08) 1.24(0.18) 1.19***(0.07) 0.76***(0.08) 1.10(0.16) 1.08(0.06) West 0.89(0.11) 1.16(0.20) 1.03(0.07) 0.88(0.11) 1.14(0.20) 1.02(0.07) 0.89(0.11) 1.14(0.20) 1.02(0.07) 0.88(0.11) 1.09(0.19) 1.01(0.07) North East 0.99(0.12) 0.93(0.12) 1.09(0.07) 0.96(0.12) 0.95(0.13) 1.07(0.07) 0.95(0.12) 0.96(0.13) 1.07(0.07) 0.91(0.12) 0.96(0.13) 0.96(0.06) Type of residence Urban® Rural 1.09(0.08) 0.77**(0.08) 1.01(0.04) Constant 0.07***(0.00) 0.07***(0.01) 0.06***(0.00) 0.12***(0.02) 0.13***(0.02) 0.09***(0.01) 0.12***(0.02) 0.13***(0.02) 0.08***(0.01) 0.13***(0.02) 0.17***(0.04) 0.09***(0.01) Observations 19,414 17,593 72,377 19,414 17,593 72,377 19,414 17,593 72,377 19,414 17,593 72,377
14
Table 4.2. Step wise logit estimates of under-five mortality by socio-economic and demographic characteristics among SC, ST and Non-SC/ST population, India, 2005-06
Variables
Model 1 Model 2 Model 3 Model 4
SC ST Non-SC/ST SC ST Non-SC/ST SC ST Non-SC/ST SC ST Non-SC/ST
Odds ratio Odds ratio Odds ratio Odds ratio Odds ratio Odds ratio Odds ratio Odds ratio Odds ratio Odds ratio Odds ratio Odds ratio
Mother’s education No education ® Primary 0.85**(0.07) 0.78***(0.07) 0.77***(0.03) 0.88(0.07) 0.77***(0.06) 0.80***(0.04) 0.88(0.07) 0.78***(0.07) 0.81***(0.04) 0.96(0.08) 0.84**(0.07) 0.88***(0.04) Secondary 0.56***(0.04) 0.47***(0.04) 0.51***(0.02) 0.60***(0.05) 0.46***(0.04) 0.54***(0.02) 0.60***(0.05) 0.47***(0.04) 0.57***(0.02) 0.71***(0.06) 0.64***(0.06) 0.72***(0.03) Higher 0.27***(0.08) 0.12***(0.05) 0.23***(0.02) 0.31***(0.09) 0.12***(0.05) 0.26***(0.03) 0.31***(0.09) 0.12***(0.05) 0.27***(0.03) 0.43***(0.14) 0.26***(0.11) 0.42***(0.05) Father’s education No education ® Primary 0.97(0.07) 1.09(0.09) 1.03(0.05) Secondary 0.87**(0.06) 0.93(0.07) 0.90***(0.04) Higher 0.75*(0.12) 0.55***(0.12) 0.86*(0.07)
Sex of the child
Female ®
Male 0.97(0.05) 1.22***(0.07) 1.00(0.03)
Mother’s age at 1st birth (yrs) <15® 15-19 0.77***(0.08) 0.79**(0.09) 0.86**(0.06) 0.77***(0.08) 0.79**(0.09) 0.86**(0.06) 0.78**(0.08) 0.80*(0.09) 0.88*(0.06) 20+ 0.68***(0.07) 0.76**(0.09) 0.74***(0.05) 0.68***(0.07) 0.77**(0.09) 0.75***(0.05) 0.70***(0.08) 0.79**(0.09) 0.79***(0.06) Birth order 1 ® 2-3 0.81***(0.05) 0.75***(0.05) 0.77***(0.03) 0.80***(0.06) 0.75***(0.05) 0.77***(0.03) 0.80***(0.06) 0.75***(0.05) 0.77***(0.03) 4+ 1.03(0.08) 0.80***(0.06) 1.00(0.04) 1.02(0.08) 0.80***(0.06) 1.00(0.04) 1.01(0.07) 0.78***(0.06) 0.98(0.04)
Mother’s work status
Not working ®
Working at home 1.23**(0.12) 1.05(0.12) 1.12**(0.06) 1.22**(0.12) 1.03(0.12) 1.10*(0.06)
Working away from home 1.05(0.06) 1.15**(0.07) 1.21***(0.04) 0.99(0.06) 1.08(0.07) 1.11***(0.04)
Mother’s socio-economic empowerment
Does not take decision alone in the household ® Takes decision alone in the
household 0.92(0.05) 0.90*(0.05) 0.91***(0.03) 0.94(0.05) 0.92(0.05) 0.92***(0.03)
Wealth quintile (Household)
Poorest ®
Poorer 0.96(0.07) 0.79***(0.06) 0.96(0.05)
Middle 0.73***(0.06) 0.75***(0.07) 0.86***(0.04)
15
Variables
Model 1 Model 2 Model 3 Model 4
SC ST Non-SC/ST SC ST Non-SC/ST SC ST Non-SC/ST SC ST Non-SC/ST
Odds ratio Odds ratio Odds ratio Odds ratio Odds ratio Odds ratio Odds ratio Odds ratio Odds ratio Odds ratio Odds ratio Odds ratio
Richest 0.74**(0.10) 0.44***(0.08) 0.57***(0.04) Region South® North 0.82**(0.08) 0.96(0.16) 1.03(0.06) 0.80**(0.08) 0.94(0.16) 1.02(0.06) 0.80**(0.08) 0.94(0.16) 1.01(0.06) 0.77***(0.08) 0.89(0.15) 0.94(0.06) Central 1.37***(0.10) 1.45***(0.18) 1.59***(0.08) 1.32***(0.09) 1.45***(0.18) 1.53***(0.07) 1.31***(0.09) 1.42***(0.17) 1.54***(0.07) 1.23***(0.09) 1.24*(0.15) 1.42***(0.07) East 0.93(0.08) 1.35**(0.17) 1.32***(0.07) 0.88(0.08) 1.34**(0.17) 1.26***(0.07) 0.87(0.08) 1.35**(0.17) 1.28***(0.07) 0.77***(0.07) 1.15(0.15) 1.13**(0.06) West 0.89(0.10) 1.06(0.16) 1.03(0.07) 0.88(0.10) 1.06(0.16) 1.03(0.07) 0.88(0.10) 1.06(0.16) 1.03(0.07) 0.87(0.10) 1.00(0.16) 1.00(0.07) North East 0.98(0.11) 0.95(0.11) 1.19***(0.07) 0.96(0.11) 0.96(0.11) 1.16**(0.07) 0.95(0.11) 0.98(0.11) 1.16**(0.07) 0.89(0.11) 1.00(0.12) 1.03(0.06) Type of residence Urban® Rural 1.05(0.07) 0.81**(0.07) 0.99(0.04) Constant 0.10***(0.01) 0.10***(0.01) 0.08***(0.00) 0.14***(0.02) 0.15***(0.02) 0.10***(0.01) 0.14***(0.02) 0.15***(0.02) 0.10***(0.01) 0.17***(0.03) 0.20***(0.04) 0.12***(0.01) Observations 19,414 17,593 72,377 19,414 17,593 72,377 19,414 17,593 72,377 19,414 17,593 72,377
VIENNA INSTITUTE OF DEMOGRAPHY
Working Papers
Matysiak, Anna, Tomáš Sobotka and Daniele Vignoli, The Great Recession and Fertility in Europe: A Sub-National Analysis, VID Working Paper 2/2018.
Abel, Guy, Valeria Bordone, Raya Muttarak and Emilio Zagheni, Bowling Together: Scientific Collaboration Networks of Demographers at European Population Conferences, VID Working Paper 1/2018.
Nitsche, Natalie, Partners’ Educational Pairings, Work Divisions, and Fertility: Evidence from Germany, VID Working Paper 19/2017.
Spahl, Wanda, Sabine Weiss, Judith Kohlenberger and Isabella Buber-Ennser, Immigration and the Social Welfare State in Austria, Germany, and Switzerland: A Comparative Meta-Study, VID Working Paper 18/2017.
Hoffmann, Roman, Following the Peers: The Role of Social Networks for Health Care Utilization in the Philippines, VID Working Paper 17/2017.
Brzozowska, Zuzanna and Monika Mynarska, Fertility Intentions and Their Realisation: Insights from the Polish Generations and Gender Survey, VID Working Paper 16/2017. Yildiz, Dilek, Peter G.M. van der Heijden and Peter W.F. Smith, Estimating Population Counts with Capture-Recapture Models in the Context of Erroneous Records in Linked Administrative Data VID Working Paper 15/2017.
Brzozowska, Zuzanna, Éva Beaujouan and Kryštof Zeman, Why Has the Share of Two-Child Families Stopped Growing? Trends in Education-Specific Parity Distribution in Low-Fertility Countries, VID Working Paper 14/2017.
Rengs, Bernhard, Isabella Buber-Ennser, Judith Kohlenberger, Roman Hoffmann, Michael Soder, Marlies Gatterbauer, Kai Themel and Johannes Kopf, Labour Market Profile, Previous Employment and Economic Integration of Refugees: An Austrian Case Study, VID Working Paper 13/2017.
Beaujouan, Eva and Caroline Berghammer, The Gap between Lifetime Fertility Intentions and Completed Fertility in Europe and the United States: A Cohort Approach, VID Working Paper 12/2017.
Philipov, Dimiter, Rising Dispersion in Age at First Birth in Europe: Is it related to Fertility Postponement? VID Working Paper 11/2017 and Human Fertility Database Research Report 2017-005.
The Vienna Institute of Demography Working Paper Series receives only limited review. Views or opinions expressed herein are entirely those of the authors.