A Systematic Mapping Study of Web Application Testing
Vahid Garousic,1, Ali Mesbahb, Aysu Betin-Canc, Shabnam Mirshokraieb aElectrical and Computer Engineering, University of Calgary, Calgary, Canada, [email protected]
bElectrical and Computer Engineering, University of British Columbia, Vancouver, Canada,{amesbah, shabnamm}@ece.ubc.ca cInformatics Institute, Middle East Technical University, Ankara, Turkey, [email protected]
Abstract
Context: The Web has had a significant impact on all aspects of our society. As our society relies more and more on the Web, the dependability of web applications has become increasingly important. To make these applications more dependable, for the past decade researches have proposed various techniques for testing web-based software applications. Our literature search for related studies retrieved 147 papers in the area of web application testing, which have appeared between 2000–2011.
Objective: As this research area matures and the number of related papers increases, it is important to systematically identify, analyze, and classify the publications and provide an overview of the trends in this specialized field.
Method: We review and structure the body of knowledge related to web application testing through a systematic mapping (SM) study. As part of this study, we pose two sets of research questions, define selection and exclusion criteria, and systematically develop and refine a classification schema. In addition, we conduct a bibliometrics analysis of the papers included in our study. Results: Our study includes a set of 79 papers (from the 147 retrieved papers) published in the area of web application testing between 2000-2011. We present the results of our systematic mapping study. Our mapping data is available through a publicly-accessible repository. We derive the observed trends, for instance, in terms of types of papers, sources of information to derive test cases, and types of evaluations used in papers. We also report the demographics and bibliometrics trends in this domain, including top-cited papers, active countries and researchers, and top venues in this research area.
Conclusion: We discuss the emerging trends in web application testing, and discuss the implications for researchers and practi-tioners in this area. The results of our systematic mapping can help researchers to obtain an overview of existing web application testing approaches and indentify areas in the field that require more attention from the research community.
Keywords: systematic mapping, web application, testing, paper repository, bibliometrics
Contents
1 Introduction 2
2 Related Work 2
2.1 Secondary Studies in Software Testing . . . 2
2.2 Online Paper Repositories in SE . . . 3
2.3 Secondary Studies in Web Application Testing . 3 3 Research Methodology 3 3.1 Goal and Research Questions . . . 4
3.2 Paper Selection Strategy . . . 5
3.3 Final pool of papers and the online repository . 6 4 Classification Scheme 6 5 Systematic Mapping Results 8 5.1 RQ 1.1-Types of papers by Contribution Facet . 8 5.2 RQ 1.2-Types of papers by Research Facet . . . 9
5.3 RQ 1.3-Type of Testing Activity . . . 10
5.4 RQ 1.4-Test Locations . . . 11
5.5 RQ 1.5-Testing Levels . . . 11
5.6 RQ 1.6-Source of information to derive test ar-tifacts . . . 12
5.7 RQ 1.7-Techniques to derive test artifacts . . . 12
5.8 RQ 1.8-Type of test artifact generated . . . 13
5.9 RQ 1.9-Manual versus Automated testing . . . 14
5.10 RQ 1.10-Type of the Evaluation Method . . . . 14
5.11 RQ 1.11-Static Web Sites versus Dynamic Web Applications . . . 14
5.12 RQ 1.12-Synchronicity of HTTP calls . . . 15
5.13 RQ 1.13-Client-tier Web Technologies . . . 15
5.14 RQ 1.14-Server-tier Web Technologies . . . 15
5.15 RQ 1.15-Tools presented in the papers . . . 16
5.16 RQ 1.16-Attributes of the web software SUT(s) 16 6 Demographic Trends and Bibliometrics 18 6.1 RQ 2.1-Publication trend per year . . . 18
6.2 RQ 2.2-Citation analysis and top-cited papers . 18 6.3 RQ 2.3-Most active researchers in the area . . . 19
6.4 RQ 2.4-Active nations . . . 19
6.5 RQ 2.5-Top venues . . . 20
7 Discussions 21 7.1 Findings, Trends, and Implications . . . 21
7.2 Threats to Validity . . . 22
8 Conclusions and Future Work 23
1. Introduction
The Web has had a significant impact on all aspects of our society, from business, education, government, entertainment sectors, industry, to our personal lives. The main advantages of adopting the Web for developing software products include (1) no installation costs, (2) automatic upgrade with new fea-tures for all users, and (3) universal access from any machine connected to the Internet. On the downside, the use of server and browser technologies make web applications particularly error-prone and challenging to test, causing serious dependabil-ity threats. In addition to financial costs, errors in web applica-tions result in loss of revenue and credibility.
The difficulty in testing web applications is many-fold. First, web applications are distributed through a client/server archi-tecture, with (asynchronous) HTTP request/response calls to synchronize the application state. Second, they are heteroge-neous, i.e., web applications are developed using different pro-gramming languages, for instance, HTML, CSS, JavaScript on the client-side and PHP, Ruby, Java on the server-side. And third, web applications have a dynamic nature; in many scenar-ios they also possess non-deterministic characteristics.
During the past decade, researchers in increasing numbers, have proposed different techniques for analyzing and testing these dynamic, fast evolving software systems. As the research area matures and the number of related papers increases, we feel it is important to systematically identify, analyze and clas-sify the state-of-the-art and provide an overview of the trends in this specialized field. In this paper, we present asystematic mappingof the web application testing research work.
According to Petersen et al. [47], a systematic mapping (SM) is a method to review, classify, and structure papers related to a specific research field in software engineering. The goal is to obtain an overview of existing approaches, outlining the cover-age of the research field in different facets of the classification scheme. Identified gaps in the field serve as a valuable basis for future research directions [39, 36]. Results of SM studies can also be valuable resources for new researchers (e.g., PhD stu-dents) by providing a detailed overview of a specific research area [16].
There are major differences between SM studies and system-atic literature reviews (SLR). Kitchenham et al. [39] report a comprehensive comparison of SM and SLR studies using the following seven criteria: goals, research questions, search pro-cess, scope, search strategy requirements, quality evaluation, and results. According to that report, the goal of a SM is classi-fication and thematic analysis of literature on a software engi-neering topic, while the goal of a SLR is to identify best prac-tices with respect to specific procedures, technologies, methods or tools by aggregating information from comparative studies. Research questions of a SM are generic, i.e., related to research trends, and are of the form: which researchers, how much activ-ity, what type of studies. On the other hand, research questions of a SLR are specific, meaning that they are related to outcomes of empirical studies. For example, they could be of the form: Is technology/method A better than B? Unlike a SLR [37], find-ing evidence for impact of a proposed approach is not the main
focus in a systematic mapping [47]. An SLR analyzes primary studies, reviews them in depth and describes their methodology and results. SLRs are typically of greater depth than SMs. Of-ten, SLRs include an SM as a part of their study [47]. In other words, the results of a SM can be fed into a more rigorous SLR study to support evidence-based software engineering [38].
SM studies generally consist of five steps [47] including a definition of research questions, conducting the search for rele-vant papers, screening of papers, keywording of abstracts, and data extraction and mapping, which we follow in this paper.
To the best of our knowledge, this paper is the first systematic mapping study in the area of web application testing. The main contributions of this paper are:
• A generic classification scheme for categorizing papers in the field of web application testing;
• A systematic mapping study in the field of functional test-ing of web applications, structurtest-ing related research work over the past decade by capturing and analyzing 79 in-cluded papers;
• An analysis of the demographic trends and bibliometrics in the area of web application testing;
• An online repository of the papers collected and analyzed through this systematic study.
The remainder of this paper is outlined as follows. A review of the related work is presented in Section 2. Section 3 ex-plains our research methodology and research questions. Sec-tion 4 provides the classificaSec-tion scheme we have developed for the web testing domain and the process used for construct-ing it. Section 5 presents the results of the systematic mappconstruct-ing followed by the bibliometric analysis in Section 6. Section 7 discusses the main findings, implications and trends. Finally, Section 8 concludes the paper.
2. Related Work
We classify related work into three categories: (1) secondary studies that have been reported in the broader area of software testing, (2) related online repositories in software engineering, and (3) secondary studies focusing on web application testing and analysis.
2.1. Secondary Studies in Software Testing
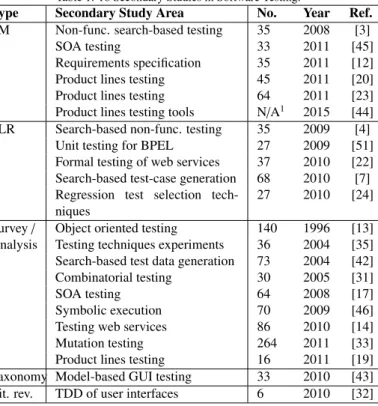
We were able to find 22 secondary studies reported, as of this writing, in different areas of software testing. We list these stud-ies in Table 1 along with some of their attributes. For instance, the “number of papers” (No.) included in each study shows the number of primary studies analyzed, which varies from 6 (in [32]) to 264 (in [33]). Our study analyzes 147 papers and includes 79 in the final pool, as described in Section 3.
We have observed that SMs and SLRs have recently started to appear in the area of software testing. We found six SMs in the area of software testing: (1) product lines testing [20, 23, 44],
Table 1: 18 Secondary Studies in Software Testing.
Type Secondary Study Area No. Year Ref.
SM Non-func. search-based testing 35 2008 [3]
SOA testing 33 2011 [45]
Requirements specification 35 2011 [12]
Product lines testing 45 2011 [20]
Product lines testing 64 2011 [23]
Product lines testing tools N/A1 2015 [44]
SLR Search-based non-func. testing 35 2009 [4]
Unit testing for BPEL 27 2009 [51]
Formal testing of web services 37 2010 [22]
Search-based test-case generation 68 2010 [7]
Regression test selection tech-niques
27 2010 [24]
Survey/ Object oriented testing 140 1996 [13]
Analysis Testing techniques experiments 36 2004 [35]
Search-based test data generation 73 2004 [42]
Combinatorial testing 30 2005 [31]
SOA testing 64 2008 [17]
Symbolic execution 70 2009 [46]
Testing web services 86 2010 [14]
Mutation testing 264 2011 [33]
Product lines testing 16 2011 [19]
Taxonomy Model-based GUI testing 33 2010 [43]
Lit. rev. TDD of user interfaces 6 2010 [32]
(2) SOA testing [45], (3) requirements specification and ing [12], and (4) non-functional search-based software test-ing [3]. There are also five SLRs in the area: (1) search-based non-functional testing [4], (2) search-search-based test-case generation [7], (3) formal testing of web services [22], (4) unit testing approaches for Business Process Execution Lan-guage (BPEL) [51], and (5) regression test selection techniques [24]. The remaining 11 studies are “surveys”, “taxonomies”, “literature reviews”, and “analysis and survey”, terms used by the authors themselves to describe their secondary studies [13, 35, 42, 31, 17, 46, 14, 33, 19, 43, 32]. Note that none of these studies is related to web application testing, which is the focus of our study.
2.2. Online Paper Repositories in SE
A few recent secondary studies have reported online repos-itories to supplement their study with the actual data. These repositories are the by-products of SM studies and will be use-ful to practitioners by providing a summary of all the works in a given area. Most of these repositories are maintained and up-dated regularly, typically every six months. For instance, Har-man et al. have developed and shared two online paper reposi-tories: one in the area of mutation testing [33, 34], and another in the area of search-based software engineering (SBSE)2[52]. We believe this is a valuable undertaking since maintain-ing and sharmaintain-ing such repositories provides many benefits to the broader community. For example, they are valuable resources for new researchers in the area, and for researchers aiming to
2This repository is quite comprehensive and has 1,020 papers as of April 2012.
conduct additional secondary studies. Therefore, we provide our mapping study as an online paper repository, which we in-ter to update on a regular basis.
2.3. Secondary Studies in Web Application Testing
Here we provide a brief overview of existing secondary stud-ies (e.g., surveys/taxonomy papers), focusing on different areas of web testing and analysis.
Di Lucca and Fasolino [21] present an overview of the dif-ferences between web applications and traditional software ap-plications, and how such differences impact the testing of the former. They provide a list of relevant contributions in the area of functional web application testing. Alalfi et al. [5] present a survey of 24 different modelling methods used in web verifica-tion and testing. The authors categorize, compare and analyze the different modelling methods according to navigation, be-haviour, and content. Amalfitano et al. [8] propose a classifica-tion framework for rich internet applicaclassifica-tion testing and describe a number of existing web testing tools from the literature by placing them in this framework. Van Deursen and Mesbah [49] describe the challenges of testing Ajax-based web applications, discuss to what extent current automated testing can be used to address those challenges, and formulate directions for future research. Marin et. al. [40] discuss the testing challenges of future web applications and provide a concise overview of cur-rent testing techniques and their limitations for testing future web applications.
All these existing studies have several shortcomings that limit their replication, generalization, and usability in structur-ing the research body on web application teststructur-ing. First, they are all conducted in an ad-hoc manner, without a systematic approach for reviewing the literature. Second, since their selec-tion criteria are not explicitly described, reproducing the results is not possible. Third, they do not represent a broad perspec-tive and their scopes are limited, mainly because they focus on a limited number of related papers.
To the best of our knowledge, there are currently no system-atic mappings or reviews for the field of web application test-ing.
3. Research Methodology
This systematic mapping is carried out following the guide-lines and process proposed by Petersen et al. [47], which has the following main steps:
• Defining research questions,
• Defining the search query and searching for papers, • Screening the retrieved papers, resulting in a set of relevant
papers,
• Keywording using abstracts, resulting in a classification scheme,
• Data extraction and mapping process, resulting in a sys-tematic map.
Initial Attributes Relevant articles found in databases (147)
Articles from specific venues Articles by browsing personal web pages
Final pool (79)
Article Selection (Section 3.3)
Attribute Identification
Classification Scheme/Map (Section 4)
Attribute Generalization and Iterative Refinement Final Map
Systematic mapping (Section 5)
Demographics of the research space
Discussions (Section 6) Discussions Systematic mapping Systematic Mapping results RQ 1 Emerging trends RQ 2 IEEE Xplore ACM Digital Library Google Scholar Microsoft Academic Search CiteSeerX Referenced articles Science Direct Application of exclusion/ inclusion criteria Bibliometrics and Demographic Analysis
Trends and Demographics (Section 6)
Implications for Research and Practice
RQ 3
Bibliometrics of the research space
RQ 2
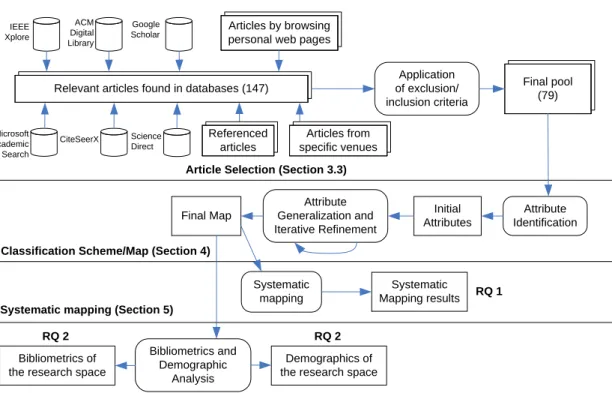
Figure 1: The research protocol used in this study.
The process that we have used to conduct this SM study is outlined in Figure 1. The process starts with article selection (discussed in detail in Section 3.2). Then, the classification scheme/map is systematically built to classify the primary stud-ies (Section 4). Afterwards, the systematic mapping itself is conducted and results are reported in Section 5. Trends and de-mographics of studies are then analyzed and reported in Section 6.
In the remainder of this section, we explain our (1) goal and research questions, and (2) paper selection strategy.
3.1. Goal and Research Questions
The goal of our study is to identify, analyze, and synthesize work published during the past ten years in the field of web application testing. We aim to (1) systematically review related scientific papers in the field in order to conduct a mapping of the area, (2) present bibliometrics and demographic analysis of the field.
Based on our research goal, we formulate two main research questions (RQ 1 and RQ 2). To extract detailed information, each question is further divided into a number of sub-questions, as described below.
• RQ 1-Systematic mapping:What is the research space of the literature in the field of functional testing and analysis of web applications? The sub-questions of this RQ are:
– RQ 1.1-Type of contribution: How many papers present test methods/techniques, test tools, test
mod-els, test metrics, or test processes? The SM guide-line paper by Petersen et al. [47] proposes the above types of contributions. Answering this RQ will en-able us to assess whether the community as a whole has had more focus on developing new test tech-niques, or, more focus on developing new test tools.
– RQ 1.2-Type of research method:What type of re-search methods are used in the papers in this area? The SM guideline paper by Petersen et al. [47] pro-poses the following types of research methods: solu-tion proposal, validasolu-tion research, and evaluasolu-tion re-search. The rationale behind this RQ is that knowing the breakdown of the research area with respect to (w.r.t.) research-facet types will provide us with the maturity of the field in using empirical approaches.
– RQ 1.3-Type of testing activity: What type(s) of testing activities are presented in the papers? Exam-ples of testing activity are: test-case design, test au-tomation, and test execution [9]. Addressing this RQ will help us gain knowledge about the type of test activities that have been more popular.
– RQ 1.4-Test location:How many client-side versus server-side testing approaches have been presented? Is it true that server-side testing has received more focus? Addressing this RQ will help us determine whether client-side or server-side testing methods have been more popular.
re-ceived more attention (e.g., unit, integration and sys-tem testing)?
– RQ 1.6-Source of information to derive test arti-facts:What sources of information are used to derive test artifacts? The term test ”artifacts” in this context denotes any type of artifacts generated and used for purpose of web-application testing, e.g., test cases, test requirements, test harness, test code, etc. Exam-ple sources of information to derive test artifacts in-clude (but are not limited to): source code (white-box testing), requirements such as models (black-box testing), invariants and web usage logs. The ratio-nale behind this RQ is that knowing the breakdown of various testing techniques w.r.t. their inputs will enable practising web developers and researchers to use the most appropriate techniques given the avail-ability of inputs in their projects.
– RQ 1.7-Technique to derive test artifacts: What techniques have been used to generate test artifacts? Examples are: requirements based testing, static code analysis, and coverage. Addressing this RQ will help practising web developers and researchers, when searching for test techniques, to select the appropriate techniques based on their web testing needs.
– RQ 1.8-Type of test artifact: Which types of test artifacts (e.g., test cases, test inputs) have been gen-erated? Similar to the above RQ’s, addressing this RQ will again help practising web developers and researchers to select the proposed techniques easily, based on their web testing needs.
– RQ 1.9-Manual versus automated testing: How many manual versus automated testing approaches have been proposed?
– RQ 1.10-Type of the evaluation method: What types of evaluation methods are used? For exam-ple, some papers use mutation analysis while some use coverage measurement to assess the applicabil-ity and effectiveness of their proposed web testing techniques.
– RQ 1.11-Static web sites versus dynamic web ap-plications:How many of the approaches are targeted at static web sites versus dynamic web applications?
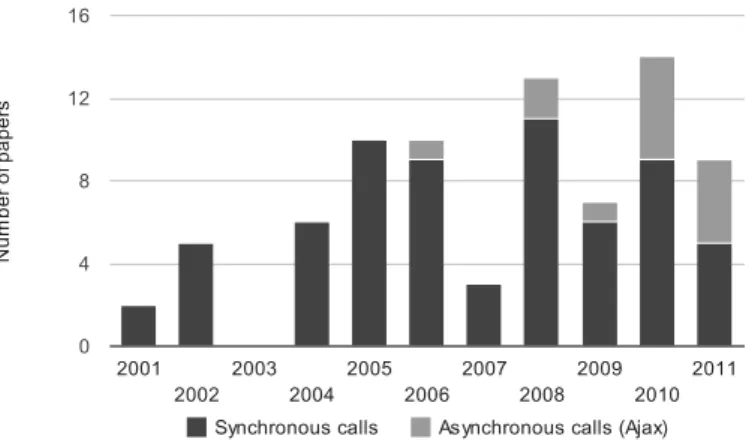
– RQ 1.12-Synchronicity of HTTP calls:How many techniques target synchronous calls versus asyn-chronous Ajax calls?
– RQ 1.13-Client-tier web technologies: Which client-tier web technologies (e.g., JavaScript, DOM) have been supported more often?
– RQ 1.14-Server-tier web technologies: Which server-tier web technologies (e.g., PHP, JSP) have been supported more often?
– RQ 1.15-Tools presented in the papers: What are the names of web-testing tools proposed and
de-scribed in the papers, and how many of them are freely available for download?
– RQ 1.16-Attributes of the web software under test:What types of Systems Under Test (SUT), i.e., in terms of being open-source or commercial, have been used and what are their attributes, e.g., size, metrics?
• RQ 2-Trends and demographics of the publications: The following set of RQs have been motivated by review-ing the existreview-ing bibliometrics studies in software engineer-ing, e.g., [48, 27, 30, 29].
– RQ 2.1-Publication count by year:What is the an-nual number of publications in this field?
– RQ 2.2-Top-cited papers:Which papers have been cited the most by other papers?
– RQ 2.3-Active researchers: Who are the most ac-tive researchers in the area, measured by number of published papers?
– RQ 2.4-Active countries:Which countries are con-tributing the most to this area, based on the affi lia-tions of the researchers?
– RQ 2.5-Top venues: Which venues (i.e., confer-ences, journals) are the main targets of papers in this field?
Sub-questions RQ 1.1–1.16 together will help us answer the first main question (RQ 1). Similarly, in order to answer RQ 2 properly, we need to address sub-questions RQ 2.1–2.5. 3.2. Paper Selection Strategy
Our paper selection strategy consists of the following activi-ties:
1. Resource selection, search query definition, and searching 2. Application of exclusion and inclusion criteria.
We explain each step subsequently below. We then, present an overview of the final pool of papers and the online repository that were produced after conducting the above activities. 3.2.1. Resource Selection and Search Query Definition
To find relevant papers, we searched the following six ma-jor online academic paper search engines: (1) IEEE Xplore3, (2) ACM Digital Library4, (3) Google Scholar5, (4) Microsoft Academic Search6, (5) CiteSeerX7, and (6) Science Direct8. These search engines have also been used in other similar stud-ies [25, 20, 3]. 3http://ieeexplore.ieee.org 4http://dl.acm.org 5http://scholar.google.com 6 http://academic.research.microsoft.com 7http://citeseer.ist.psu.edu 8http://www.sciencedirect.com 5
In order to ensure that we were including as many relevant publications as possible in the pool of papers, all authors iden-tified and proposed potential search keywords in several itera-tions. The coverage landscape of this SM is the area of func-tionaltesting of web applications, as well as (dynamic or static) analysis to support web-application testing. The set of search terms were devised in a systematic and iterative fashion, i.e., we started with an initial set and iteratively improved the set until no further relevant papers could be found to improve our pool of primary studies. By taking all of the above aspects into account, we formulated our search query as follows:
(web OR website OR ‘‘web application’’ OR Ajax OR JavaScript OR HTML OR DOM OR PHP OR J2EE OR Java servlet OR JSP OR .NET OR Ruby OR Python OR Perl OR CGI) AND (test OR testing OR analysis OR analyzing OR ‘‘dynamic analysis’’ OR ‘‘static analysis’’ OR verification)
Related papers published between 2000-2011 were included in our pool. 2000 is the year that the very first web testing pa-pers appeared. Note that the paper selection phase of this study was carried out during the Summer 2011 (May until August) and, thus, papers published by the end of that summer were included in our pool.
To decrease the risk of missing related and important publi-cations, similar to previous systematic mapping/review studies, the authors looked for:
• Related papers by browsing personal web pages of active researchers in the area;
• Related papers referenced from papers already in the pool; • Related papers from major software (e.g., TSE, ICSE, FSE, ICST, ISSTA) and web (e.g., ICWE, WSE, WWW, TWEB, TOIT) engineering research venues.
3.2.2. Exclusion and Inclusion Criteria
Since the focus on this study is on functional testing, a large number of papers that target non-functional properties, such as accessibility and performance testing or security vulnerability detection (e.g., cross-site scripting), were excluded from our study. We included papers with static analysis used an enabling technique in web application testing.
To increase the reliability of our study and its results, the au-thors applied a systematic voting process among the team mem-bers in the paper selection phase for deciding whether to include or exclude any of the papers in the first version of the pool. This process was also utilized to minimize personal bias of each of the authors. The team members had conflicting opinions on four papers, which were resolved through discussions.
Our voting mechanism (i.e., exclusion and inclusion crite-ria) was based on two questions: (1) Is the paper relevant to functional web application testing and analysis? and (2) Does
the paper include a relatively sound validation? These crite-ria were applied to all papers, including those presenting tech-niques, tools, or case studies/experiments. Each author then in-dependently answered each of the two questions for each paper. Only when a given paper received at least two positive answers (from three voting authors) for each of the two questions, it was included in the pool. Otherwise, it was excluded.
We primarily voted for papers based on their title, abstract, keywords, as well as their evaluation sections. If not enough in-formation could be inferred from the abstract, a careful review of the contents was also conducted to ensure that all the papers had a direct relevance to our focused topic. We considered all peer-reviewedpapers regardless of the venue. As such, we con-sidered papers published in journals, conference proceedings, workshops, and magazines.
Only papers written in English and only those available elec-tronically were included. If a conference paper had a more re-cent journal version, only the latter was included. We excluded papers on “web services”, because the nature of web services differs from that of web applications.
3.3. Final pool of papers and the online repository
Initially, our pool included 147 papers. After the exclusion criteria were applied, the paper pool size decreased to 79 pa-pers. The entire pool of 79 papers has been published as an online repository on the Google Docs service [26]. The inten-tion is to update the online repository at least annually to add related papers that appear in the future. Detailed classification of each paper is also available in our online repository.
4. Classification Scheme
To conduct a systematic mapping, a classification scheme (also called systematic map or attribute framework [18]) needs to be derived by a careful analysis of the primary studies [47]. Our classification scheme started with an initial version, and evolved during data extraction, through attribute generalization and iterative refinement steps. New categories were added, and existing categories were merged or split. The iterative refine-ment process was finalized and a stable final scheme was de-rived when the scheme was able to consistently categorize all the papers in the pool. This phase of our process is also de-picted in our research protocol (See Figure 1).
For this step, we collaboratively used an online spreadsheet in Google Docs to document the data extraction process. Each identified category of the classification scheme was added to the spreadsheet. When we entered the data of a paper into the scheme, we provided a short rationale why the paper should be in a certain category (for example, why/how a paper has applied evaluation research). We used the “observer triangula-tion” method in designing the classification scheme and data ex-traction (mapping) phases. Each paper was reviewed by at least two reviewers (authors of this paper) and differences of opin-ions were discussed in detail until a final decision was made. When needed, the classification scheme was also updated.
Table 2: The classification scheme developed and used in our study.
RQ Attribute Possible Types Multiple
selections
Single se-lection
RQ 1
RQ 1.1 Type of Paper-Contribution Facet {Test method/technique, Test tool, Test model, Metric, Process, Other} x RQ 1.2 Type of Paper-Research Facet {Solution Proposal, Validation Research, Evaluation Research,
Experi-ence Papers, Philosophical Papers, Opinion Papers, Other}
x RQ 1.3 Type of Testing Activity {Test-case Design (Criteria-based), Test-case Design (Human
knowledge-based), Test Automation, Test Execution, Test Evalua-tion (oracle), Other}
x
RQ 1.4 Testing Location {Client-side, Server-side} x
RQ 1.5 Testing Level {Unit, Integration, System} x
RQ 1.6 Source of information to derive Test artifacts
{Source code (white-box), Requirements and Source code (gray-box), Requirements (Models, etc), Invariants, (user) logs, Inferred Model (au-tomatic), Inferred Model (manual), Other}
x
RQ 1.7 Techniques used {Requirements based, Symbolic execution, Static code analysis, Dy-namic code analysis, Coverage, Crawling, Concolic testing, Model checking, Search-based testing, Record/playback, Model-based, Other}
x
RQ 1.8 Type of test artifact generated {Test cases, Test input (data), Test requirements (not input values), Ex-pected outputs (oracle), Test driver (code), Other}
x
RQ 1.9 Manual versus Automated testing {Manual,Automated} x
RQ 1.10 Type of the Evaluation Method {Coverage (code, model), Mutation testing (fault injection), Manual comparison, Time/performance, Detecting real faults, Example, Other}
x RQ 1.11 Static Web Sites versus Dynamic
Web Apps
{Static , Dynamic} x
RQ 1.12 Synchronicity of HTTP calls {Synchronous calls, Asynchronous calls (AJAX)} x RQ 1.13 Client-tier Web Technology {HTML, DOM, JavaScript, N/A, Unknown, Other} x
RQ 1.14 Web-server-tier Web Technology {PHP, J2EE, .NET, Ruby, Python, Perl (CGI), Java (Servlet, JSP), N/A, Unknown, Other}
x RQ 1.15 Presented tool(s) Tool name: String
Whether the tool is available for download (as reported in the paper): Boolean
RQ 1.16 Attributes of the web software SUT(s)
# of SUTs: Integer SUT names: String[] Total SUT Size in LOC: Integer
Other size metrics (e.g., # of pages, # of forms, etc): Integer[] For each SUT, SUT scale∈ {Academic experimental, Open-source, Commercial}
RQ 2
RQ 2.1 Publication year Year: Integer RQ 2.2 Number of times the paper is cited
in other papers
Number of Citations: Integer RQ 2.3 List of authors Authors: String[] RQ 2.4 Venue in which the paper has
ap-peared
Venue: String RQ 2.5 The country(ies) of the author(s)’
affiliation
Author Countries: String[]
Table 2 shows our final classification scheme along with the research questions (RQs) addressed by each attribute of the map. Attributes of our classification scheme are discussed next. The columns of the table show the research question (RQs), attributes, and possible types of the attribute. Also, the last two columns indicate whether for each of the attributes, multiple or just one type(s) can apply, respectively. For example, for RQ 1.1 (the contribution facet attribute), multiple types can be selected for the same paper. On the other hand, for the row corresponding to RQ 1.11 (static web sites versus dynamic web applications), only one type (static or dynamic) can be chosen, which is self explanatory.
We have adopted the two “type” attributes widely used in other SM studies:contribution facet, andresearch facet.
A contribution facet (corresponding to RQ 1.1) denotes the type of contribution(s) proposed in each paper and can be either: method/technique, tool, model, metric, process, or other [47]. Naturally, these contribution facets would turn to the following in our web application testing context: test method/technique, test tool, test model, test metric, and test process, respectively.
The research facet attribute corresponds to RQ 1.2. As dis-cussed by Petersen et al., research facet denotes the type of re-search approach used in each paper. We adopted the following research facets for our study:
1. Solution Proposal: A solution for a problem is proposed, which can be either novel or a significant extension of an existing technique. The potential benefits and the appli-cability of the solution is shown by a small example or a good line of argumentation.
2. Validation Research: Techniques investigated are novel and have not yet been implemented in practice. Tech-niques used are for example experiments, i.e., work done in the lab.
3. Evaluation Research: Techniques are implemented in practice and an evaluation of the technique is conducted. That means, it is shown how the technique is implemented in practice (solution implementation) and what are the consequences of the implementation in terms of benefits and drawbacks (implementation evaluation).
4. Experience Papers: Experience papers explain how some-thing has been done in practice. It has to be the personal experience of the author(s).
Papers with examples only are categorized in (1), papers hav-ing validation sections, but not in the full-scale of systematic empirical studies, are categorized in (2), if the proposed tech-nique in a study is evaluated comprehensively using systematic empirical evaluations (e.g., case study, controlled experiment), and its benefits, drawbacks, and threats to validity of the re-sults are discussed thoroughly, we categorize its research facet as (3). Papers that merely report applications or experiences in practice are categorized in (4).
The next attribute in Table 2 is the type of testing activity proposed in each paper (corresponding to RQ 1.3). In their book on software testing [9], Ammann and Offutt divide testing activities into six types as follows: (1) test-case design based on criteria (e.g., line coverage), (2) test-case design based on human knowledge (e.g., exploratory testing), (3) test automa-tion: embedding test values into executable test code (scripts), (4) test execution: running tests on the software under test and recording the results, (5) test evaluation (test oracle): evaluat-ing results of testevaluat-ing (pass/fail), a.k.a. test verdict, and report-ing results to developers, and (6) other. We found this particular classification applicable to the papers in our pool and adopted it for our classification scheme.
Thetesting locationattribute (corresponding to RQ 1.4) can be client-side and/or server-side. Some papers present testing techniques for client side aspects of web applications, and oth-ers focus merely on the server side. There are also papoth-ers that test both client and server sides.
The next attribute denotes the testing level, which corre-sponds to RQ 1.5. As it has been discussed and defined in software testing books, e.g. [9], testing level in this context de-notes, in an abstract viewpoint, the scope (granularity) of test-ing which could be: modules in isolation (unit testtest-ing), testtest-ing the integration of different modules (integration testing), or the entire software system (system testing). Conceptually, many al-ternative testing terminologies would also fall into each of the above categories, e.g., acceptance testing and even smoke test-ing fall into the system testtest-ing level.
RQ 1.6 is about the source of informationto derive test ar-tifacts (e.g., test cases): source code, requirements and source code (gray-box testing), requirements only (models, etc.), in-variants, (user) logs, inferred models (derived automatically), inferred models (derived manually), and other.
Similar to RQ 1.6, the attributes and type sets for RQs 1.7 through 1.14 in Table 2 were derived iteratively. However, we should clarify the notion of ‘test requirements’ for RQ 1.8 (type of test artifact generated). Test requirements are usually not ac-tual test input values, but the conditions that can be used to gen-erate test inputs [9]. For example, a coverage-based test tech-nique might require that a certain control-flow path of a func-tion be covered, e.g., the set of logical expressions that should be made true. By having test requirements, one can manually or automatically generate test inputs, an area of research referred to as test-data generation [41].
In RQ 1.10, we looked forevaluation methodsused in each paper. The evaluation methods we looked for included code or model coverage measurements, mutation testing, detecting real faults, and manual comparison. In addition, there were papers that provided examples and proofs of concept. One of the methods to evaluate a testing technique was measur-ing the time/performance of the testing effort. Note that, this time/performance attribute was an evaluation metric of a test-ing technique itself, andnotthe performance evaluation of an SUT by a proposed technique.
To answer RQ 1.15, we extracted the names of the web test-ingtoolspresented in each paper, and also checked whether the tool is available for download (as indicated in the paper).
For RQ 1.16, we extracted the following data regarding the web software under test (SUT) in each paper (i.e., used for vali-dation/evaluation, a.k.a. subject systems): (1) number of SUTs, (2) SUT name(s), (3) total SUT size in Lines of Code (LOC), and (4) any other size metrics when reported (e.g., number of web pages, number of web forms). The scale of each SUT was determined according to the following categorization: (a) aca-demic experimental, (b) open-source, or (c) commercial web application.
The attributes and type sets for RQs 2.1 through 2.5 relate to demographic and bibliometric information of papers and the explanations provided in Table 2 should be self-explanatory.
Building the classification scheme was an iterative process. We started with an initial version and then used attribute gen-eralization and iterative refinement, while reviewing the papers in the pool, to derive the final classification scheme. The classi-fication scheme was considered ”final” if it was able to classify all the papers properly.
After we developed the classification scheme, the papers in the pool were then classified using the scheme, i.e., the actual data extraction took place. From the final table in the spread-sheet, we were then able to calculate the frequencies of publi-cations in each category, presented in detail in Section 5.
5. Systematic Mapping Results
In this section, we present the results of our systematic map-ping study (RQ 1).
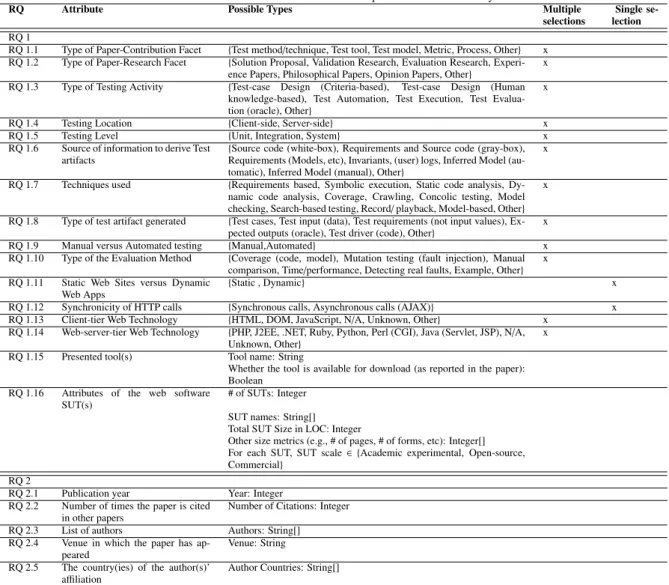
5.1. RQ 1.1-Types of papers by Contribution Facet
Figure 2 shows the distribution of the type of papers by con-tribution face, for all the 79 papers included in our study. Based on their contributions, some papers were classified under more than one facet. For example, [60] made three contributions: (1) a test method (a framework for feed-back directed testing of JavaScript applications), (2) a test tool calledArtemis, and (3) a test model (event-driven execution model). Figure 3 de-picts a histogram of the frequency of contribution facets for a single paper. Most papers presented two contribution facets, followed by only one contribution, three, and four contribution facets. There were five papers [96, 115, 74, 94, 84] that covered four facets. For example, [96] contributed: (1) a test method (automated cross-browser compatibility testing), (2) a test tool
Technique: [60, 111, 116, 104, 103, 96, 78, 54, 68, 105, 100, 88, 115, 130, 85, 117, 101, 102, 128, 72, 62, 122, 67, 75, 77, 97, 70, 66, 81, 82, 71, 99, 61, 110, 109, 56, 59, 95, 98, 131, 126, 83, 90, 74, 108, 89, 86, 58, 64, 57, 94, 84, 65, 127, 124] Tool: [60, 116, 104, 103, 96, 78, 119, 54, 53, 68, 105, 115, 130, 101, 102, 128, 72, 62, 67, 75, 77, 55, 97, 80, 61, 109, 56, 59, 98, 126, 74, 108, 86, 64, 57, 94, 84, 65, 118, 129] Test model: [125, 60, 87, 106, 96, 105, 115, 123, 85, 117, 72, 97, 66, 81, 82, 71, 99, 80, 109, 95, 90, 74, 89, 86, 64, 57, 94, 84, 124] Metric: [111, 87, 53, 115, 93, 77, 55, 99, 74, 94] Process: [96, 68, 115, 67, 108, 58] Other: [92, 120, 121, 119, 91, 112, 69, 76, 73, 79, 113]
Figure 2: Contribution facet.
calledCrossT, (3) a test model (state navigation model), and (4) a model generation process to facilitate web testing.
Figure 2 indicates that proposing new techniques or improv-ing an existimprov-ing technique has attracted the most research with 54 papers (about 68%) focusing on this aspect. Also, relatively a high proportion (about 51%) of papers (36 out of 79) pro-posed web testing tools of some sort. Section 5.15 provides an extended discussion on test tools presented in the papers. There were 11 papers which could not be categorized into the five contribution facets of our scheme, thus we categorized them un-der ‘Other’. Those papers were mainly secondary studies, such as comparison studies (e.g., [92]) or empirical studies (e.g., [120, 121]).
The annual trend of the same data is shown in Figure 4. It can be seen that in recent years, there is a focus on a mix of diff er-ent facets. In terms of time, the earliest papers in our paper pool were published in 2001. This was the time that the web started to be widely used. We notice that except for a few exceptions (in 2003, 2006, 2007 and 2009), there is a clear increase in the quantity of papers on web application testing over the past decade. The simple reason is that web application and their testing are becoming more important as time goes by. Recall from Section 3.2.1 that since the paper selection of this study was done during the Summer 2011, only papers published (or accepted for publication) by the end of Summer 2011 are in-cluded in our pool. Thus, the data for 2011 is incomplete. 5.2. RQ 1.2-Types of papers by Research Facet
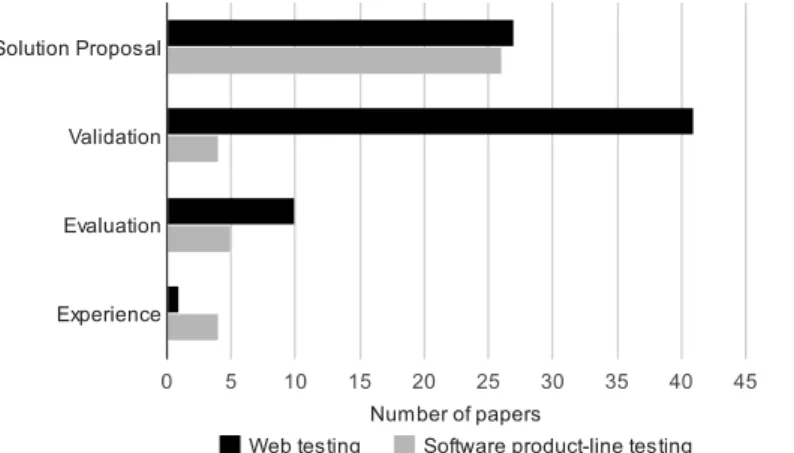
Figure 5 shows the types of papers by research facet. To pro-vide a cross-subject comparison of these facets, we have com-pared our data with the facet distribution of a related recent sys-tematic mapping which has been done in the area of software
4 3 2 1 35 30 25 20 15 10 5 0
Number of contribution facets in one paper
Frequency
Figure 3: Histogram of frequency of contribution facets per paper. 21/10/2012 Repository, SM, and Bibliometrics of WAT Papers
1/1 https://docs.google.com/spreadsheet/ccc?key=0AjWeYCv5rkkzdDBMbURET0lidzdVRnJ5NXJBVnptd…
Repository, SM, and Bibliometrics of WAT Papers All changes saved
File Edit View Insert Format Data Tools Help
$ % 123 10pt 137 138 139 140 141 142 143 144 145 146 147 148 149 150 151 152 153 154 155 156 157 158 159 160 161 162 163 164 165 166 167 168 169 170 171 172 173
Technique Tool Model Metric Process Other
2000 0 0 0 0 0 0 2001 1 1 2 0 0 0 2002 4 4 2 0 1 0 2003 0 0 0 0 0 0 2004 5 3 3 1 1 0 2005 8 4 3 0 1 1 2006 6 1 5 1 0 3 2007 1 2 0 1 0 2 2008 11 7 4 1 0 1 2009 4 3 4 1 0 1 2010 11 10 3 2 1 2 2011 6 6 4 2 2 1 Total 154
Citation Count vs Year Published
Technique Tool Model Metric Process Other
Citation count versus Year of Publication
A B C D E F G H I
Comments Share
Paper Repository after 2011-to process Charts Venue Data & Chart Related Work (survey-like) Excluded papers
Figure 4: Annual trend of papers by contribution facet. The x-axis denotes the years (2000-2011) and the y-axis is the number of papers.
product-lines testing [20]. The research in web application test-ing is dominated by solution proposals (27 papers, 34.18%) and validation studies (41 papers, 51.90%). Since there are various types and locations of faults in web applications, there exists a large body of studies proposing different testing strategies and techniques. There were also a reasonable share of papers with full-scale experimental studies (10 papers, 12.66%). Compar-ing our data to the mappCompar-ing results of the software product-lines testing literature [20], it is clear that, in terms of ratio, valida-tion and evaluavalida-tion studies are more popular in the web testing community compared to software product-lines testing. This indicates the relatively higher level of attention to empirical ap-proaches in web application testing research.
The yearly trend of research facet types is shown in Figure 6. The figure shows that in earlier years (from 2001-2006), more solution proposals with less rigorous empirical studies were published in the area. However from 2006-2011, we notice more rigorous empirical studies compared to solution-proposal-type papers. This is good news for the web testing community 9
Solution Proposal: [125, 116, 87, 104, 100, 115, 130, 107, 123, 85, 117, 122, 67, 75, 66, 82, 71, 99, 98, 73, 89, 86, 58, 64, 84, 65, 127, 129] Validation Research: [60, 111, 106, 114, 103, 96, 78, 119, 54, 53, 68, 105, 88, 93, 101, 102, 128, 72, 91, 62, 77, 55, 112, 81, 80, 61, 76, 56, 59, 95, 131, 126, 83, 90, 74, 108, 57, 79, 124, 118] Evaluation Research: [92, 120, 121, 97, 70, 69, 110, 109, 94, 113] Experience Papers: [63]
Figure 5: Research Facet.
21/10/2012 Repository, SM, and Bibliometrics of WAT Papers
Repository, SM, and Bibliometrics of WAT Papers
All changes saved
File Edit View Insert Format Data Tools Help
$ % 123 10pt 249 250 251 252 253 254 255 256 257 258 259 260 261 262 263 264 265 266 267 268 269 270 271 272 273 274 275 276 277 278 279 280 281 Solution Proposal Validation Research Evaluation Research Experience Papers Philosophical
Papers Opinion Papers Other
2000 0 0 0 0 0 0 0 2001 0 2 0 0 2002 4 1 0 0 2003 0 0 0 0 2004 4 2 0 0 2005 6 1 2 1 2006 5 4 1 0 2007 0 3 0 0 2008 3 8 2 0 2009 1 5 1 0 2010 4 8 2 0 2011 0 7 2 0 Total
Focus area of Paper (Functional) Testing 61 Static Verification (analysis) 18 Dynamic Verification (analysis) 21
Focus Area of Paper
60 80 N u m b e r o f p a p e rs Solution Proposal Validation Research Evaluation Research Experience Papers A B C D E F G H I Comments Share [email protected]
Paper Repository after 2011-to process Charts Venue Data & Chart Related Work (survey-like) Excluded papers Figure 6: Annual trend of papers by research facet. The x-axis denotes the years (2000-2011) and the y-axis is the number of papers.
as it indicates that the empirical maturity of the literature in this area is increasing as a whole. Certainly, to understand the landscape of empirical research in web testing, dedicated sys-tematic reviews focusing on empirical studies in this area, for instance similar to a recent review [6] conducted in the search-based testing community, are needed.
Furthermore, we conducted a cross analysis of number of studies in different contribution facet types versus research facet types. Figure 7 shows the results, in which the x-axis and y-axis show the different contribution facet and research facet types, respectively. For example, there are 23 studies which propose (contribute) a (test) ”technique” and their research facet type is ”solution proposal”. As we can observe, the concentration in the top left corner of the chart is the highest, denoting that majority of the works are contributing techniques or tool and are low or medium in terms of research facet maturity.
23 28 5 1 12 26 3 14 13 3 2 6 1 3 3 1 5 5 Res ea rch F acet Contribution Facet Solution Props. Validation Res. Evaluation Res. Experience Art. Philo. Art. Opinion Art.
Figure 7: Cross analysis of number of studies in different contribution facet types versus research facet types.
5.3. RQ 1.3-Type of Testing Activity
As mentioned in Section 4, we base our test activity catego-rization on the terminology proposed by Ammann and Offutt [9].
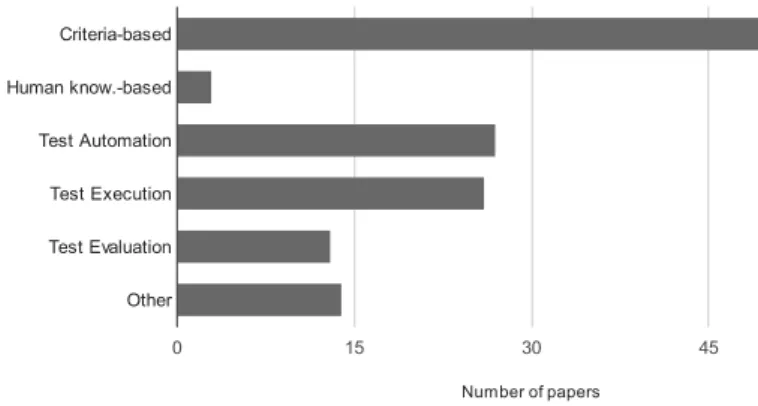
In the pool of 79 papers included in our mapping, 69 pers (87.3%) utilized code or model coverage. 50 of those pa-pers (63.3%) actually presented (coverage) criteria-based test-ing activities as seen in Figure 8. Control-flow (e.g, line, branch coverage), data flow (e.g., all uses coverage), and model/ state-based coverage (e.g, all nodes, or all paths criteria) customized for web applications have been proposed and evaluated in many papers, e.g, [125, 92].
Only three papers (3.8%) presented test-case design based on human knowledge. This type of test-case design activity is usually advocated by the exploratory testing community [50] and also context-driven school of testing [2]. Thus, it seems that there is a relatively small number of researchers using ex-ploratory testing for web applications. This is somewhat sur-prising since exploratory testing is quite popular in the software industry.
Test automation was another popular research activity as 27 papers (34.2%) address test automation. For example, 14 pa-pers (e.g., [67, 96, 71]) adopted the popular browser automa-tion toolSelenium[15] in their tools and evaluations. [94] ap-proached test automation by using another existing tool called FitNesse. In [97], an approach for generating JUnit test cases from an automatically reverse-engineered state model was pro-posed.
A large portion of the papers, i.e., 26 of 79 (32.9%), ad-dresses the test execution activity, which is merely concerned with running test cases on the software and recording the re-sults. “Test harness” is also used by some, e.g., [71] as an acronym for test execution.
The test evaluation activity is also known as the test oracle concept. 13 papers (16.5%) addressed this issue. For exam-ple, [118] presented a tool for visualization of automated test oracles and test results. [109] proposed an approach for de-10
Test-case Design (Criteria-based): [125, 92, 60, 111, 120, 87, 104, 106, 114, 103, 96, 53, 105, 100, 88, 115, 130, 123, 93, 85, 101, 128, 91, 77, 97, 70, 81, 82, 99, 61, 109, 56, 59, 95, 98, 126, 83, 90, 73, 74, 108, 89, 86, 58, 64, 57, 79, 94, 113, 124]
Test-case Design (Human knowledge-based): [67, 75, 90]
Test Automation: [92, 60, 87, 104, 103, 96, 115, 130, 93, 101, 122, 67, 75, 97, 71, 99, 109, 59, 95, 126, 89, 86, 64, 57, 84, 65, 129]
Test Execution: [92, 60, 111, 106, 114, 96, 68, 115, 130, 93, 102, 62, 122, 75, 97, 71, 61, 109, 95, 126, 108, 86, 64, 84, 65, 129]
Test Evaluation (oracle): [119, 68, 105, 115, 130, 62, 97, 66, 82, 71, 109, 86, 118]
Other: [87, 78, 54, 107, 102, 72, 91, 55, 112, 80, 76, 84, 113, 124]
Figure 8: Type of Testing Activity.
tecting and visualizing regressions in Ajax-based web applica-tions. [66] generated test oracles in the form of Object Con-straint Language (OCL) rules. [97] proposed DOM-based in-variants as test oracles. [91] presented an automated test ora-cle, which determines the occurrence of fatal failures or HTML well-formedness failures (the latter via use of an HTML valida-tor). [105] generated oracles in the context of database-driven web applications using Prolog rules.
There are also a number of papers that fall in other types of test activities than the five major types we have adopted from [9]. For instance, [87, 121, 112, 56, 127, 113] were among the works that address test suite minimization (reduction) in web applications. We also found other topics such as: repairing test data [54], testability [55], reliability and statistical testing [81], fault localization [61], and test-case prioritization [110]. 5.4. RQ 1.4-Test Locations
As far as the location is concerned, the majority of the papers have focused on testing the server-side. As Figure 9 depicts, 41 (51.9%) of the papers focus on server-side of web applications, 22 (27.8%) targets the client side, and 14 (17.7%) examine both sides.
The numbers show that both ends of web applications are getting attention from researchers. Server-side of web appli-cations usually has a database and consists of scripts or pro-grams that generate HTML code to be interpreted by the client browsers. This complexity led many researchers to examine the server-side of the applications. On the other hand, with the rise of the client-side scripting (e.g., using JavaScript) and Ajax for building Web 2.0 applications, the complexity of web clients has increased. This in turn has motivated many researchers to shift the focus on client-side analysis and testing in recent years (as shown in Figure 10).
Client-side: [92, 60, 116, 106, 96, 123, 117, 102, 67, 75, 81, 82, 69, 80, 109, 56, 95, 83, 73, 94, 65, 124] Server-side: [111, 120, 87, 121, 114, 78, 119, 54, 53, 68, 105, 100, 88, 115, 85, 101, 128, 72, 62, 122, 77, 112, 70, 99, 61, 76, 110, 59, 98, 126, 74, 108, 89, 58, 57, 79, 84, 127, 113, 118, 129] Both: [125, 104, 103, 130, 107, 93, 91, 55, 97, 71, 131, 90, 86, 64]
Figure 9: Test locations.
15 20 25 30 35 40 45 er of pa p ers (CDF) Client‐side Server‐side Both 0 5 10 15 2001 2003 2005 2007 2009 2011 Nu mb e Both
Figure 10: Annual trend for test location (Cumulative distribution function).
Details and mapping of client-tier and server-tier web tech-nologies will be discussed in Sections 5.13 and 5.14, respec-tively.
We also wanted to know whether more researchers are focus-ing towards or away from server-side versus client-side testfocus-ing. Figure 10 is a cumulative distribution function (CDF) and de-picts the annual trend for the two types of test location. We can observe from this trend that, in terms of cumulative num-bers, server-side testing papers out number the client-side test-ing papers. However, after year 2008 in terms of growth rate, the number of papers on client-side testing have been slightly higher than those on server-side testing. Quantitatively, the cu-mulative number of papers on client-side testing increased from 9 in 2008 to 22 in 2011 (a growth of 144%), while the cumula-tive number of papers on server-side testing increased from 30 in 2008 to 41 in 2011 (a growth of only 37%).
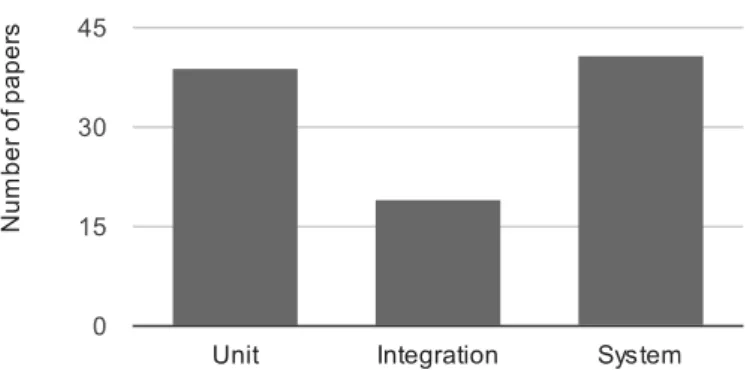
5.5. RQ 1.5-Testing Levels
To examine which test levels have received more attention, we have divided the papers into three groups: unit testing, inte-gration testing, and system testing which is usually performed 11
Unit testing: [92, 111, 104, 106, 114, 103, 96, 78, 119, 53, 123, 93, 85, 101, 128, 91, 63, 62, 67, 77, 55, 112, 97, 70, 66, 71, 80, 61, 76, 109, 56, 95, 131, 83, 74, 86, 64, 94, 113] Integration testing: [111, 104, 106, 114, 103, 54, 105, 88, 85, 117, 72, 91, 55, 71, 99, 108, 89, 86, 127] System testing: [125, 92, 60, 120, 87, 121, 96, 68, 100, 88, 115, 130, 93, 117, 102, 91, 122, 75, 55, 97, 70, 66, 81, 82, 71, 99, 110, 59, 98, 126, 90, 73, 58, 64, 57, 79, 84, 65, 124, 118, 129]
Figure 11: Testing Levels.
through a graphical user interface (GUI). The distribution is shown in Figure 11.
In this context, a ”unit” included a single HTML file, a source-code function inside a JavaScript (JS), JSP or PHP file. A paper was considered to have had a focus on web integration testing, if it addressed the problem of how to test several ”units” together, e.g., the client-server interactions of a HTML or JS file on the client with the corresponding PHP handler module on server. Last but not least, a given paper was considered to have had a focus on web system testing, if it addressed testing of a given web software from a holistic standpoint, e.g., GUI testing of a web site.
Unit testing and system testing have been almost equally popular (38% each) while integration testing has been targeted only in 24% of the papers.
Our main criteria to classify papers in these three categories were based on the coverage criteria and granularity of test ap-proaches. For example, [111] performed client-side web-page-level, statement coverage measurement. It also analysed test coverage of functions and function calls. Thus, it was mapped to unit and integration testing levels. As another example, [78] tests each HTML document separately, thus we consider that as a unit testing approach.
5.6. RQ 1.6-Source of information to derive test artifacts Figure 12 shows the distribution of the type of information sources for all the 79 papers surveyed.
37 papers (46.8%) used source code as information source to derive test artifacts. We discuss four example works [53, 100, 122, 77] next. The coverage of PHP and SQL is analyzed to de-rive test cases in [53]. [100] analyzed client code to test server code. [122] worked on HTML source code. [77] used server-side source code to derive a set of interfaces for the purpose of interface testing.
The second mostly-used source to derive test artifacts is re-quirements (17 papers, or 21.5 %), both textually and
graphi-cally represented. For example, [105] used state transition di-agrams. [81] used state transitions in unified Markov models. [57] used use-case maps (UCMs). Last but not least, [66] de-rived test cases from a formal notation called Abstract Descrip-tion of InteracDescrip-tion (ADI), a type of class diagram.
Four papers used both requirements and source code, thus following a gray-box approach. For example, in [84], properties to be verified (test oracle) were from requirements, but the test model to generate test inputs were generated from source code. The next information source was user logs (15 out of 79). For example, [124, 81] generated unified Markov models from logs and then used those models to generate test cases. [79] analyzed server access and error logs to derive navigation patterns.
User-log-based test techniques are followed by inferred mod-els, which range from state machines to UML models.
We further divided inferred models as automatically-inferred (16.5%) and manually-inferred (8.9%) models. Examples of approaches based on the automatically-inferred test models are the followings. [65] inferred a navigational model through crawling. [64, 95] reverse engineered UML models from code. [92] inferred models from execution states. As an example of approaches based on the manually-inferred test models, [90] used user reports manually, collected during the testing phase, to refine a specific test model.
Finally, invariants are used in three papers (3.7%) in our pool. [66] expected invariants to be provided in form of Object Con-straint Language (OCL) rules. [97] automatically crawled and dynamically asserted invariants on web applications. [102] de-rived DOM invariants dynamically by recording a sequence of user interactions with the application and observing the changes to the DOM tree by repeatedly replaying the sequence.
The remaining 5 papers (6.33%) used other source of infor-mation to derive test artifacts. For instance, the technique re-ported in this work [83] associated each input field of a web form with a regular expression that defines valid-input con-straints for the input field. It then applied perturbation on regu-lar expressions to generate invalid test inputs. [94] used DOM models to generate test cases.
5.7. RQ 1.7-Techniques to derive test artifacts
Figure 13 shows the distribution of the type of test-ing/analysis techniques used in the papers. It is natural that this attribute is related to a great extent to results of RQ 1.6 (i.e., source of information to derive test artifacts) with results shown in Figure 12. The reason is that since whatever source of information is used, an appropriate technique (or techniques) is (are) needed to derive the necessary test artifacts.
In general, majority of the papers used static code analysis (21 papers, 26.6%) and model-based approaches (19 papers, 24.1%) to derive test artifacts. This is also the case in Figure 12 (source of information) as source code, requirements, logs and models were the most frequent sources of information.
Crawling and requirement-based were also popular and used in 10 papers (12.7%) and 9 papers (11.4%), respectively. The remaining types of techniques used were, in order of usage: (1)
Source code (white-box): [125, 92, 60, 116, 104, 106, 103, 78, 54, 53, 68, 100, 115, 130, 107, 93, 85, 101, 128, 62, 122, 77, 55, 70, 99, 80, 61, 76, 98, 131, 74, 108, 89, 86, 84, 127, 118]
Requirements and Source code (gray-box): [117, 72, 112, 64, 84]
Requirements (Models, etc.): [92, 121, 106, 78, 105, 117, 67, 66, 81, 71, 80, 73, 86, 57, 79, 113, 124]
Invariants: [102, 97, 66]
(User) logs: [111, 120, 87, 121, 114, 54, 88, 115, 70, 81, 110, 126, 79, 113, 124]
Inferred Model (automatic): [92, 96, 75, 97, 109, 56, 95, 126, 90, 64, 94, 84, 65]
Inferred Model (manual): [81, 82, 56, 59, 90, 108, 58]
Other: [119, 61, 95, 94, 83]
Figure 12: Source of information to derive Test artifacts.
dynamic code analysis (e.g,. code coverage), (2) model check-ing, (3) record and playback, (4) concolic testcheck-ing, (5) symbolic execution, and (6) search-based techniques.
“Other” techniques in this attribute included: classification of user logs [111], agent-based [104], mutation testing [103], anti-random testing [123], and statistical/probabilistic [81] testing.
For papers using model-based techniques to derive test cases, a type of model was to be either reverse engineered for the Sys-tem Under Test (SUT) or be provided by users. These two types were referred to as “inferred model (automatic)” and “inferred model (manual)” in the previous attribute (Figure 12).
We noticed that some papers were using more than one tech-nique to derive test artifacts. We thus mapped each paper to as many types of techniques it was using. Details can be found in our online repository and mapping [26]. Figure 14 depicts the histogram of the number of techniques used in each paper. 52 papers (65.82%) used one technique only. 20 and 4 papers (25.31% and 8.86%) used two and three techniques, respec-tively. For example, [92] used three techniques (requirements based, search-based, and model-based testing) to compare web testing techniques applied to Ajax web applications in a case study context. Three papers [129, 63, 91] did not use any par-ticular technique as they were either overview papers [129], or focusing on test processes only [63], or reporting an empirical validation of a web fault taxonomy [91].
5.8. RQ 1.8-Type of test artifact generated
The distribution of generated test artifacts is shown in Fig-ure 15. The majority (49.4%) of the primary studies created (concrete) test inputs, i.e., input data or input event sequence, in their proposed approach.
The second most preferred test artifact generated was test re-quirements (27.8%). Recall from Section 4 that test require-ments are not actual test input values, but the conditions that
02/11/2012 Repository, SM, and Bibliometrics of WAT Papers
1/1 https://docs.google.com/spreadsheet/ccc?key=0AjWeYCv5rkkzdDBMbURET0lidzdVRnJ5NXJBVnptd…
Repository, SM, and Bibliometrics of WAT Papers
All changes saved in Drive
File Edit View Insert Format Data Tools Help
$ % 123 10pt 454 455 456 457 458 459 460 461 462 463 464 465 466 467 468 469 470 471 472 473 474 475 476 477 478 479 480 481 482 483 484 485 486 487 488 489 490 491 492 493 494 495 Technique used %
Static code ana. 21 26.6
Model based 19 24.1 Crawling 10 12.7 Requirement-based 9 11.4 Dynamic code ana. 8 10.1 Model checking 7 8.9 Record/ playback 7 8.9 Concolic testing 4 5.1 Symbolic exec. 2 2.5 Search-based 2 2.5 Other 11 13.9 type_of test_artifact_generated Test input (data) 39
Test requirements 19 Expected outputs 17 Test driver (code) 12
Other 13
Type of test artifact generated
Test input (data) Test requirements
Techniques used
0 5 10 15 20 25
Static code ana. Model based Crawling Requirement-based Dynamic code ana. Model checking Record/ playback Concolic testing Symbolic exec. Search-based Other Number of papers A B C D E F G H I Comments Share [email protected]
Paper Repository 4 after 2011-to process Charts Venue Data & Chart Related Work (survey-like) Excluded papers =100*B469/79
Symbolic execution: [116, 76]
Static code analysis: [106, 78, 53, 68, 100, 107, 85, 122, 77, 55, 99, 80, 95, 98, 131, 74, 89, 64, 84, 118]
Dynamic code analysis, e.g., Coverage: [125, 60, 104, 53, 130, 70, 89, 127]
Crawling: [96, 54, 93, 55, 97, 109, 56, 126, 83, 65] Concolic testing: [101, 128, 62, 61] Model checking: [106, 117, 72, 66, 98, 84] Search-based testing: [92, 94] Record/playback: [111, 114, 115, 130, 102, 75, 112] Model-based: [92, 120, 121, 54, 88, 81, 82, 71, 80, 59, 95, 126, 74, 108, 86, 58, 64, 57, 124] Other: [111, 87, 104, 121, 106, 114, 103, 115, 123, 89, 79]
Figure 13: Techniques used/proposed.
3 2 1 0 50 40 30 20 10 0
Number of techniques used in each paper
Frequency
4 20
52
3
Figure 14: Number of techniques used in each paper.
can be used to generate test inputs. For example, a coverage-based test technique would generate as test requirement the need to cover a certain control-flow path of a function, i.e., the set of logical expressions that should be made true to cover that control-flow path. By having test requirements, one can man-ually or automatically generate test inputs, an area of research referred to as test-data generation [41].
Merely 17 papers (21.5%) focused on creating expected out-puts to address the oracle problem. Generating automated test drivers (code) received the least attention (15.2%). Although current testing frameworks have built-in test drivers to set up and exercise the system/unit under test, not many proposed techniques have benefited from these frameworks to generate automated test code. Examples of papers that did leverage test-ing frameworks are [97], [57], [122] and [67], which respec-tively generate test code in JUnit, Fitnesse, Testing and Test Control Notation (TTCN), and Selenium.
Test input (data): [125, 92, 111, 120, 87, 121, 106, 114, 96, 54, 100, 88, 115, 130, 123, 93, 101, 128, 62, 67, 75, 70, 82, 99, 61, 76, 109, 56, 59, 95, 126, 83, 90, 108, 89, 86, 58, 64, 65]
Test requirements: [60, 104, 106, 103, 53, 105, 88, 85, 77, 70, 81, 80, 90, 73, 74, 79, 94, 113, 124]
Expected outputs (oracle): [96, 119, 68, 105, 115, 130, 102, 72, 62, 75, 97, 66, 82, 71, 90, 86, 118]
Test driver (code): [114, 130, 122, 67, 97, 71, 109, 95, 86, 64, 57, 129]
Other: [96, 78, 54, 107, 117, 101, 55, 112, 69, 76, 110, 98, 84, 127]
Figure 15: Type of test artifacts generated.
14 papers (17.7%) generated some other type of test artifacts. For example, [78] generated a list of interface invocations that do not match any accepted interface. [96] generated two types of web navigation graphs that are isomorphically compared to spot cross-browser defects. [55] generated testability measures. [112] generated reduced test suites and [110] generated test case orders.
In addition, we noticed that some papers generated more than one type of test artifacts. We thus mapped each paper to as many types of test artifacts as it generated. 54, 18, and 4 pa-pers (68.35%, 22.78%, and 5.06%) generated one, two, and three types of artifact, respectively. Three papers [116, 91, 63] generated no test artifacts according to our mapping: [116] presented a symbolic execution framework for JavaScript, a method which can help testing, but is not a testing activity it-self. [91] is an empirical validation of a web fault taxonomy. [63] evaluated testing processes of web-portal applications and had no need to generate test artifacts. For the details, we re-fer the interested reader to our online repository and mapping spreadsheet [26].
5.9. RQ 1.9-Manual versus Automated testing
Test automation usually reduces testing effort and therefore it is a quite popular research topic. 49 papers (62.0%) provided full automation for the test approaches they were presenting. For example, [96] presented a fully automated approach for cross-browser compatibility testing.
The techniques in 7 papers (8.9%) were fully manual. For ex-ample, [125] presented a 2-layer model (based on control flow graphs) for the white-box testing of web applications, in which the model had to be manually provided by the user (tester).
In another set of 20 papers (25.3 %), there were both manual and automated aspects (i.e., they were semi-automated). Note
Coverage (code, model): [125, 60, 111, 120, 116, 87, 104, 121, 106, 114, 53, 101, 102, 62, 77, 112, 70, 99, 76, 56, 90, 74, 108, 89, 86, 64, 94, 113]
Mutation testing (fault injection): [92, 111, 121, 114, 103, 68, 88, 115, 102, 91, 112, 70, 80, 110, 56, 95, 83, 90, 73, 74, 57, 94, 113, 118]
Manual comparison: [106, 114, 96, 78, 119, 54, 107, 93, 101, 77, 82, 99, 80, 61, 76, 109, 59, 98, 131, 126, 83, 89, 58, 127, 129]
Time/performance: [111, 78, 119, 105, 102, 97, 76, 131]
Detecting real faults: [100, 88, 128, 62, 97, 71, 69, 99, 80, 61, 83]
Example (proof of concept): [125, 85, 117, 122, 66]
Other: [111, 54, 77, 81, 109, 131, 79, 113, 124]
Figure 16: Type of evaluation method.
that the above three categories add to 76 (=49+7+20). The re-maining 3 papers in the pool [91, 63, 69] were not directly in-volved with test techniques, but with other aspects of testing web applications. For example, for [91] which presented an empirical validation of a web fault taxonomy , manual or auto-mated testing was not applicable.
5.10. RQ 1.10-Type of the Evaluation Method
We looked for methods used for evaluating proposed test-ing techniques. Our mapptest-ing includes papers that use cover-age criteria (e.g., code covercover-age or covercover-age based on a model), fault injection (a.k.a. mutation testing), and manual compari-son. The distribution of these evaluation methods is depicted in Figure 16. Coverage criteria (used in 25 papers, 31.65%) and manual comparison (used in 22 papers, 27.85%) were the most preferred approaches. Mutation testing was used in 14 pa-pers (17.72%). 36 papa-pers (45.57%) used other evaluation meth-ods to validate their proposed testing technique. For example, [81, 79, 124] each conducted a type of reliability analysis as its evaluation method. [113] used test suite size as its evaluation metric.
5.11. RQ 1.11-Static Web Sites versus Dynamic Web Applica-tions
A majority of papers (75 papers, 94.9%) investigated dy-namic web applications and only 4 (5.1%) of the papers were geared towards static web sites.
It is clear that testing dynamic web applications is a more popular area (perhaps due to being clearly more challenging) compared to testing static web sites. The handful number of papers in testing static web sites are [81, 124, 79, 82] which has been published in 2001 [81], 2006 [124, 79], and 2008 [82]. For example [81] proposed an approach for measuring and model-ing the reliability of static web sites usmodel-ing statistical testmodel-ing.