IOP Conference Series: Materials Science and Engineering
PAPER • OPEN ACCESS
Support vector machine to predict diesel engine
performance and emission parameters fueled with
nano-particles additive to diesel fuel
To cite this article: M Ghanbari et al 2015 IOP Conf. Ser.: Mater. Sci. Eng. 100 012069
View the article online for updates and enhancements.
Related content
Influence of Method of Adding Water to Combustible Mixture on Diesel Engine Performance
S N Devyanin, A V Bigaev and V A Markov
-Optimization of diesel engine performance by the Bees Algorithm
Siti Azfanizam Ahmad and Devaraj Sunthiram
-Experimental investigation of in-cylinder air flow to optimize number of helical guide vanes to enhance DI diesel engine performance using mamey sapote biodiesel
A Raj Kumar, G Janardhana Raju and K Hemachandra Reddy
Support vector machine to predict diesel engine performance
and emission parameters fueled with nano-particles additive
to diesel fuel
M Ghanbari1, G Najafi1*, B Ghobadian1, R Mamat2, M M Noor2,3* and A
Moosavian1
1Mechanics of Biosystem Engineering Department, Tarbiat Modares University,
Tehran, Iran
2Faculty of Mechanical Engineering, University Malaysia Pahang, Malaysia 3Department of Mechanical Engineering, University of Southern Queensland,
Australia
E-mail: [email protected]
Abstract. This paper studies the use of adaptive Support Vector Machine (SVM) to predict the performance parameters and exhaust emissions of a diesel engine operating on nanodiesel blended fuels. In order to predict the engine parameters, the whole experimental data were randomly divided into training and testing data. For SVM modelling, different values for radial basis function (RBF) kernel width and penalty parameters (C) were considered and the optimum values were then found. The results demonstrate that SVM is capable of predicting the diesel engine performance and emissions. In the experimental step, Carbon nano tubes (CNT) (40, 80 and 120 ppm) and nano silver particles (40, 80 and 120 ppm) with nano-structure were prepared and added as additive to the diesel fuel. Six cylinders, four-stroke diesel engine was fuelled with these new blended fuels and operated at different engine speeds. Experimental test results indicated the fact that adding nano particles to diesel fuel, increased diesel engine power and torque output. For nano-diesel it was found that the brake specific fuel consumption (bsfc) was decreased compared to the net diesel fuel. The results proved that with increase of nano particles concentrations (from 40 ppm to 120 ppm) in diesel fuel, CO2 emission increased. CO emission in diesel fuel with nano-particles was lower significantly compared to pure diesel fuel. UHC emission with silver nano-diesel blended fuel decreased while with fuels that contains CNT nano particles increased. The trend of NOx emission was inverse compared to the UHC emission. With adding nano particles to the blended fuels, NOx increased compared to the net diesel fuel. The tests revealed that silver & CNT nano particles can be used as additive in diesel fuel to improve complete combustion of the fuel and reduce the exhaust emissions significantly.
1.Introduction
A lot of studies have been conducted for predicting various engine parameters. Some of the works have concentrated on performance parameters, some of them on exhaust emissions and remaining on both of them. In these researches, spark ignition (SI) and compression ignition (CI) engines with traditional fuels and biofuels have been investigated. However, due to the development of biofuels and
3rd International Conference of Mechanical Engineering Research (ICMER 2015) IOP Publishing IOP Conf. Series: Materials Science and Engineering100(2015) 012069 doi:10.1088/1757-899X/100/1/012069
our requirements to these fuel types for reducing pollutions and saving the fossil sources, studies about them can be more useful. Most studies are based on the use of traditional artificial neural network (ANN) for prediction. For example, Sharon et al. (2012) [1] employed ANN to predict performance and exhaust emissions of a diesel engine with 8 different blends of diesel and biodiesel fuels. Cay et al. (2013) [2] experimentally investigated the use of ANN for predicting performance and emission characteristics of an engine fuelled with methanol and gasoline. The inputs of ANN were fuel type, engine speed, torque and fuel flow. In another research, Cay (2013) [3] modeled engine performance by using ANN. The used fuel was gasoline, and three parameters of specific fuel consumption, engine power and exhaust temperature were predicted. Because ANNs follow empirical risk minimization (ERM) principle, they have some drawbacks like poor generalization, greater computational burden and proneness to over fitting [4, 5].
The disadvantages cause a performance reduction in modelling. In the literature, there are a few works that have used other machine learning methods which have some advantages over ANNs. In addition, the investigation on the performance comparison of learning methods in prediction of engine parameters is limited. Hosoz et al. (2013) [6] investigated the applicability of adaptive neuro-fuzzy inference system (ANFIS) for predicting several parameters of a diesel engine fuelled with diesel and biodiesel blends. Wong et al. (2014) [4] proposed a model based on sparse Bayesian extreme learning machine (SBELM) for engine performance prediction. A comparison was made between SBELM, extreme learning machine (ELM), Bayesian ELM and back-propagated neural network (BPNN) methods. The predicted engine parameters were fuel consumption, Lambda value, HC, CO and CO2
emissions. In another research, Wong et al. (2015) presented a biodiesel engine modelling by kernel-based extreme learning machine (K-ELM). The K-ELM model was compared with least-square support vector machine (LS-SVM) model [7-16]. Previous researches using nanodiesel have been mentioned that blending the nano particles with diesel fuel improves the combustion parameters of CI engine [17-35].
In this study, support vector machine (SVM) has been employed to determine the engine power, torque, brake specific fuel consumption (bsfc), and emission components based on various diesel– biodiesel and nano particles blends and speeds. The main objective of this research is to investigate the ability of SVM for predicting engine performance parameters and exhaust emissions, and also compare their performances in modelling. In this research, the performances of SVM method were thoroughly evaluated.
2.Experimental setup
2.1. Methodology
In this study, the experiments were performed on a CI engine, 6 Cylinder. A 190 kW SCHENCK-WT190 eddy–current dynamometer was used in the experiments, specifications of diesel engine have been described in Table 1. Engine speeds varied in the range of 700-1000 rpm. Fuel consumption rate was measured in the range of 0.4–45 kg/h by using laminar type flow meter, Pierburg model. The emission parameters (CO, CO2, HC and NOx) from an online and accurately calibrated exhaust gas
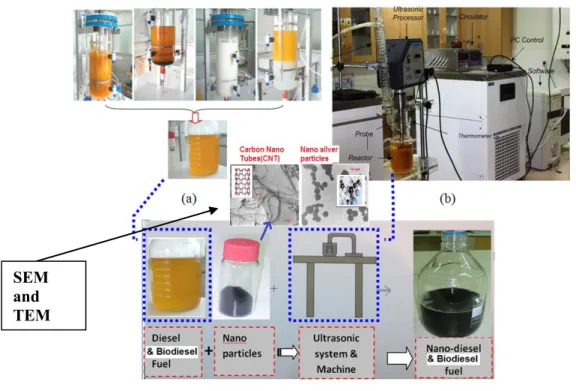
analyser AVL DIGAS 4000 were recorded (figure 1). Considering the accomplished researches about nano fuels and diesel fuel nano additives, two silver nano-particles (Ag) and carbon nano tubes (CNT) were applied as nano additives to these fuels. Furthermore based on researches conducted about the effect of concentrations of used nano-particles in reduction of exhaust emissions, in this study three concentrations (40, 80 and 120 ppm) were applied. In order to ensure the validity of nano-particles utilized in this research, SEM and TEM pictures were taken (figure 2). Stability of nano fuel was tested at standard conditions. Also the use of carbon nano tubes (CNT) and silver nano particles in neat diesel blend has the tendency to settle down at the fuel tank. An ultrasonic processor (UP400S, Hielscher, USA) was used to perform the reaction and even mixing nano-particles with diesel fuel before the engine tests. The processor operated at 400 W and 24 kHz frequency (figure 2).
3rd International Conference of Mechanical Engineering Research (ICMER 2015) IOP Publishing IOP Conf. Series: Materials Science and Engineering100(2015) 012069 doi:10.1088/1757-899X/100/1/012069
Figure 1. Engine test set-up and test instruments (a) real and (b) schematic.
Figure 2. The Set up for ultrasonic-assisted nano-diesel production process (a)reaction, (b) ultrasonic set-up and (c) nano-diesel blend.
Table 1. Main characteristics of the test engine
Engine Type CI engine, 6 Cylinder
Combustion Order 1-5-3-6-2-4
Bore ×Stroke(mm) 98.6 * 127
Displacement Volume (Lit) 5.8
Max. Torque (N.m/rpm) 376 / 1300
Max. Power(kW/rpm) 82 / 2300
In this paper, the quantity BX represents a blend consisting of X% biodiesel by volume, e.g., B20 indicates a blend consisting of 20% biodiesel in 80% diesel. Laboratory tests were then carried out using ASTM test standards to determine the fuel properties.
SEM and TEM pictures
3rd International Conference of Mechanical Engineering Research (ICMER 2015) IOP Publishing IOP Conf. Series: Materials Science and Engineering100(2015) 012069 doi:10.1088/1757-899X/100/1/012069
SVM. This is an engine simulation tool. SVM is a supervised learning method developed by Vapnik based on statistical learning theory. Nowadays, SVM is successfully used for many applications like prediction, pattern detection and classification, due to its high ability and capability in solving learning problems. SVM has good generalization ability because it follows the structural risk minimization (SRM) principle which minimizes an upper bound on the generalization error. SVM can be considered as a regressive model. Suppose a set of training data
{ , }
x t
i i,
i
1, 2,...,
n
,
d i
x R
,
i
t
R
,
where xi is input data and ti is the corresponding target value. SVM tries to estimate targetvalues by the linear equation as follows:
T
i i
y w x b
(1)
where yiis the output of SVM, w is d-dimensional vector and b is a scalar. By using a
–insensitiveloss function, the optimal linear regression function can be obtained by solving the following optimization problem. 1 1 ( ) 2 n T i i i w w C
(2) subject to0
0
i i i i i it
y
iwhere C is penalty parameter,
is a pre-specified value and
i
,
i
are slack variables representing upper and lower constraints on the output of the system. For nonlinear regression, SVM maps the input data into a high-dimensional feature space in which linear regression is performed. This is done by kernel function which is stated as K x x( ,i j)
( ). (xi
xj), where
is a nonlinear function.Hence, the estimation of SVM is obtained by the following equation.
1 ( ) ( , ) n i i i i i y
K x x b
where
i ,
i are Lagrange multipliers. The criterions used in this research are correlation coefficient (R), root mean square error (RMSE), mean relative error (MRE) and accuracy. The correlation coefficient (R) which evaluates the strength of the relationship between the experimental and predicted results is defined as:
cov( , )
( , )
cov( , ) cov( , )
a p
R a p
a a
p p
where cov(a,p) is covariance between a and p sets. a and p denotes the actual output and predicted output sets. RMSE is determined by:
(4) (3)
(5)
3rd International Conference of Mechanical Engineering Research (ICMER 2015) IOP Publishing IOP Conf. Series: Materials Science and Engineering100(2015) 012069 doi:10.1088/1757-899X/100/1/012069
2 11
n i i iRMSE
a
p
n
where n is the number of the points in the data set. MRE which indicates the mean ratio between the error and the experimental values, is obtained by:
11
(%)
100
n i i i ia
p
MRE
n
a
Accuracy which is a simple representation of prediction performance is calculated as:1
i i100
ia
p
Accuracy
a
3.Results and discussion
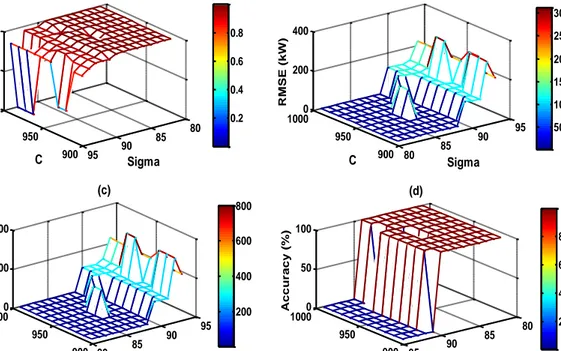
Figure 3 illustrates the performance of SVM in the brake power prediction under various numbers of the two parameters. The performance of SVM improved by increasing the training epoch. After determining the optimum numbers, the ability of SVM in prediction of the engine parameters was evaluated by calculating the criterions of correlation coefficient (R), RMSE, MRE and accuracy.
80 85 90 95 900 950 10000 0.5 1 Sigma (a) C R 80 85 90 95 900 950 10000 200 400 Sigma (b) C RMS E (k W) 80 85 90 95 900 950 10000 500 1000 Sigma (c) C MRE (%) 80 85 90 95 900 950 10000 50 100 Sigma (d) C Accuracy (%) 0.2 0.4 0.6 0.8 50 100 150 200 250 300 200 400 600 800 20 40 60 80
Figure 3. The values of the performance criterions of SVM for the brake power under changes of sigma and C: (a) R, (b) RMSE, (c) MRE and (d) Accuracy
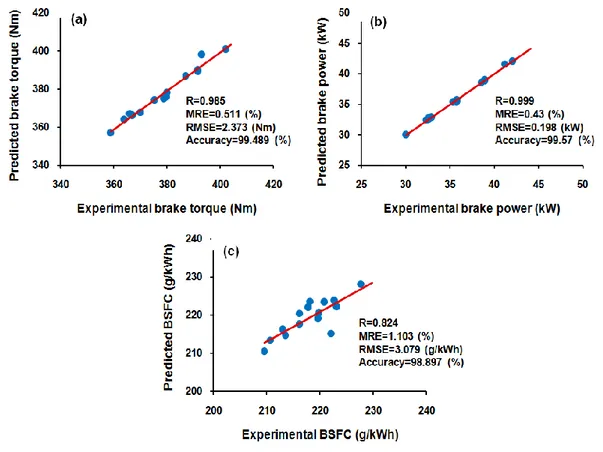
Figure 4(b) shows the predicted versus experimental values for the brake power. SVM predictions for the brake power yielded a correlation coefficient (R) of 0.999, RMSE of 0.198 kW, MRE of 0.43% and accuracy of 99.57%. SVM predictions for the engine torque yielded a correlation coefficient (R) of 0.985, RMSE of 2.373 Nm, MRE of 0.511% and accuracy of 99.489% (figure 4(a)). In predicting (6)
(7)
(8)
3rd International Conference of Mechanical Engineering Research (ICMER 2015) IOP Publishing IOP Conf. Series: Materials Science and Engineering100(2015) 012069 doi:10.1088/1757-899X/100/1/012069
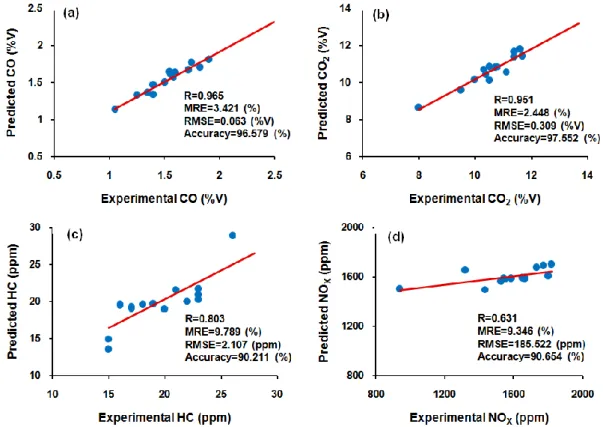
the bsfc, SVM resulted in a correlation coefficient of 0.824, RMSE of 3.079 g/kWh, MRE of 1.103% and accuracy of 98.897% (figure 4(c)). Figure 5 shows the predicted versus experimental values for the exhaust emission parameters. SVM predictions for the CO, CO2, HC and NOX yielded a
correlation coefficient (R) of 0.965, 0.951, 0.803 and 0.631, respectively. It was found that the RMSE values were 0.063 %V, 0.309 %V, 2.107 ppm and 185.522 ppm for the CO, CO2, HC and NOX,
respectively. SVM predictions for the CO yielded a MRE of 3.421% (figure 5(a)). MRE value for the CO2 was 2.448% (figure 5(b)). Figure 5(c) shows the predicted versus experimental values for the HC
with MRE of 2.107%. According to figure 5(d), MRE of the NOX was 9.346%. SVM accuracy for
prediction of the CO, CO2, HC and NOX was 96.579%, 97.552%, 90.211% and 90.654%, respectively.
The above results demonstrate that SVM can predict the exhaust emission parameters well.
Figure 4. SVM predictions for the (a) brake torque, (b) brake power and (c) BSFC versus experimental values
3rd International Conference of Mechanical Engineering Research (ICMER 2015) IOP Publishing IOP Conf. Series: Materials Science and Engineering100(2015) 012069 doi:10.1088/1757-899X/100/1/012069
Figure 5. SVM predictions for the (a) CO, (b) CO2, (c) HC and (d) NOX versus experimental values.
4.Conclusions
The results of this research study demonstrated that nanodiesel could be efficiently utilized as blended fuel in diesel engine. The produced nanodiesel was blended with biodiesel and diesel fuels in different concentrations and the CI engine performance and emission parameters were evaluated with these new blended fuels. Adding nano particles in diesel fuel can improve engine performance and reduce CO and HC emissions. But it can cause an increase in CO2 and NOX emissions. SVM can be employed to
predict the engine performance and exhaust emissions.
SVM can be employed to predict the engine performance and exhaust emissions. But there is a need for finding the optimum values of its parameters. The SVM results were very good, R values in this model are very close to one, while root mean square error (RMSE) was found to be very low. The results showed that SVM predicted the engine performance and exhaust emissions with correlation coefficient (R) and accuracy in the range of 0.66–1 and 65–99.5%. The results demonstrate that SVM is capable of predicting the CI engine performance and emissions. Analysis of the experimental data by the SVM method revealed that there is a good correlation between the SVM predicted results and the experimental data. Therefore SVM proved to be a useful tool for correlation and simulation of engine parameters.
Acknowledgements
The authors wish to thank the Iranian Fuel Conservation Organization (IFCO) of NIOC for the research grant provided (Grant no.:1393-1) and UMP (Grant No.:RDU130313) and Mega Motor Company for providing of laboratory facilities.
References
[1] Sharon H, Jayaprakash R, Sundaresan A, Karuppasamy K 2012 Fuel 99 197-203 [2] Çay Y, Korkmaz I, Çiçek A, Kara F 2013 Energy 50 177-86
[3] Cay Y 2013 Fuel 111 324-31
3rd International Conference of Mechanical Engineering Research (ICMER 2015) IOP Publishing IOP Conf. Series: Materials Science and Engineering100(2015) 012069 doi:10.1088/1757-899X/100/1/012069
[4] Wong K I, Vong C M, Wong P K, Luo J 2014 Neurocomputing [5] Tu J V 1996 Journal of clinical epidemiology 49 1225-31
[6] Hosoz M, Ertunc H M, Karabektas M, Ergen G 2013 Applied Thermal Engineering 60 24-32 [7] Wong P K, Wong K I, Vong C M, Cheung C S 2015 Renewable Energy 74 640-7
[8] Vapnik V 2013 The nature of statistical learning theory Springer Science & Business Media) [9] Widodo A, Yang B-S 2007 Mechanical Systems and Signal Processing 21 2560-74
[10] Brereton R G, Lloyd G R 2010 Analyst 135 230-67
[11] Jang J-S R 1993 Systems, Man and Cybernetics, IEEE Transactions on 23 665-85 [12] Reddy M J, Mohanta D K 2007 Electric Power Components and Systems 35 1385-407 [13] Sugeno M, Kang G 1988 Fuzzy sets and systems 28 15-33
[14] Şişman-Yılmaz N A, Alpaslan F N, Jain L 2004 Neurocomputing 61 139-68
[15] Sayin C, Ertunc H M, Hosoz M, Kilicaslan I, Canakci M 2007 Applied thermal engineering 27 46-54
[16] Widodo A, Yang B-S 2011 Expert Systems with Applications 38 8430-7 [17] Ma F, Hanna M A 1999 Bioresource technology 70 1-15
[18] Schumacher L, Peterson C, Grepen J, Fuelling direct diesel engines with 2% biodiesel blend. Written for presentation at the 2001 annual international meeting sponsored by ASAE; 2001. [19] Ghobadian B, Rahimi H, Biofuels-past, present and future perspective. International Iran and
Russian Congress of Agricultural and Natural Science Shahre-Kord University, Shahre Kord, Iran; 2004.
[20] Fukuda H, Kondo A, Noda H 2001 Journal of bioscience and bioengineering 92 405-16 [21] Lee S W, Herage T, Young B 2004 Fuel 83 1607-13
[22] Najafi G, Ghobadian B, Tavakoli T, Buttsworth D, Yusaf T, Faizollahnejad M 2009 Applied Energy 86 630-9
[23] De Caro P S, Mouloungui Z, Vaitilingom G, Berge J C 2001 Fuel 80 565-74 [24] Xing-cai L, Jian-Guang Y, Wu-Gao Z, Zhen H 2004 Fuel 83 2013-20
[25] Ghobadian B, Rahimi H, Khatamifar M, Evaluation of engine performance using net diesel Fuel and biofuel blends. The First Combustion Conference of Iran (CCT1) Tarbiat Modares University February; 2006.
[26] Elawad M, Yusaf T 2004 Journal of Energy & Environment 3 61-8
[27] Li D-g, Zhen H, Xingcai L, Wu-gao Z, Jian-Guang Y 2005 Renewable energy 30 967-76 [28] Ajav E, Singh B, Bhattacharya T 1998 Biomass and Bioenergy 15 493-502
[29] Abu-Qudais M, Haddad O, Qudaisat M 2000 Energy Conversion and Management 41 389-99 [30] Noguchi N, Terao H, Sakata C 1996 Bioresource Technology 56 35-9
[31] Gerdes K, Suppes G 2001 Industrial & engineering chemistry research 40 949-56 [32] He B-Q, Shuai S-J, Wang J-X, He H 2003 Atmospheric Environment 37 4965-71 [33] Hansen A C, Zhang Q, Lyne P W 2005 Bioresource technology 96 277-85 [34] Can Ö, Celikten I, Usta N 2004 Energy Conversion and Management 45 2429-40 [35] Ajav E, Singh B, Bhattacharya T 2000 Energy conversion and management 41 1533-41
3rd International Conference of Mechanical Engineering Research (ICMER 2015) IOP Publishing IOP Conf. Series: Materials Science and Engineering100(2015) 012069 doi:10.1088/1757-899X/100/1/012069