Thank you for downloading this document from the RMIT Research
Repository.
The RMIT Research Repository is an open access database showcasing the
research outputs of RMIT University researchers.
RMIT Research Repository:
http://researchbank.rmit.edu.au/
Citation:
See this record in the RMIT Research Repository at:
Version:
Copyright Statement:
©
Link to Published Version:
PLEASE DO NOT REMOVE THIS PAGE
Mourad, A, Scholer, F and Sanderson, M 2017, 'Language influences on tweeter
geolocation', in Proceedings of the 39th European Conference on IR Research
(ECIR 2017), Aberdeen, United Kingdom, 8-13 April 2017, pp. 331-342.
https://researchbank.rmit.edu.au/view/rmit:44686
Accepted Manuscript
Springer International Publishing AG 2017
Ahmed Mourad, Falk Scholer, and Mark Sanderson RMIT University, Melbourne, Australia
{ahmed.mourad, falk.scholer, mark.sanderson}@rmit.edu.au
Abstract. We investigate the influence of language on the accuracy of geolocating Twitter users. Our analysis, using a large corpus of tweets written in thirteen languages, provides a new understanding of the rea-sons behind reported performance disparities between languages. The results show that data imbalance has a greater impact on accuracy than geographical coverage. A comparison betweenmicro andmacro averag-ing demonstrates that existaverag-ing evaluation approaches are less appropriate than previously thought. Our results suggest both averaging approaches should be used to effectively evaluate geolocation.
Keywords: Geolocation; Language; Text-based; Tweeter
1
Introduction
Geolocating Twitter users (tweeters) is a service needed for many social media-based applications, such as finding an eyewitness to an event, managing natural crises, and personalizing regional ads. While tweeters can record their location on their Twitter profile, Hecht et al. [10] reported that>34% record fake or sarcas-tic locations. Twitter also allows tweeters to GPS locate their content, however, Han et al. [9] reported that < 1% of tweets are geotagged. Inferring tweeter location based on features derived from tweet and profile content is therefore a field of investigation, which has included examination of social network analysis [2, 18, 11], event detection [19], geographic topic modeling [1, 6], and language modeling [3, 12, 17, 22]. Only a few researchers have considered the language in which a tweet is written as a feature to geolocate a tweeter [9, 15].
Han et al. [9] observed that tweeters writing in some languages appeared to be easier to locate than those writing in others. They speculated that the geographical coverage of a language or the distribution of tweeters played an important role in determining location accuracy. So important was this role that accuracy might be largely predictable by considering language alone. However, in past work, correlations between such features and accuracy were not mea-sured, and other features that might influence accuracy were not considered. The different evaluation measures that are typically employed to measure the output of a tweeter’s geolocation system weren’t considered either.
We conduct an evaluation of the features that impact the accuracy of a state-of-the-art geolocation technique, comparing different features across thir-teen languages. Our results demonstrate the limitations of current evaluation
approaches and lead us to propose an alternative perspective and framework for the evaluation of geolocation that is more closely aligned with the range of real-world problems for which geolocation is of interest.
2
Related Work
To the best of our knowledge, only two prior works have evaluated the impact of a language on geolocating tweeters [9] and tweets [15]. Both claimed that locating tweeters/tweets writing/written in languages with restricted regional coverage were easier to geolocate than those writing in widely used languages.
Priedhorsky et al. [15] examined the effect of a language as a feature in a multilingual model trained on a dataset of 13M geotagged tweets, showing that language is a valuable feature in geolocation prediction models. However, they did not evaluate their models on a per language basis.
Using a multilingual dataset of 23M geotagged tweets, Han et al. [9] showed that training separate per language models lead to higher accuracy. Han et al. noted that for some languages, geolocation accuracy was higher than for others. To explore tweeter distribution in the geographical region of that language, the authors measured the entropy of tweeters in cities on a per language basis. However, they did not correlate entropy with an evaluation measure, neither did they examine other features of languages that might impact on evaluation.
3
Methodology
To conduct our study, we required the following: a geolocation system, collections of tweeters on which to measure location accuracy, and evaluation measures.
From the existing geolocation approaches [3, 12, 9, 17, 22], we based our work on the research that addressed language influence, namely Han et al’s system [9], which locates tweeters to one of 3,709 cities. We re-implemented the system, focusing on the part that uses Location Indicative Words (LIW) drawn from tweets, where mainstream noisy words were filtered out using their best reported feature selection method, Information Gain Ratio. Then we built a Multinomial Na¨ıve Bayes (MNB) prediction model per language using scikit-learn [14].
We employed two global tweet collections:WORLD, spanning five months from late 2011 to early 2012 [9]; andTwArchiveholding over four years of con-tent1drawn from the 1% sample Twitter public API stream. Originally WORLD contained 23M geotagged tweets and 2.1M tweeters. In reconstructing it from the tweet IDs released by the authors, 27% and 30% of tweeters and tweets, were deleted. For TwArchive, we used a 2014 subset spanning nine months.
We separated languages in the collections using langid.py2 [13]. We studied Arabic (ar), English (en), Spanish (es), French (fr), Indonesian (id), Italian (it),
1 https://archive.org/details/twitterstream&tab=collection 2
An open source language identification tool, trained over 97 languages, and tested over six European languages with an accuracy of 0.94. We accepted predictions with confidence≥0.5 only.
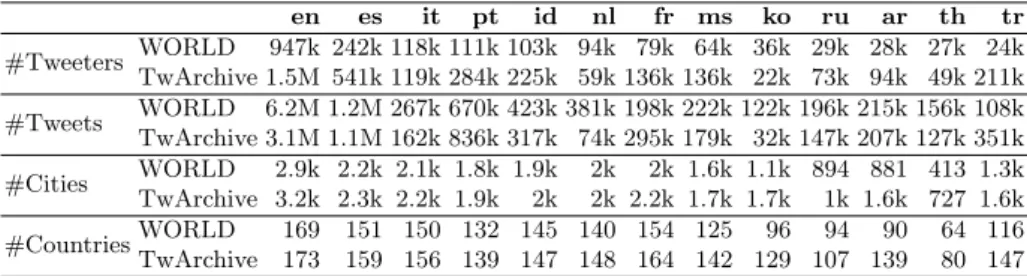
Table 1: Number of tweeters, tweets, cities and countries after preprocessing. en es it pt id nl fr ms ko ru ar th tr #Tweeters WORLD 947k 242k 118k 111k 103k 94k 79k 64k 36k 29k 28k 27k 24k TwArchive 1.5M 541k 119k 284k 225k 59k 136k 136k 22k 73k 94k 49k 211k #Tweets WORLD 6.2M 1.2M 267k 670k 423k 381k 198k 222k 122k 196k 215k 156k 108k TwArchive 3.1M 1.1M 162k 836k 317k 74k 295k 179k 32k 147k 207k 127k 351k #Cities WORLD 2.9k 2.2k 2.1k 1.8k 1.9k 2k 2k 1.6k 1.1k 894 881 413 1.3k TwArchive 3.2k 2.3k 2.2k 1.9k 2k 2k 2.2k 1.7k 1.7k 1k 1.6k 727 1.6k #CountriesWORLD 169 151 150 132 145 140 154 125 96 94 90 64 116 TwArchive 173 159 156 139 147 148 164 142 129 107 139 80 147
Korean (ko), Malaysian (ms), Dutch (nl), Portuguese (pt), Russian (ru), Thai (th), and Turkish (tr). Text was tokenised using a Twitter specific tokeniser [8]. Arabic text was normalized using Tashaphyne3 and an Arabic social media normalizer [4]. Normalization changed only the orthography of Arabic words. Use of the extra systems were necessary to reduce the sparsity of words. All non-alphabetical tokens and tokens with length<3 characters were removed.
We removed non-geotagged and duplicate tweets (using tweeter id and tweet text). Cities with fewer than fifty LIWs were removed to ensure a representative sample of words per city. Each tweeter was assigned a home city based on their geotagged tweets. We used a search library4 released by Han et al. [9] that returns either the city corresponding to a GPS coordinate, or [none]. A tweeter’s home city is the one associated with the simple majority of their tweets; in a tie, the first city is chosen. Tweeters with an unresolved home city (i.e. [none]) were removed from the corpus. Tweeters eligible for testing are required to have at least ten geotagged tweets. All previous processing steps were adopted from previous work [9] for a fair comparison, except for the Arabic normalization.
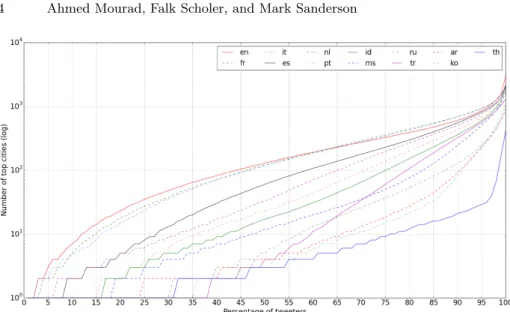
Table 1 shows that for all languages, tweeters are spread over thousands of cities and tens of countries. We found that around 25% of the tweeters in WORLD post in more than one language. The cumulative distribution (in WORLD) of tweeters over cities is shown, per language, in Figure 1. Examining where the plot lines intersect the x-axis, we see that foren, fr andit, no single city contained more than 4% of all tweeters for that language. For languages, such astr,ko,thandru, one city contained more than 30% of tweeters. A similar pattern was found when examining cumulative distributions in the TwArchive. To measure accuracy, we considered three evaluation metrics drawn from past work [3, 6, 9, 12, 17, 22]:(1) Acc, city-level accuracy;(2) Acc@161, accu-racy within 161 km (100 miles)5;(3) MedErr,median error distance between
3
http://pythonhosted.org/Tashaphyne/
4 https://github.com/tq010or/acl2013 5
Although Cheng et al. [3] showed empirically that the percentage of tweeters within
xmiles increases asx increases, e.g., 30% of tweeters are placed within 16km and 51% within 161km, all subsequent research used an arbitrarily chosen 161km. Note, Cheng et al. tested only on a US-based dataset, where the average distance between neighboring cities might be different from densely populated or small countries.
Fig. 1: Tweeters’ cumulative distribution over cities in WORLD.
Table 2: Languages rank correlation τβ between pairs of evaluation metrics.
WORLD TwArchive Acc@161 Mederr Acc@161 Mederr Acc 0.00 -0.31 0.15 0.15 Acc@161 – 0.03 – 0.13
predicted and actual cities (km). We measured the agreement of the metrics on how they rank the accuracy of our geolocation system across the tweets of each language. Kendall’s τβ was used to measure the correlation between the ranks,
see Table 2. There is no statistically significant rank correlation between any pair: the measures appear to be examining different aspects of geolocation. We therefore consider all three measures in our study.
4
Examination of Features
A range of features may influence geolocation accuracy. Although Han et al. speculated that distribution of tweeters was the reason for accuracy variation, many other differences were present in the language datasets they studied: the sets were of notably different sizes, written in different languages, and each con-tained different numbers of tweeters, tweets, and cities. Therefore, the features we explore are dataset size, a preliminary test of the impact of the language, and a range of individual features such as entropy and number of tweeters.
Accuracy within 161km might not be an effective evaluation measure from a language comparison perspective, however as it has been used in past work, we use it here.
Table 3: Influence of dataset size, in terms of the slope of a linear regression model, on the evaluation measures for six languages in TwArchive.
en es pt fr ar tr
Acc 0.02 0.06 0.07 0.04 0.03 0.01 Acc@161 0.04 0.07 0.09 0.04 0.04 0.02 MedErr -7.34 -1.17 -1.26 -0.31 -0.86 -0.10
4.1 Dataset Size
We focus on the six languages that have sufficient tweeters eligible for testing: two of which the geolocation system has low accuracy (en and fr), two with moderate accuracy (es andpt), and two with high accuracy (ar andtr). From each of the language sets, we randomly sample subsets of tweeters in decrements of 10%, from 100% down to 10%. Ten samples of each subset were created, and an average was taken. Table 3 shows that for Acc, there is a weak positive relationship between the number of tweeters and accuracy. We chose a slope, over a correlation measure, because it estimates the expected gain in accuracy with the increase in dataset size. While there is some variation across languages, the gradient of the slope is consistently small. The same pattern was found with
Acc@161, while for the MedErr, the measure tends to decrease (improve) as the number of tweeters increases. The fact that the slope of the linear regression model is greater suggests thatMedErr is more affected by the scale of the dataset than the accuracy measures. Hence, theMedErr is not an appropriate measure in the case of small datasets.
4.2 Preliminary Examination of Language
In past work, Han et al. noted that tweeters writing in some languages were easier to geolocate than those writing in others. We speculated that there may be something inherent in the way that tweets are written in each of the languages that causes the differences in geolocation accuracy. Because we had access to two collections covering the same 13 languages, we examined the relative geolocation accuracy per language across the two collections, shown in Table 4. Although the two collections vary in the number of tweeters, the previous result showed the impact of dataset scale was small. Therefore, if the language of tweets was impacting on accuracy, the relative accuracy across the two collections might be expected to be similar.
To determine the degree of agreement between the languages in the col-lections, we ranked the 13 languages by geolocation accuracy and calculated Kendall’sτβ between the two rankings. We found a statistically significant but
moderate correlation of 0.46. The relative geolocation accuracy for a language changed notably across the two collections. The low correlation strongly sug-gests that differences in geolocation accuracy across languages are influenced by a property other than the actual language of the tweets.
Table 4: Accuracy of geolocation for the 13 languages in WORLD and TwArchive.
en es pt fr ar tr id it nl ru ms th ko
WORLD 0.11 0.29 0.31 0.13 0.49 0.54 0.4 0.15 0.25 0.33 0.41 0.43 0.45 TwArchive 0.07 0.20 0.35 0.12 0.26 0.37 0.28 0.12 0.23 0.09 0.37 0.28 0.25
4.3 Correlation with Individual Features
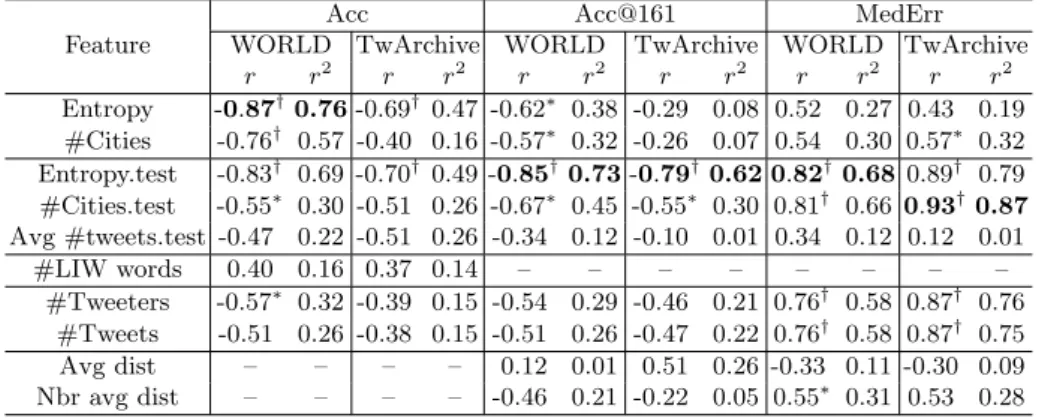
In order to measure the impact of collection and tweeter/tweet features on geolo-cation accuracy per language, we measured the Pearson Correlation Coefficient between feature values and the relative accuracy of languages. The features used were entropy of tweeters distributed across all cities and a subset of cities, the total number of cities, the total number of tweeters, the number of LIWs per language, and the number of tweets. Both collections were used. In addition to Pearson, the coefficient of determination (R2) was used to measure the explana-tory power of the model. The results are shown in Table 5.
As can be seen, entropy has the strongest correlation with all three eval-uation measures. Entropy over only the cities that had eligible test tweeters (entropy.test) was also calculated, and generally resulted in a higher correlation than entropy measured across all possible cities. For TwArchive, number of cities that had eligible test tweeters correlated strongest with MedErr.
Considering the average number of tweets per eligible test tweeter, if this number increases, accuracy should also increase, since tweeters reveal more in-formation about their location [3]. The correlations with this feature appeared to contradict past work by being negative, however, they were not significant; note that the range of tweets per tweeter here was substantially smaller than the range Cheng et al. [3] examined. The number of LIW in a lexicon normalized by the number of tweets per language was also found not to correlate strongly with accuracy. The results shown earlier on the impact of dataset size (Table 5) can also be seen here, as the number of tweeters and tweets per language correlate most strongly withMedErr, compared to the other evaluation measures.
Average distance measures were found to have a weak correlation withAcc@161. By measuring the average distance between neighboring cities, it was found to be in the range of 52–74km (significantly less than the arbitrarily chosen 161km as mentioned earlier in Section 3).
In summary, the correlation with different features showed that the distribu-tion of tweeters has a greater impact on the accuracy of geolocadistribu-tion predicdistribu-tion than other features, especially geographical coverage. This is a different result described in previous research. It also shows thatAcc@161 is not an appropriate measure.
4.4 Considering Alternative Measures
The results in the previous section showed that the distribution of tweeters across cities (entropy) is a strong predictor of the accuracy of geolocation for different
Table 5: Pearson Correlation between features and evaluation metrics; (∗and†
denote statistical significance with p≤0.05 andp≤0.01, respectively).
Acc Acc@161 MedErr
Feature WORLD TwArchive WORLD TwArchive WORLD TwArchive r r2 r r2 r r2 r r2 r r2 r r2 Entropy -0.87†0.76-0.69† 0.47 -0.62∗ 0.38 -0.29 0.08 0.52 0.27 0.43 0.19 #Cities -0.76† 0.57 -0.40 0.16 -0.57∗ 0.32 -0.26 0.07 0.54 0.30 0.57∗ 0.32 Entropy.test -0.83† 0.69 -0.70† 0.49 -0.85†0.73-0.79†0.62 0.82†0.68 0.89† 0.79 #Cities.test -0.55∗ 0.30 -0.51 0.26 -0.67∗ 0.45 -0.55∗ 0.30 0.81† 0.66 0.93†0.87 Avg #tweets.test -0.47 0.22 -0.51 0.26 -0.34 0.12 -0.10 0.01 0.34 0.12 0.12 0.01 #LIW words 0.40 0.16 0.37 0.14 – – – – – – – – #Tweeters -0.57∗ 0.32 -0.39 0.15 -0.54 0.29 -0.46 0.21 0.76† 0.58 0.87† 0.76 #Tweets -0.51 0.26 -0.38 0.15 -0.51 0.26 -0.47 0.22 0.76† 0.58 0.87† 0.75 Avg dist – – – – 0.12 0.01 0.51 0.26 -0.33 0.11 -0.30 0.09 Nbr avg dist – – – – -0.46 0.21 -0.22 0.05 0.55∗ 0.31 0.53 0.28
languages. However, the measuresAccandAcc@161 are both heavily influenced by the accuracy of the geolocation system on a limited number of cities. As long as the system geolocates correctly on a few well populated cities, the accuracy will be high.
Evaluation measures are designed to estimate how well a system will do in a particular task. In the introduction, we stated that one example use of a geoloca-tion system is finding eyewitnesses. It is perhaps worth asking if the distribugeoloca-tion of eyewitnesses needed say by a news organization will match the distribution reflected in the accuracy measure. In this section, we explore alternative mea-sures commonly used to evaluate classifiers when data is unbalanced [20]. We compare the way that different measures are affected by the different features of languages described above. First we describe the averaging methods, measures, and some default baselines to consider.
Averaging When considering data imbalance, it is important to examine dif-ferent averaging techniques: 1. Micro (µ) calculates the metric globally on absolute measures regardless of the city. This is the default averaging technique used to calculate the overall accuracy of previous geolocation prediction models. 2. Weighted (W) calculates the metric for each label and finds the average weighted by the frequency of each city in the training dataset. 3. Macro (M)
calculates the metric for each city and finds their unweighted mean. It is the most appropriate for evaluating how classifiers behave on cities with a small number of tweeters, rather thanmicro averaging, which is influenced by big cities.
Measures Although Precision (P) and recall (R), together with different av-eraging techniques, are the most common measures used in text categorization to evaluate the effectiveness of classifiers [20, 23], they were never considered in prior tweeter geolocation work [2, 3, 6, 9, 17, 22]. Sometimes precision is favored
Table 6: Comparison between Majority Class (MC) and Multinomial Na¨ıve Bayes (MNB) models, in terms ofmicro precision (Pµ) andmacroprecision (PM), for
the top 13 languages in WORLD.
en es pt fr ar tr id it nl ru ms th ko
MCPµ 0.02 0.12 0.23 0.10 0.39 0.54 0.27 0.09 0.16 0.34 0.25 0.32 0.45
MNBPµ 0.11 0.29 0.31 0.13 0.49 0.54 0.40 0.15 0.25 0.33 0.41 0.43 0.45
MCPM 0.000 0.000 0.001 0.000 0.004 0.007 0.002 0.000 0.003 0.003 0.002 0.008 0.006
MNBPM 0.047 0.027 0.036 0.033 0.059 0.027 0.079 0.018 0.077 0.006 0.086 0.267 0.046
(e.g. when journalists are looking for eyewitnesses within a specific city [5]); at other times recall (e.g. when journalists are looking for eyewitnesses on the ground and want to increase the search pool because eyewitnesses are rare in that case [21]). Both scenarios focus on a single location.
Baselines Yang [23] pointed out that in the case of a very low average training instances per category (which applies here) the majority class trivial classifier
tends to outperform all non-trivial classifiers. We therefore start by comparing our geolocation system against the Majority Class (MC) baseline.
Results The first row of Table 6 shows that Pµ of MC for languages with the
majority of tweeters originating from one city tend to match or outperform the MNB classifier, i.e.tr, ru andko, in the WORLD data collection. For instance, a MC model for tweeters posting in Russian would fail to predict the location of any tweeter outside Moscow, although 70% of the tweeters are located in other cities (inside and outside Russia). The same pattern applies to TwArchive with one more biased language, than WORLD: Thai (th).
To evaluate classifiers at the level of each city, rather than overall perfor-mance, we compare precision based on macro averaging in the last two rows of Table 6. In contrast toPµ,PM shows that MNB classifiers outperform the MC
for all languages.
While the result of the MC is obvious for languages like tr, ru and ko at the high end of the range ofPµ, given the data imbalance for such languages as
shown in Figure 1, it doesn’t reflect the influence of imbalance on other languages like en,fr andit at the low end of the range, with other languages in between. To address this problem, we comparePµ, toPM, which shows an expected drop
in performance in Table 6. In the case ofru, an MNB geolocation model would have a high accuracy of 33%, while having a poor average precision on the level of each city (0.6%). This contrast between micro-macro indicates the measures evaluate geolocation from different perspectives.
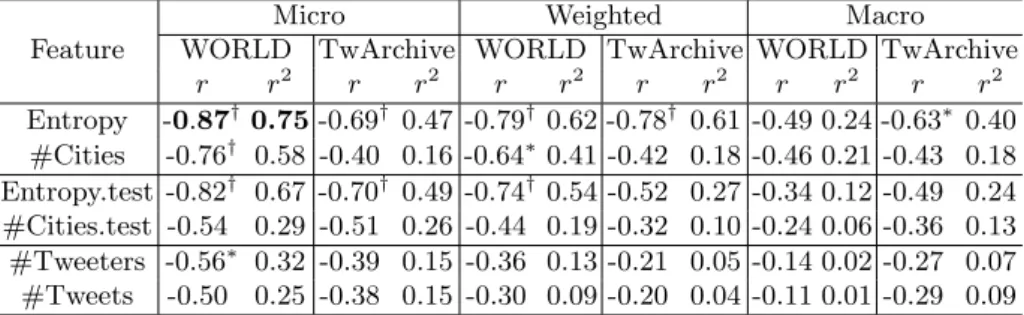
Correlation with Individual Features Entropy was shown to have the high-est correlation with Acc compared to other features. Here, we measure the cor-relation between the proposed alternative measures, using different averaging
Table 7: Correlation between features and precision using different averages; (∗ and†) denote statistical significance with p≤0.05 andp≤0.01, respectively.
Micro Weighted Macro
Feature WORLD TwArchive WORLD TwArchive WORLD TwArchive
r r2 r r2 r r2 r r2 r r2 r r2 Entropy -0.87† 0.75-0.69† 0.47 -0.79† 0.62 -0.78† 0.61 -0.49 0.24 -0.63∗ 0.40 #Cities -0.76† 0.58 -0.40 0.16 -0.64∗0.41 -0.42 0.18 -0.46 0.21 -0.43 0.18 Entropy.test -0.82† 0.67 -0.70† 0.49 -0.74† 0.54 -0.52 0.27 -0.34 0.12 -0.49 0.24 #Cities.test -0.54 0.29 -0.51 0.26 -0.44 0.19 -0.32 0.10 -0.24 0.06 -0.36 0.13 #Tweeters -0.56∗ 0.32 -0.39 0.15 -0.36 0.13 -0.21 0.05 -0.14 0.02 -0.27 0.07 #Tweets -0.50 0.25 -0.38 0.15 -0.30 0.09 -0.20 0.04 -0.11 0.01 -0.29 0.09
Table 8: Languages rank correlationτβfor micro (µ), weighted (W), and macro
(M) averaging; (∗ and†) denote statistical significance with p≤0.05 andp≤
0.01, respectively.
(a) Across averaging techniques Precision Recall WORLD TwArchive WORLD TwArchive
W M W M W M W M
µ 0.41†-0.08 0.38 0.08 1.00†0.08 1.00† 0.15
M 0.00 – 0.08 – 0.05 – 0.15 –
(b) Across data collections Precision Recall
µ W M µ W M
0.46∗0.13 0.00 0.46∗0.49∗0.03
techniques, and the same set of features, excluding the poor ones. Correlations for the two data collections (WORLD and TwArchive) are displayed in Table 7. Themicro columns are analogous to accuracy reported earlier in Table 6.
In contrast toAcc andPµ, entropy is not as strong an indicator of how well
a geolocation model performs on the macro level. The moderate insignificant correlation between entropy andPM aligns with the fact thatmacro-averaging
should be independent of the distribution of tweeters across cities, i.e. all cities are treated uniformly.Macro-averaging generally has the lowest correlation with the different features. The same pattern applies to recall.
From a language perspective, we observed that the ranking of languages differs from one averaging technique to another and also from precision to recall. For instance, on the level ofmicro-macroprecision,thremained among the top ranks while tr dropped to the bottom behind en. To measure the degree of agreement, we measured theτβ correlations for all direct combinations of data
collection, precision, recall,micro,weighted andmacro, see Table 8.
Forprecision, themicroandweightedaverages have a statistically significant, but moderaterank correlation in WORLD. In contrast, the microandweighted
averages forrecall coincide, in both data collections.Micro andmacroaverages did not have a significant rank correlation. Finally, at the level of data collections,
micro (precision and recall), andweighted recall have a statistically significant, albeit moderate, rank correlation.
The difference in precision betweenmicroandmacroaveraging suggests that all languages are affected by the data imbalance.Micro averaging is biased to-wards big cities, whilemacroaveraging assumes that all cities contribute equally to the metric. Some languages are still easier than others, but not because they are the only languages biased towards a small set of cities, and/or their usage is geographically limited to a specific region. All languages have a bias towards a small number of big cities; the difference between languages like en and fr
compared toru andtr is the number of big cities. For instance, the top 10 cities foren andfr in WORLD have a comparable number of tweeters (1–4%) of the total number, while the top city inru andtr has more than 30% of tweeters and the second city drops down to less than 10% of tweeters.
In the end, the choice of which averaging technique to use in taking decisions depends on the application. However in the general case, we recommend using theweightedaverage instead ofmicrobecause it limits the dominance of big cities while maintaining their importance. At the same time, it reduces the potentially misleading evaluation when comparing languages.
5
Conclusion
We studied features that might influence the accuracy of a system that geolocates tweeters. Examining two large collections of tweets covering thirteen languages, we found substantial variation in accuracy across languages, a result that has been observed before but not studied or explained.
Our study is the first to show that the distribution of tweeters over cities is strongly correlated to accuracy. Past work suggested that the geographical coverage of a language may also be a factor, however, all the languages we studied were found to have a global coverage.
Our results can be used to influence future test set design. The scale of a test set was found to have little influence on accuracy. However, the distribution of tweeters was a strong influence. Although a geolocation system could potentially ground tweeters to one of few thousand cities, the skewed distribution present in the test sets meant that accuracy was influenced by only a few tens of cities. Current testing approaches are not as geographically broad ranging as one might imagine or expect. A consequence of the current testing regime is that a simplistic baseline, which grounds to one city per language, was measured to be as accurate as a state of the art system for more than one language.
To overcome such dataset limitations, we proposed usingmacro averaging. The contrast between it and micro averaging revealed that data imbalance af-fects all languages, even one that is extensively used, such as English. Our anal-ysis demonstrated that reporting both micro and macro averaging, or using a
weighted average, provides valuable additional insight.
For future work, we will consider evaluating other geolocation inference tech-niques from a language perspective, making use of a wide range of open source
frameworks. For instance, Wing and Baldridge [22] demonstrated that prob-abilistic language models and hierarchical logistic regression outperform LIW and text-categorisation for English, but on a different representation of loca-tion (i.e. not cities). Jurgens et al. [11] released a framework for nine different network-based geolocation systems. Recently, Rahimi et al. [16] explored using a hybrid text and network based approach.
This work was originally motivated by studying the lexical variations of lan-guages and their impact on geolocating tweeters. A simple feature represented by the number of LIW per language, due to the lack of enough resources, was found to have no impact. It was hard to assess the richness of the vocabulary associated with the different languages (English is the pivot), or dialects within the same language (no definitive list of dialects per language). Gon¸calves and S´anchez [7] showed that Spanish varieties can be recognized in Twitter and categorized into regions covering urban cities versus rural areas and small towns. However, they acknowledged that English and Chinese are problematic. We consider focusing on Spanish as a starting point for such analysis.
Considering the data imbalance problem, we intend to explore building test sets that are more geographically balanced through geographically stratified sam-pling. We will also examine representing location using grids, which might lead to a more balanced distribution of tweeters. The evaluation, however, would be challenging because each representation would have a different set of classes (cities vs. grids).
A large number of parameters, including the error distance with a specific range (i.e. 161km), and the threshold of the number of tweeters to represent a location, were found to be arbitrarily chosen in past work. We plan to estimate the optimal values for those parameters and develop more robust evaluation metrics for dynamic values as a step towards training language independent geo-inference models.
Acknowledgments.This work was made possible by NPRP grant# NPRP 6-1377-1-257 from the Qatar National Research Fund (a member of Qatar Foun-dation). The statements made herein are solely the responsibility of the authors. We thank the anonymous reviewers for their careful reading of our manuscript and their many insightful comments and suggestions.
References
1. A. Ahmed, L. Hong, and A. J. Smola. Hierarchical geographical modeling of user locations from social media posts. InProc of WWW, pages 25–36, 2013.
2. L. Backstrom, E. Sun, and C. Marlow. Find me if you can: improving geographical prediction with social and spatial proximity. InProc of WWW, pages 61–70, 2010. 3. Z. Cheng, J. Caverlee, and K. Lee. You are where you tweet: a content-based
approach to geo-locating twitter users. InProc of CIKM, pages 759–768, 2010. 4. K. Darwish, W. Magdy, and A. Mourad. Language processing for arabic microblog
5. N. Diakopoulos, M. De Choudhury, and M. Naaman. Finding and assessing social media information sources in the context of journalism. InProc of SIGCHI, pages 2451–2460, 2012.
6. J. Eisenstein, B. O’Connor, N. A. Smith, and E. P. Xing. A latent variable model for geographic lexical variation. InProc of EMNLP, pages 1277–1287, 2010. 7. B. Gon¸calves and D. S´anchez. Crowdsourcing dialect characterization through
twitter. PloS one, 9(11):e112074, 2014.
8. B. Han and T. Baldwin. Lexical normalisation of short text messages: Makn sens a# twitter. InProc of ACL, pages 368–378, 2011.
9. B. Han, P. Cook, and T. Baldwin. Text-based twitter user geolocation prediction.
Journal of Artificial Intelligence Research, pages 451–500, 2014.
10. B. Hecht, L. Hong, B. Suh, and E. H. Chi. Tweets from justin bieber’s heart: the dynamics of the location field in user profiles. InProc of SIGCHI, pages 237–246, 2011.
11. D. Jurgens, T. Finethy, J. McCorriston, Y. T. Xu, and D. Ruths. Geolocation prediction in twitter using social networks: a critical analysis and review of current practice. InProc of ICWSM, 2015.
12. S. Kinsella, V. Murdock, and N. O’Hare. I’m eating a sandwich in glasgow: mod-eling locations with tweets. In Proc of the 3rd International Workshop on Search and Mining User-generated Contents, pages 61–68, 2011.
13. M. Lui and T. Baldwin. langid. py: An off-the-shelf language identification tool. InProc of ACL, pages 25–30, 2012.
14. F. Pedregosa, G. Varoquaux, A. Gramfort, V. Michel, B. Thirion, O. Grisel, M. Blondel, P. Prettenhofer, R. Weiss, V. Dubourg, et al. Scikit-learn: Machine learning in python. The Journal of Machine Learning Research, 12:2825–2830, 2011.
15. R. Priedhorsky, A. Culotta, and S. Y. Del Valle. Inferring the origin locations of tweets with quantitative confidence. InProc of CSCW, pages 1523–1536, 2014. 16. A. Rahimi, T. Cohn, and T. Baldwin. pigeo: A python geotagging tool.Proceedings
of ACL-2016 System Demonstrations, pages 127–132, 2016.
17. S. Roller, M. Speriosu, S. Rallapalli, B. Wing, and J. Baldridge. Supervised text-based geolocation using language models on an adaptive grid. InProc of EMNLP, pages 1500–1510, 2012.
18. A. Sadilek, H. Kautz, and J. P. Bigham. Finding your friends and following them to where you are. InProc of WSDM, pages 723–732, 2012.
19. T. Sakaki, M. Okazaki, and Y. Matsuo. Earthquake shakes twitter users: real-time event detection by social sensors. InProc of WWW, pages 851–860, 2010. 20. F. Sebastiani. Machine learning in automated text categorization.ACM computing
surveys (CSUR), 34(1):1–47, 2002.
21. K. Starbird, G. Muzny, and L. Palen. Learning from the crowd: collaborative fil-tering techniques for identifying on-the-ground twitterers during mass disruptions. InProc of ISCRAM, 2012.
22. B. Wing and J. Baldridge. Hierarchical discriminative classification for text-based geolocation. InProc of EMNLP, pages 336–348, 2014.
23. Y. Yang. An evaluation of statistical approaches to text categorization. Informa-tion retrieval, 1(1-2):69–90, 1999.