Components of Disaster Tolerant Computing:
Analysis of Disaster Recovery, IT Application
Downtime & Executive Visibility
Chad M. LAWLER
Sr. Principal Consultant & IT Solutions Architect Data Return, LLC Irving, TX 75039, U.S.A. [email protected] Michael A. HARPER Critical Infrastructure Protection Center, SPAWAR
Systems Center Charleston Department of the Navy North Charleston, South Carolina 29419, U.S.A. [email protected]
Stephen A. SZYGENDA
Cecil H. Green Chair in Engineering Management, Information, and Systems Department, Southern Methodist University Dallas, Texas 75275, U.S.A. [email protected]
Mitchell A. THORNTON
Department of Computer Science and Engineering, Southern Methodist University Dallas, Texas 75275, U.S.A. [email protected]
SMU School of Engineering, Box 750335, Dallas, TX 75275-0335
http://engr.smu.edu/emis/disastertolerant
ABSTRACT
This paper provides a review of disaster tolerant Information Technology (IT). The state of traditional disaster recovery approaches is outlined. The risks of IT application downtime attributable to the increasing dependence on critical information technology operating in
interdependent, interacting complex
infrastructure systems is reviewed. General disaster tolerance techniques are summarized. While content specific approaches currently undertaken to understand and avoid cascading failures in systems are extant, opportunities exist to extend this complex systems independence analysis to the private business sector in the form of disaster tolerance. The high level of
complexity of relationships between IT
application availability and numerous secondary and tertiary affects of a disaster on systems that are dependent on other systems for availability has not yet been fully explored.
Keywords: Disaster Tolerance, Disaster
Tolerant Computing and Communications, Criticality Driven, Secondary, Tertiary, Affects,
Interdependent Interacting, Complex
Infrastructure Systems Survivability, Application Downtime, Disaster Recovery, DR, Business Continuity Planning, BCP
1. INTRODUCTION & BACKGROUND A disaster is an event that can cause system-wide malfunction or outage as a result of one or more failures within a system which may be caused by a point failure or by a plurality of
single-points of failure that occur either simultaneously or nearly simultaneously by either a man-made or natural event. A cascading failure resulting from a disaster may be characterized as a series of system outages, such that an initial disturbance causes one or more dependent system outages [1, 2]. A catastrophe, characterized as a series of cascading failures caused by an initial disruption, can occur as the result of the occurrence of a disaster [2, 3]. Disaster Tolerance (DT) in computing and communications systems refers to the ability of infrastructure, IT systems, communications infrastructure and business or organizational processes that depend on these systems, to maintain functionality throughout the occurrence of a disaster. The goal of Disaster Tolerance is to provide an ability to continue operations uninterrupted despite occurrence of a disaster that would normally interrupt organizational operations where critical business functions and technologies continue operations, as opposed to resuming them. Disaster tolerance is a superset of fault tolerance methods in that a disaster may occur which causes rapid, almost simultaneous, multiple points of failure in a system that escalate into a wide catastrophic system failures. Models for disaster tolerance differ from those for fault tolerance since they assume that failures can occur due to massive numbers of individual faults, as well as a single point of failure [2]. Critical infrastructures, such as power networks, display many of the characteristic properties of complex systems. Some research indicates portions of this behavior are caused by different
components of systems interacting with each other. While complex infrastructure systems can exhibit these characteristics, more recent research indicates the individual infrastructure systems interact with each other in even more complex fashions, which can lead to increased or decreased risk of failure in the individual systems [4]. This relationship risk analysis between interdependent interacting infrastructure systems has direct applicability to a criticality approach to disaster tolerance [3, 6].
2. RECENT DISASTERS & THE STATE OF DISASTER RECOVERY
Businesses and organizations that adopt redundancy-based approaches traditionally rely on Disaster Recovery (DR) techniques to protect critical systems. Disaster Recovery, a subset of Business Continuity Planning (BCP), is a closely related term used to describe methodologies to create and execute a plan for how an organization will resume partially or completely
interrupted information technology,
organizational, or business critical functions within a predetermined time after a disaster or disruption has occurred. Effective Disaster Recovery and Business Continuity Planning should identify the impacts of the loss of a critical business facility, resource or process in the event of an unplanned outage with the specific intent of identifying required recovery timeframes and resources [16]. Disaster Recovery and Business Continuity Planning efforts specifically target reducing operational risk and therefore overlap with traditional risk management practices. DR and BCP commonly utilize IT services and applications along with fault tolerant systems and methodologies to help achieve recovery or continuity [10].
In traditional DR & BCP plans, attention is commonly given to contingencies for natural disasters such as hurricanes, tornados, floods, and earthquakes. However, a disaster may be any event that prevents a business from accessing necessary data and systems to conduct normal business operations. In the past, it may have been acceptable to assign a very low probability to the risk of major disaster occurrence. However, with the rising potential for terrorist activity, this assumption is no longer the case [10].
The terrorist events of September 11, 2001 and the US Northeast power outage of August, 2003,
combined with Hurricane Katrina of 2005, provide recent examples of devastating man-made disasters and massively destructive natural disasters in the US. Some firms affected by the September 11, 2001 attacks, who did have well-developed and thoroughly tested Business Continuity Plans in place were able to recover partial business operations within several days of the terrorist attack. However, many of these businesses have still not fully recovered six years after the event [11].
Cascading failures in electrical power networks cause massive power failures, blackouts, which
lead to severe economic and social
consequences. Cascading failures are typically initiated by a set of system outages that cause operating constraint violations. When violations persist in a network they can trigger additional outages which in turn may cause further violations [10]. Research shows that the probability of large power blackouts can have
very high or even infinite expected
consequences. Specifically related to power outages, the probability of a cascading failure increases as transmission system loading increases while the probability goes through a sharp phase transition [3, 5]. It is also appears that cascading power failures propagate by relays acting in response to operation constraint violations, which often persist for relatively significant amounts of time before triggering a relay response. While the 1996 western US blackout progressed fairly quickly, 3 the system endured overloads on the western transmission corridor for 22 seconds after the initial disturbance, before a rapid sequence of relay actions commenced [4]. In a disaster scenario, such as the destruction of a major private commercial building, cascading failures occur in rapid, multiple successions, propagating to vast amounts of business systems, which in turn cause even further cascading system failures.
Despite September 11th and the Northeast power
outage of August, 2003, surprisingly few areas of the commercial business sector have demonstrated a similar significant change in disaster preparedness, recovery or business continuity planning [11]. Survey data suggests that top business executives are not focused on Disaster Recovery or Business Continuity Planning. According to survey data from Harris Interactive and SunGard Availability, the majority of US business executives believe their
companies are in fact less prepared to deal with a disaster than in years prior to 2005 [11].
Data from studies on September 11 indicates that 9-11 has in fact had relatively little effect on the spending patterns of US mid-sized business on proactive preparedness activities such as protection and security. The Conference Board released a 2005 report on corporate security practices, sponsored by the US Department of Homeland Security, based on a survey of chief executives and other top officers in a wide range of mid-sized US companies (with annual revenues of between $20 million and $1 billion). Data from this report indicates that despite mounting evidence to the contrary, the majority of US mid-market companies believe their business’s current spending on security is adequate as a sound business investment that will proactively reduce the risk and impact of a disaster. Many of these companies view these business costs as an expense that should be minimized. [12]
3. DISASTER RECOVERY RELIABILITY & CHALLENGES
The small percentage of organizations that have the resources available, foresight and capability to consider the risks and costs of mitigating against IT application and business process outages commonly invest in Disaster Recovery and Business Continuity plans. DR solutions traditionally implement alternate ‘hot’, ‘warm’ or ‘cold’ failover sites with varying degrees of IT
infrastructure readiness and availability.
Unfortunately, such efforts are often made after an IT solution has been designed and implemented, not before, where it could have the most beneficial effect on architecture and appropriate implementation and maintenance [10].
In standard computer cluster configurations, high availability is often achieved through the use of redundant hardware to eliminate single points of failure. This approach can protect the cluster against hardware faults, such as individual node failures. In the case of disasters, this includes protecting against a single massive failure that causes many components to fail, such as the failure of an entire data center which physically contains groups of server nodes and disk storage subsystems in close geographic proximity. However, the approach of systems and infrastructure replication with geographic
disparity has six significant general
consequences:
1. All elements of a system must be replicated
in order for system functionality, including data, servers, storage, applications, Wide Area Network communications, and in particular, human IT resources, which are difficult to replicate.
2. Data replication and synchronization
between redundant systems becomes problematic over geographically disparate networks.
3. The complexity of a system increases as the
level of redundancy increases, making the components of redundant systems more difficult to manage and complex to maintain.
4. The costs of larger redundant systems are
commonly high and discourage capital investment and implementation.
5. Replicated or redundant IT systems
commonly implement Disaster Recovery
practices to fail over or recover system functionality at a replicated site. With limited success rates.
6. Some systems are so large that it is
impractical to replicate them (for example, the United States electric power grid).
Disaster recovery and business continuity technologies and plans are often conceived after an application has been designed and
implemented, adding into the existing
infrastructure disaster recovery functionality features that were not designed into the application itself. Applications and technologies implemented are then intended to function in a manner in which they were not designed. In
cases where replication technology is
implemented, replication and failover process failure is common. System complexities and people-related processes often render the failover and fail back scenarios dysfunctional and inadequate [13]. Statistics show replication and failover failure has five primary causes. Secondary failover environments are often not ready for the failover process itself to occur. Manual human error occurs within the failover process. The failover process is dependent on critical knowledge experts who are unavailable during crises. Failover processes are unable to scale in disaster situations where rapid, almost simultaneous, multiple points of failure escalate into system wide catastrophic failures. Finally, and perhaps most common, assumptions made regarding failover are incorrect and result in a lack of successful failover [13].
Such efforts are often unsuccessful in reaching the goal of providing business process or IT application continuance in the event of a disaster. Instead, these efforts attempt to force an application or technology solution to function in a manner in which it was not designed and do not have functionally adequate processes, technology or support resources to enable successful Disaster Recovery failover [13]. As a result, a large portion of capital and resource investment in Disaster Recovery is literally wasted in the failed recovery processes itself, reducing the value of this investment, as it does not produce the desired result: IT infrastructure, applications and business process functionalities that are disaster tolerant [10].
As a result, traditional Disaster Recovery and Business Continuity Planning and practices are often not sufficient to protect businesses and organizations from IT systems and network outages, nor do they enable IT applications and business processes to adequately continue operations throughout the occurrence of a disaster. In actuality, these practices leave organizations and businesses vulnerable to organizational failure in the event of a disaster. Strategy, priority, management, investment,
personnel and technology challenges
surrounding DR and BCP render these practices ineffective [10].
4. EXECUTIVE VISIBILITY & THE COSTS OF DISASTER DOWNTIME
Executive visibility, with regard to information systems, is defined as the ability of executive
management within an organization to
understand the business aspects and impacts of an information system or application and combined with comprehensive insight into the financial aspects and contributions of such systems. Executive visibility additionally entails an awareness of service level agreements (SLAs), corporate compliance and governance and availability of IT applications and related infrastructure on which the organization depends. Executive visibility includes the specific requirement that key decision makers understand the financial costs of downtime as well as the value of uptime of IT systems. However, in observing IT operational outages as well as evaluating potential large-scale or organizational failures resulting from traumatic
disasters, executive managers commonly do not have adequate information regarding the actual financial costs of such downtime and outages. Instead, a lack of visibility into the practical impact of such outages on business processes, customer service, product/service delivery and revenue generation tends to be more common. Consequently, the value of uptime is also often not understood and priority and investment in business continuance remains low when compared to other business or organizational objectives [10].
Eagle Rock Alliance conducted study as a joint effort between Contingency Planning Research, and Contingency Planning & Management Magazine titled "2001 Cost of Downtime". A subset of their findings are as follows: 46% of businesses surveyed estimated each hour of downtime would cost their companies up to $50K; 28% said each hour would cost between $51K and $250K; 18% said between $251K and $1M; 8% said it would cost their companies more than $1M per hour [19]. The Northeast power outages of August 2003 cost New York City businesses a total of more than $1 billion, an estimated $36 million per hour [20]. Mirifex Systems LLC and the Center for Regional Economic Issues at the Weatherhead School of Management in Ohio lost more than $50,000 per hour of downtime during the blackouts. That adds up to about $400,000 for an eight-hour day [21]. These per-hour loss numbers are in line with a 2000 study conducted by Contingency Planning & Management (CPM) who concluded that companies with annual revenues less than $100 million dollars were likely to experience a $50,000 per hour economic loss from a full interruption in a given year on average. The financial cost per hour loss increased substantially with the annual revenue size of the company. Companies with annual revenues greater than $3 billion were likely to experience an hourly loss rate of more than $1 million per hour. In addition, the study identified those industries on average, experience different per-hour loss rates [21].
Despite the high costs of business downtime, the financial cost of implementing redundant applications or hot/warm failover sites often prevents management from implementing high availability technologies. Information detailing SLA compliance cost of downtime, value of uptime, as well as stability and availability statistics could assist in providing greater
executive visibility to management staff. This information, in turn would allow management greater insight in making decisions regarding IT
applications, infrastructure and business
continuance planning. Executive management equipped with accurate information regarding the financial ramifications of application downtime would be able to more readily engage in the cost benefit analysis of implementing an IT infrastructure that is disaster tolerant. It is essential for executive level management to fully understand the value of uptime of a particular application or IT infrastructure as well as the costs and business impacts of downtime in order to make fully educated decisions regarding disaster tolerant systems and establish business cost benefit justification for capital invest in such systems. Executive visibility and models for calculating the actual costs of IT systems downtime is an area of Disaster Tolerance that has not yet been fully explored.
[10].
5. DISASTER TOLERANT TECHNIQUES & EXECUTIVE VISIBILITY
An approach for standard IT solutions development, implementation and support should inherently include an appropriate level of disaster tolerance built into the architecture itself, from initial design through to implementation and management. Unfortunately, due to increased costs and a lack of comprehension of the true costs of IT application or business process downtime, this practice is often not followed. Data indicates that it is in fact common for executive management, when faced with capital investment decisions, to allocate funds to other areas within a business instead of investing in disaster recovery [11]. Despite recent increases in both man-made and natural disasters, the large majority of businesses and executive management continue not to consider Disaster Recovery or Business Continuity Planning a top priority [12]. Building redundancy and disaster tolerant designs into the initial architecture itself is not a new a concept. However, establishing a proven process that incorporates disaster tolerant technologies early in the IT solution design is different from the current concept of disaster recovery. This approach would alter the way the IT solution design process has historically been done but offers the potential for significant benefit in terms of disaster tolerance [10].
Clusters that are resistant to multiple points of failure or single massive failures require a different type of cluster architecture known as disaster tolerant architecture, which provides the ability to survive disasters via geographically distributed systems and load balancing between alternate cluster nodes. A disaster tolerant architecture involves designing server clusters to share the system load among several geographic cluster nodes in a distributed fashion where the loss of one or more nodes or geographic locations does not significantly impact system functionality [14, 17]. Disaster tolerant applications should be designed from their initial stages with replication, failover, multiple site, distributed architecture. A fundamental yet critical step in designing a viable disaster tolerant IT infrastructure and applications is to begin with the idea of disaster tolerance in mind [10].
6. METHODS
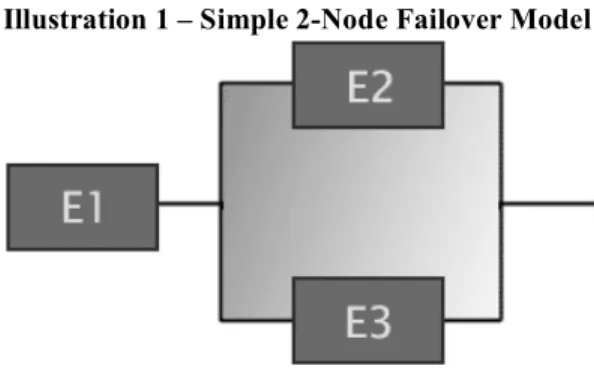
Basic analysis was performed on a simplified, 2-node, geographically distributed architecture that models a secure data transfer network undergoing a failover, emulating the loss of one data site node [10]. The system under analysis is
structured as a simple series-parallel
configuration demonstrated in Illustration 1. Illustration 1 – Simple 2-Node Failover Model
An analytical approach is conducted to determine a Time to Failover model, random
variable t, for a simplified, series-parallel
reliability architecture. A simulation was
performed utilizing EMC2 Legato RepliStor
replication and failover software and modeled the time to failover to an alternate data site in response to a disaster and the loss of a data site node. Failover was dependent on manual execution, DNS replicated changes, LDAP infrastructure and replication/failover application communications. Statistical analyses revealed
exponential distribution of time to failure Ti ~
!
(i
!
) for i = 1, 2, … n [10].Based on data from the simulation results, the following analysis of the system was determined:
The Reliability of the system, R(t) The instantaneous failure rate, h(t) The cumulative failure rate, H(t) The Mean Time to Failover (MTTF) The following assumptions were made for the system model:
1. Asynchronous data replication between data
site nodes
2. DNS replicated changes, LDAP
infrastructure were functional
3. Perfect failure sensing and switching
4. Zero failure rate during standby
5. Independent elements
6. Element time to failure is exponential with
parameter !
The system reliability for the configuration is:
Rs(t) =
e
"(!1+!2)t+
e
"(!1+!3)t"
e
"(!1+!2+!3)tWhere system mean time to failure is MTTF =
1
!s
= "s
MTTF of the series parallel configuration is determined through the relationship:
MTTF=
!
"Rtdt 0 ) ( = ) ( 1 1 1 3 2 1 3 1 2 1 ! ! ! ! ! ! ! + + + " + +The instantaneous failure rate of the 2-node
failover system model, h(t), is calculated through
the relationship of the failure density function and reliability the function [3].
h(t) = ) ( ) ( t R t f where f(t) = R(t) dt d ! , which yields: h(t) = t t t t t e e e e e ) ( ) ( ) ( ) ( 3 1 ) ( 2 1 3 2 1 3 1 2 1 3 1 2 1 ( ) ) ( ! ! ! ! ! ! ! ! ! ! ! ! ! ! ! + + " + " + " + " + " + + + + + t t t t
e
e
e
e
) ( ) ( ) ( ) ( 3 2 1 3 2 1 3 1 2 1 3 2 1)
(
! ! ! ! ! ! ! ! ! !!
!
!
+ + " + " + " + + "+
+
+
+
"
This allows us to derive the Cumulative Failure Rate H(t) =
!
tht dt t0 () 1 H(t)= ! "#$ + + + + + % + + & + & + & + & + & 0 ( ) ( ) ( ) ) ( 3 1 ) 2 1 ( 2 1 3 2 1 3 1 2 1 3 1 ) ( ) ( 1 t t t t t e e e e e t ' ' ' ' ' ' ' ' ' ' ' ' ' ' 'dt
e
e
e
e
t t t t!"
#
+
+
+
+
$
$( + ) $( + ) $$(++ + ) ) ( 3 2 1 3 2 1 3 1 2 1 3 1)
(
% % % % % % % % %%
%
%
Mean Time to Failover (MTTF) can be estimated
using a (1-
!
) •95% Lower ConfidenceInterval ("L,!), based on the condition that
simulation discontinued after a fixed amount of
total time Tc has elapsed [10].
r Tc L 2 , 2 2 2 ! " = # where !p,df 2 is the value of x~ 2 df
!
such that P(X>!
df2 )= p. Five simulations of time to failover were tested and measured in seconds. The results follow: 22, 27, 33, 47, 73
MTTF is estimated by the point estimate
!
ˆ
= fˆ(!ˆ,!ˆ2) 5 5 1!
= i i x = 95 5 = 19 seconds. A 95% lower confidence interval on the mean failover is set, providing a measure of potential variation. Appropriate chi-square test values are31 . 18 2 10 , 05 . 0 =
! . Therefore, with a 95% lower
confidence limit on
!
the MTTF is 10.38seconds for the series-parallel system
configuration. Using the point estimate,
f
ˆ
(
!
ˆ
,
!
ˆ
2)
for MTTF and varying the confidence interval,
we determine that ˆ( , 2) U L f ! ! and ˆ( , 2) U U f ! !
are worst case scenarios, as these points have the highest variability. In a similar manner,
)
,
(
ˆ
2 L Lf
!
!
andˆ
(
,
2)
L Uf
!
!
have the leastvariability and are therefore more desirable to work towards achieving a MTTF in this area for increased predictability. This risk avoidance posture affords mitigation against the costs and consequences of unpredictable IT application downtime provides an organization with the ability to analyze, predict, and rationally accept associated risks, as warranted by an application's availability requirements. [10]:
Illustration 2 – Analysis of Simple 2-Node Model
7. INTERDEPENDECE & INTERACTING INFRASTRUCTURE SYSTEMS Business, governments and societies rely on the uninterrupted operation of many infrastructure systems such as electric power transmission and
distribution systems, communication and
computer network, information systems,
commodity transportation infrastructure and arguably economic markets. Because none of these infrastructure systems operate in a vacuum, comprehension of how these complex systems interact is increasingly important and illustrates
how tightly coupled complex critical
infrastructure systems are [6]. There has been work in the modeling of some of the different infrastructure systems mentioned. However, because of the intrinsic complexities involved, modeling of the interaction between these systems has been limited until recently [6, 7, 8]. The traditional approach of understanding the components of a large complex system in order to comprehend the entire system can overlook important consequences of the coupling of these systems as well as critical vulnerabilities. Similarly, assuming a larger coupled system is a larger complex system because of the heterogeneity introduced by coupling is also not without fault. While the individual systems may have a relatively homogeneous structure, the coupling between the systems is often fundamentally different both in terms of spatial uniformity and coupling strength [6].
Normal regions in which the inter-system coupling is weaker or topologically different from intra-system coupling can lead to important new systems interdependence and behavior. In interdependent interacting systems, slight agitations or changes in one might have very little obvious effect on the other system, yet the effect of the coupling of the two systems can have a profound effect on the risk of large, rare disturbances. The occurrence of natural or man made disasters may also have significant implications for the dynamics and risks of such systems. Understanding the effect of this coupling on the system dynamics is critical to accurately developing risk models for different
infrastructure systems individually or
collectively [6]. This interdependent risk in interacting infrastructure systems also has direct applicability to disaster occurrence and tolerance.
8. CONCLUSIONS
Data indicates man-made disasters are
increasingly becoming the primary threats to business continuity [18]. The terrorist events of September 11, 2001 and the US Northeast power outage of August, 2003, combined with Hurricane Katrina of 2005, emphasize the need to develop disaster tolerant computing and communication systems. The current state of Disaster Recovery and Business Continuity, in light of recent man-made terrorist events, may not be sufficient in their goal of providing business and IT systems recovery. Business, governments and societies rely on the uninterrupted operation of many interdependent interacting infrastructure systems which have direct applicability to disaster tolerance. Significant research into cascading failures and self-organizing criticalities in such systems is prevalent. However, In the event of a man-made or natural disaster, numerous, near instantaneous, cascading failures are introduced into a multitude of interdependent infrastructure systems. While content specific approaches currently undertaken to understand and avoid cascading failures in systems such as the power network are extant, opportunities exist to extend this complex systems interdependence analysis to the private business sector, business continuance and disaster tolerance. The high level of complexity of local and global relationships between IT application availability and the secondary and tertiary affects of a disaster on systems that are dependent on other systems for availability has not yet been fully explored.
7. REFERENCES
[1] Talukdar, S. N., J. Apt, M. Ilic, L. B.
Lave, and M. G. Morgan. “Cascading failures: Survival versus revention.” The Electricity Journal. Nov. 2003.
[2] Szygenda, Stephen A., Thornton,
Mitchell A., “Disaster Tolerant Computer and Communication Systems”, Department of Engineering Management, Information and Systems & Department of Computer Science and Engineering, SMU, 2004
[3] Dobson, Ian, B. A. Carreras, D. E.
Newman. “A criticality approach to monitoring cascading failure risk and failure propagation in transmission systems.” Proc. of the Carnegie Mellon Transmission Conf., Pittsburgh, Dec.
2004. Online:
[4] WSCC Operations Committee. Western Systems Coordinating Council Disturbance Report. WSCC, Sept.1996.
[5] Hines, Paul, H. Liao, D. Jia, and S.
Talukdar. “Autonomous Agents and Cooperation for the Control of Cascading Failures in Electric Grids.” Proc. of the IEEE Conf. on Networking, Sensing, and Control. Tuscan, Mar. 2005.
[6] Carreras, B. A., Newman, D. E.,
Gradney, Paul, Lynch, V. E., Dobson, I., "Interdependent Risk in Interacting Infrastructure Systems", 40th Hawaii International Conference on System Science, January 2007
[7] R. G. Little, Toward more robust
infrastructure: Observations on improving the resilience and reliability of critical systems, 36th Annual Hawaii International Conference on System Sciences, Hawaii, January 2003.
[8] S.M. Rinaldi, Modeling and simulating
critical infrastructures and their
interdependencies, 37th Annual Hawaii
International Conference on System Sciences, Hawaii Jan. 2004.
[9] R. J. Ellison, D. A. Fisher, R.C. Linger,
H. F. Lipson, T. A. Longstaff, N. R. Mead,
"Survivability: Protecting Your Critical
Systems," IEEE Internet Computing,
November/December 1999
[10] Harper, Michael A., Lawler, Chad M.,
Thornton, Mitchell A., “IT Application Downtime, Executive Visibility and Disaster Tolerant Computing”, CITSA, 2nd International Conference on Cybernetics and Information Technologies, Systems and Applications, July 2005
[11] Harris Interactive & SunGard
Availability, “Survey of Fortune 1000 Companies Reveals Serious Deficiencies in Disaster Preparation - Troubling differences
found between executives’,
www3.sungard.com/news/default.aspx?id=2&an nounceId=392, 2005
[12] The Conference Board, “Security in
Mid-Market Companies: The View From The Top Executive Action”, 2004, www.conference-board.org
[13] Kibildis, George, “Business Continuity
Planning in the Real World”, Disaster Recovery Journal, 2005
[14] AT&T and the International Association
of Emergency Managers (IAEM), “AT&T Study Finds U.S. Businesses Unprepared For Disaster” and “Disaster Planning in the Private Sector: A Look at the State of Business Continuity in the US”, http://www.att.com/news/2005/09/12-2, 2005
[15] “Designing Disaster Tolerant
MC/ServiceGuard Clusters”, B6264-90002, June 1998, Hewlett-Packard Company
[16] F. Chang, M. Ji, S.T Leung, J.
MackCormick, S. Perl, L. Zhang, “Myriad: Cost-effective Disaster Tolerance,” Proceedings of the FAST 2002 Conference on File and Storage Technologies. USENIX Association. Monterey, CA. January 2002.
[17] “Designing Disaster Tolerant
MC/ServiceGuard Clusters”, B6264-90002, June 1998, Hewlett-Packard Compan
[18] The New England Disaster Recovery
Information X-Change (NEDRIX), 2002
[19]Contingency Planning & Management /
KPMG Business Continuity Planning Survey," cited in Andy Hagg, "BCP on the
Rise," Contingency Planning and
Management, January 2001
[20]Continuity Central, Vertitas, “Three-quarters
of companies leave disaster recovery planning solely to the IT department”, www.continuitycentral.com/news0523.htm, 2005
[21]Mirifex Systems, LLC & Center for
Regional Economic Issues Weatherhead School of Management Strongsville, Ohio , "An Analysis of the Consequences of the August 14th 2003 Power Outage and its Potential Impact on Business Strategy and Local Public Policy", 2004