TITLE: Improvement of Virtual Screening predictions using Computational Intelligence methods RUNNING TITLE: Improvement of Virtual Screening using Computational Intelligence
(TITLE PAGE)
Improvement of Virtual Screening predictions using Computational Intelligence methods Authors:
Gaspar Cano
Address: Computing Technology Department, University of Alicante, Ap. 99. E03080. Alicante, Spain. Phone: 0034-965903400 Ext 2616
Fax: 0034-965909643 Email: [email protected]
José García-Rodríguez
Address: Computing Technology Department, University of Alicante, Ap. 99. E03080. Alicante, Spain. Phone: 0034-965903400 Ext 2616
Fax: 0034-965909643 Email: [email protected]
Horacio Pérez-Sánchez
Address: Computer Science Department, Catholic University of Murcia (UCAM) E30107 Murcia, Spain. Phone: 0034-968277982
Fax: 0034-968277943 Email: [email protected]* *Corresponding author
ABSTRACT:
Virtual Screening (VS) methods can considerably aid clinical research, predicting how ligands interact with drug targets. However, the accuracy of most VS methods is constrained by limitations in the scoring function that describes biomolecular interactions, and even nowadays these uncertainties are not
completely understood. In order to improve accuracy of scoring functions used in most VS methods we propose a hybrid novel approach where neural networks (NNET) and support vector machines (SVM) methods are trained with databases of known active (drugs) and inactive compounds, being this information exploited afterwards to improve VS predictions.
Keywords: Clinical Research, Computational Intelligence, Drug Discovery, Neural Networks, Support Vector Machines, Virtual Screening.
1 INTRODUCTION
In clinical research, it is crucial to determine the safety and effectiveness of current drugs and to accelerate findings in basic research (discovery of new leads and active compounds) into meaningful health outcomes. Both objectives need to process the large data set of protein structures available in biological databases such as PDB [1] and also derived from genomic data using techniques such as homology modeling [2]. Screenings in lab and compound optimization are expensive and slow methods, but bioinformatics can vastly help clinical research for the mentioned purposes by providing prediction of the toxicity of drugs and activity in non-tested targets, and by evolving discovered active compounds into drugs during clinical trials.
This aim can be achieved thanks to the availability of bioinformatics tools and Virtual Screening (VS) methods that allow testing all required hypothesis before clinical trials. However, the accuracy of most VS methods is constrained by limitations in the scoring function that describes biomolecular interactions, and even nowadays these uncertainties are not completely understood. In order to solve this problem we propose a novel hybrid approach where Computational Intelligence (CI) methods that include neural networks (NNET) and support vector machines (SVM) are trained with databases of known active (drugs) and inactive compounds (decoys) and later used to improve VS predictions. Other approaches based on the use of molecular descriptors have been previously described in the literature but they were applied in concrete contexts of protein-ligand interactions [2-4], while the method we propose can be applied to any case of protein-ligand interactions and VS method, provided previous experimental information for active and inactive compounds is available.
The rest of the paper is organized as follows. Section 2 describes the methodology including VS, NNET and SVM techniques, and molecular properties used in this study. Section 3 presents the experiments carried out to refine the VS methods with the previously mentioned techniques while section 4 reports the results obtained. In section 5 we present our main conclusions and further work.
2 METHOLODOGY
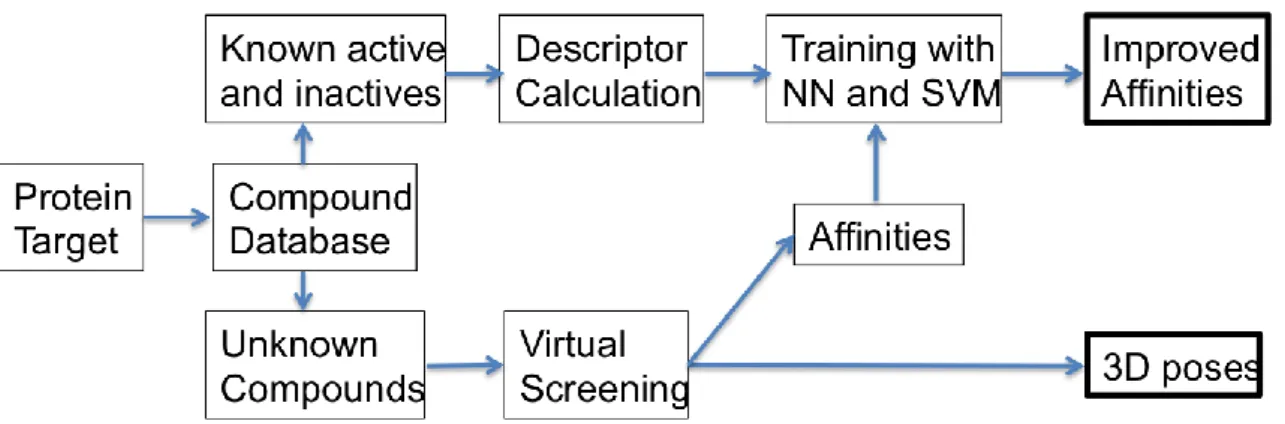
In this section we describe the methodologies we used for the improved prediction of protein-ligand affinities; a) the Virtual Screening method (VS), and b) two different CI techniques are employed that include; neural networks (NN) and support vector machines (SVM) trained with different molecular properties calculated for known active and inactive compounds selected from standard VS benchmarks. In Fig. (1) the flowchart of our experimental setup is depicted.
Figure 1. Flowchart of the experimental setup used in this work.
2.1 Virtual Screening
Essentially, VS methods screen a large database of molecules in order to find compounds that fit some established criteria [6]. In the case of the discovery of new leads, compound optimization, toxicity evaluation and additional stages of the drug discovery process, we screen a large compound database to find a small molecule which interacts in a desired way with one or many different receptors. Among the many available VS methods for this purpose one of the most structurally accurate methods is protein-ligand docking [7, 8]. These methods try to obtain rapid and accurate predictions of the 3D conformation a ligand adopts when it interacts with a given protein target, and also the strength of this union, in terms of its scoring function value. Docking simulations are typically carried out in a very concrete part of the protein surface in methods such as Autodock [9], Glide [10] and DOCK [11], to name a few. This region is commonly derived from the position of a particular ligand in the crystal structure, or from the crystal structure of the protein without any ligand. The former can be performed when the protein is co-crystallized with the ligand, but it might happen that no crystal structure of this ligand-protein pair is at
disposal. Nevertheless, the main problem is to take the assumption, once the binding site is specified, that many different ligands will interact with the protein in the same region, discarding completely the other areas of the protein.
In essence, in a docking simulation we calculate the ligand-protein interaction energy for a given starting configuration of the system, which is represented by a scoring function [12]. In most VS methods the scoring function calculates electrostatic (ES), Van der Waals (VDW) and hydrogen bond (HBOND) terms.
Furthermore, in docking methods it is normally assumed [13] that the minima of the scoring function, among all ligand-protein conformations, will accurately represent the conformation the system adopts when the ligand binds to the protein. Thus, when the simulation starts, we try to minimize the value of the scoring function by continuously performing random or predefined perturbations of the system,
calculating for each step the new value of the scoring function, and accepting it or not following different approaches like the Monte Carlo minimization method [14,15].
2.2 Computational Intelligence Methods
We describe in this section the CI methods we will apply to refine the prediction capacities of VS. 2.2.1 Neural Networks
One of the most dominant application areas of neural networks is non-linear function approximation. The main advantage of neural network modeling is that complex non-linear relationships can be modeled without assumptions about the form of the model. That feature is very useful in the field of drug design and drug discovery.
More than two decades ago, the aqueous solubility of organic compounds was studied using neural approaches [16]. In next decade, supervised and unsupervised neural models were employed to model QSAR, predict molecules activities and structure, clustering and many more [17-18]. More recently the problem of drug solubility prediction from structure has been revisited [19]. Properties of organic compounds obtained from the molecular structure have been extensively studied using hybrid techniques that include neural networks [20-22]. Also identification of small-molecule ligands has been improved
using neural techniques [23-25]. In the last years a large number of authors have designed hybrid methods that combined neural networks with other techniques to solve chemistry related problems.
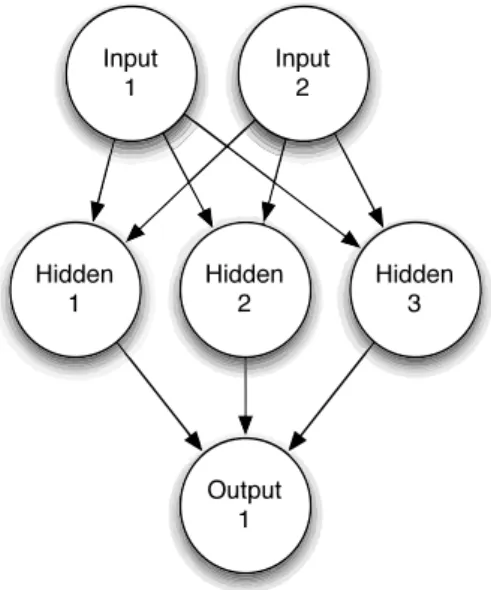
There are several types of feed-forward neural networks (NNET), the most widely used being multi-layer networks with sigmoidal activation functions (multi-layer perceptrons) and single layer networks with local activation functions (radial basis function networks). The good approximation capability of neural networks has been widely demonstrated by both practical applications and theoretical research. We decided to use a single-hidden-layer neural network with skip-layer connections in this study, as shown in Fig. (2), since it has been clearly demonstrated its impact on the differentiation between active and inactive compounds and other chemical applications [17]. For such purpose we used the nnet function of the R package [26].
Figure 2. Single Hidden layer Neural Network
2.2.2 Support Vector Machines
Support vector machines (SVM) [27] are a group of supervised learning methods that can be applied to classification or regression. They represent the decision boundary in terms of a typically small subset of all training examples, called the support vectors. In a short period of time, SVM have found numerous applications in chemistry, such as in drug design [28] when discriminating between ligands and non-ligands, inhibitors and non-inhibitors, drug discovery [29],quantitative structure-activity relationships (QSAR, where SVM regression is used to predict various physical, chemical, or biological properties) [30], chemometrics (optimization of chromatographic separation or compound concentration prediction
from spectral data as examples), sensors (for qualitative and quantitative prediction from sensor data), chemical engineering (fault detection and modeling of industrial processes)[31]. An excellent review of SVM applications in chemistry can be found in [32].
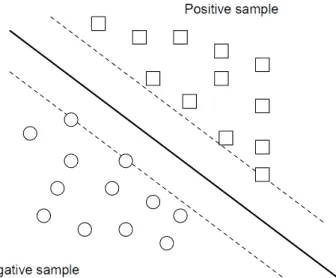
In our case, we exploit the idea that SVM produce a particular hyperplane in feature space that separates the active from the inactive compounds called the maximum margin hyperplane, as shown in Fig. (3). Most used kernels within SVM technique include: linear (dot), Polynomial, Neural (sigmoid,Tanh), Anova, Fourier, Spline, B Spline, Additive, Tensor and Gaussian Radial Basis or Exponential Radial Basis.
Figure 3. Support Vector Machines margin hyperplanes
2.3 Ligand databases and molecular properties
We carried out our study applying the methods described in sections 2.2.1 and 2.2.2 and using different sets of molecules that are known to be active or inactive. We employed standard VS benchmark tests, such as the Directory of Useful Decoys (DUD) [33], where VS methods check how efficient they are in differentiating ligands that are known to bind to a given target, from non-binders or decoys. Input data for each molecule of each set contains its molecular structure and whether it is active or not. We focused on three diverse DUD datasets (details are shown in Table 1) that cover kinases, nuclear hormone receptors and other enzymes such as TK, which corresponds to thymidine kinase (from PDB 1KIM), MR, which
corresponds to mineralocorticoid receptor (from PDB 2AA2), and GPB, which corresponds to the enzyme glycogen phosphorylase (from PDB 1A8I).
Protein PDB Code Resolution (Å) no of ligands no of decoys GPB 1A8I 1.8 52 1851 MR 2AA2 1.9 15 535 TK 1KIM 2.1 22 785
Table 1. Number of active (ligands) and inactive compounds (decoys) for each of the sets used in this study, obtained from DUD [33].
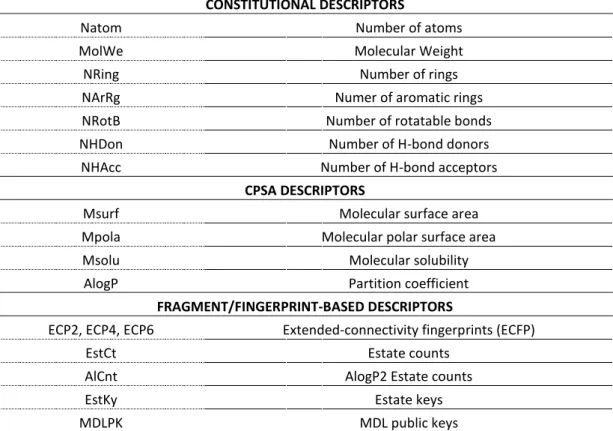
Next, using the ChemoPy package [34] we calculated for all ligands of the TK, MR and GPB sets a diverse set of molecular properties derived from the set of constitutional, CPSA (charged partial surface area) and fragment/fingerprint-based descriptors, as described in Table 2. Constitutional properties depend on very simple descriptors of the molecule that can be easily calculated just counting the number of molecular elements such as atoms, types of atoms, bonds, rings, etc. These descriptors should be able to differentiate very dissimilar molecules, but might have problem for separating closely related isomers. CPSA descriptors take into account finer details of molecular structure, so they might be able to separate similar molecules, but might also have difficulties for separating isomers. Lastly, fragment and
fingerprint-based descriptors take into account the presence of an exact structure (not a substructure) with limited specified attachment points. These descriptors are more difficult to calculate. In generating the fingerprints, the program assigns an initial code to each atom. The initial atom code is derived from the number of connections to the atom, the element type, atomic charge, and atomic mass. This corresponds to an ECFP with a neighborhood size of zero. These atom codes are then updated in an iterative manner to reflect the codes of each atoms neighbors. In the next iteration, a hashing scheme is employed to incorporate information from each atoms immediate neighbors. Each atoms new code now describes a molecular structure with a neighborhood size of one. This process is carried out for all atoms in the
molecule. When the desired neighborhood size is reached, the process is complete and the set of all features is returned as the fingerprint. For the ECFPs employed in this paper, neighborhood sizes of two, four and six (ECFP 2, ECFP 4, ECFP 6) were used to generate the fingerprints. The resulting ECFPs can represent a much larger set of features than other fingerprints and contain a significant number of different structural units crucial for the molecular comparison, among the compounds.
CONSTITUTIONAL DESCRIPTORS
Natom Number of atoms
MolWe Molecular Weight
NRing Number of rings
NArRg Numer of aromatic rings
NRotB Number of rotatable bonds
NHDon Number of H-bond donors
NHAcc Number of H-bond acceptors
CPSA DESCRIPTORS
Msurf Molecular surface area
Mpola Molecular polar surface area
Msolu Molecular solubility
AlogP Partition coefficient
FRAGMENT/FINGERPRINT-BASED DESCRIPTORS
ECP2, ECP4, ECP6 Extended-connectivity fingerprints (ECFP)
EstCt Estate counts
AlCnt AlogP2 Estate counts
EstKy Estate keys
MDLPK MDL public keys
Table 2. Molecular descriptors used in this study. 3.RESULTS
A set of experiments has been carried out in order to test the validity of our initial hypothesis combining and refining VS results with the proposed CI methods.
3.1 Activity prediction using Computational Intelligence methods
NNET and SVM were trained with the previously described DUD datasets TK, MR and GPB. Molecular properties described in Table 2 were calculated for each molecule as described in the methods section. A k-fold cross-validation technique with k=5 was employed for NNET and SVM experiments.
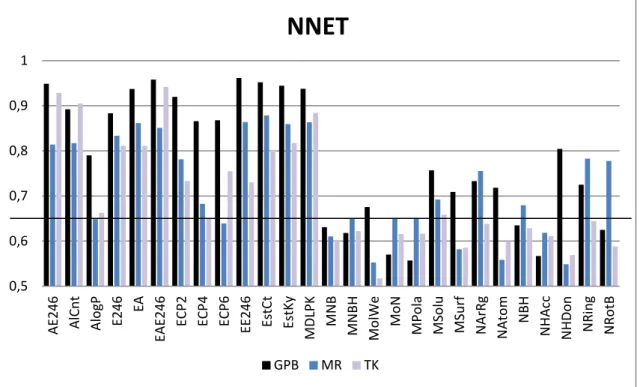
A set of experiments has been developed to find the feed-forward neural network architecture that fits better to the problem of classification proposed. A combination of different number of neurons for the hidden layer has been tested with the different descriptors and datasets. We considered architectures with 1, 2 and 3neurons in the hidden layer. Since results of combinations with more than 3 neurons did not improve the results, we decide to use the simplest option with 3 neurons due to its lower temporal cost for training phase. Results for AUC values are reported in Fig (4).
.
Figure 4. AUC values of the ROC curves obtained using NNET as described in section 2.2.1 for each property of Table 2 of the three different datasets GPB (blue), MR (red) and TK (yellow). Baseline for AUC=0.65 is also shown. The resulting AUC values for the combined properties described in Table 3 are also reported.
3.1.2 SVM
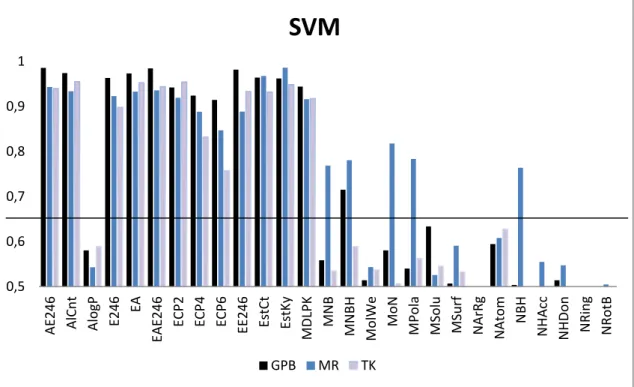
A set of experiments with different kernels has been developed to find the option with higher discrimination capacities between active and non-active compounds for each descriptor. More specifically, linear, polynomial, sigmoid and radial kernels has been tested with all the descriptors and datasets. Best results have been obtained with radial kernels and results obtained for AUC values are reported in Fig. (5). 0,5 0,6 0,7 0,8 0,9 1 AE 246 AlC n t AlogP E246 EA EAE
246 ECP2 ECP4 ECP6
EE 246 EstCt Es tKy MDLPK MN B MN BH Mo lWe MoN MPo la MSolu MSu rf N ArRg N Ato m N B H N H Acc N H Don N Rin g N Rot B
NNET
GPB MR TKFigure 5. AUC values of the ROC curves obtained using SVM as described in section 2.2.1 for each property of Table 2 of the three different datasets GPB (blue), MR (red) and TK (yellow). Baseline for AUC=0.65 is also shown. The resulting AUC values for the combined properties described in Table 3 are also reported.
4. DISCUSSION
AUC values reported by both NNET and SVM depend clearly on the considered molecular property, and to a lesser extent, on the molecular dataset studied (GPB, MR, TK). The reason for the latter might be that main active compounds of these sets have similar structures, as shown in Fig. (6), consisting in small molecules with two or four rings, and also because they establish similar interactions with the protein, mainly based on hydrogen bond networks.
We propose a threshold value of 0.65 for AUC in order to discriminate which properties are useful for active/inactive prediction. Properties that simultaneously yield AUC values higher than this threshold for all sets using both NNET and SVM are; AlCnt, E246, ECP2 and MDLPK, while properties that yield AUC values lower than threshold are mostly AlogP, MolWe, MPola, MSolu, MSurf, NArgRg, Natom, NHacc, NHDon, NRing, and NRotB. So it seems clear that the best option for discriminating among active and inactive compounds in these datasets is to use fingerprint-based descriptors and to avoid the use of constitutional and CPSA descriptors. This is reasonable since fingerprint descriptors take into account more details about the structure of molecules, being able to efficiently discriminate with more accuracy between active compounds and their decoys.
0,5 0,6 0,7 0,8 0,9 1 AE246 AlC n t AlogP E246 EA EAE
246 ECP2 ECP4 ECP6
EE 246 EstCt Es tKy MDLPK MN B MN BH Mo lWe MoN MPo la MSolu MSu rf N ArRg N Ato m N BH N H Acc N H Don N Rin g N Rot B
SVM
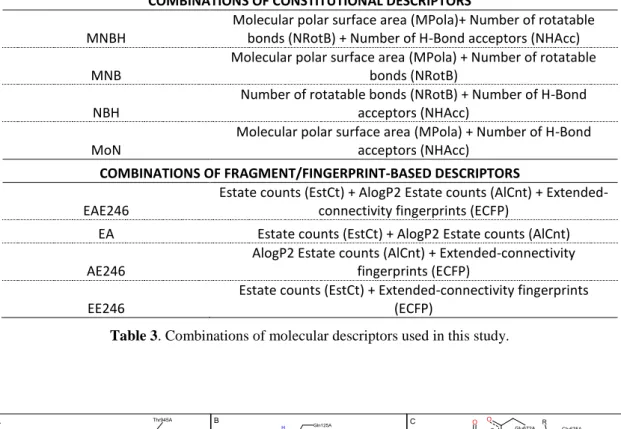
GPB MR TKNext, we studied whether combination of properties could lead to improvements on the predictive capability of these CI methods. Therefore we combined properties that yielded the lowest AUC values, constitutional descriptors, and the properties that yielded the highest AUC values, so fingerprint based descriptors. Combinations used are described in Table 3 and AUC values obtained are reported in Figs. (4) and (5). In the case of combinations of constitutional descriptors, there is no clear improvement for either NNET or SVM, while for fingerprint combinations, average AUC values for the three datasets improve slightly.
Finally, top obtained AUC values for datasets GPB, MR and TK correspond to properties EE246 (0.96), EstCt (0.87) and EAE246 (0.94) when using NNET, and AE246 (0.98), EstKy (0.98)and AlCnt (0.95) when using SVM.
COMBINATIONS OF CONSTITUTIONAL DESCRIPTORS MNBH
Molecular polar surface area (MPola)+ Number of rotatable bonds (NRotB) + Number of H-Bond acceptors (NHAcc) MNB
Molecular polar surface area (MPola) + Number of rotatable bonds (NRotB)
NBH
Number of rotatable bonds (NRotB) + Number of H-Bond acceptors (NHAcc)
MoN
Molecular polar surface area (MPola) + Number of H-Bond acceptors (NHAcc)
COMBINATIONS OF FRAGMENT/FINGERPRINT-BASED DESCRIPTORS EAE246
Estate counts (EstCt) + AlogP2 Estate counts (AlCnt) + Extended-connectivity fingerprints (ECFP)
EA Estate counts (EstCt) + AlogP2 Estate counts (AlCnt)
AE246
AlogP2 Estate counts (AlCnt) + Extended-connectivity fingerprints (ECFP)
EE246
Estate counts (EstCt) + Extended-connectivity fingerprints (ECFP)
Table 3. Combinations of molecular descriptors used in this study.
Figure 6. Depiction of the molecular structure and protein-ligand interactions established by main active compounds from A) MR, B) TK, and C) GPB.
Consequently, and taking into account information obtained by CI methods we can post-process docking results obtained by the scoring function of VS methods and neglect resulting compounds that are predicted as inactive. Then we can sort them by the final affinity value predicted by the VS scoring function for such cases and study visually the top ones.
5. CONCLUSIONS
In this work we have shown how the predictive capability of the VS methods can be improved using CI methods such as neural networks and support vector machines. It must be mentioned that CI approaches can only be used when experimental data for active and non-active compounds for a given protein is available.
This methodology can be used to improve drug discovery, drug design, repurposing and therefore aid considerably in clinical research. In the next steps we want to extend our ideas to the application of unsupervised CI methods.
ACKNOWLEDGEMENTS
We thank the Catholic University of Murcia (UCAM) under grant PMAFI/26/12. This work was partially supported by the computing facilities of Extremadura Research Centre for Advanced Technologies (CETA-CIEMAT), funded by the European Regional Development Fund (ERDF). CETA-CIEMAT belongs to CIEMAT and the Government of Spain. The authors also thankfully acknowledge the computer resources and the technical support provided by the Plataforma Andaluza de Bioinformática of the University of Málaga.
REFERENCES
[1] Berman, H. M.; Westbrook, J.; Feng, Z.; Gilliland, G.; Bhat, T. N.; Weissig, H.; Shindyalov, I. N.; Bourne, P. E. The Protein Data Bank. Nuc. Acids Res. 2000, 28, 235–242.
[2] Agatanovic-Kustrin, S.; Turner, J.V. Artificial neural network modeling of phytoestrogen binding to estrogen receptors. Lett. Drug Des. Discover. 2006, 7, 436–442.
[3] Khadikar, P.V.; Deeb, O.; Jaber, A.; Singh, J.; Agrawal, V.K.; Singh, S.; Lakhwani, M. Development of quantitative structure-activity relationship for a set of carbonic anhydrase inhibitors: Use of quantum and chemical descriptors. Lett. Drug Des. Discover. 2006, 3, 622–635. [4] Mishra, N. K.; Raghava, G.P.S. Prediction of specificity and cross reactivity of kinase inhibitors.
Lett. Drug Des. Discover. 2011, 8, 223–228.
[5] Sanchez, R.; Sali, A. Large-scale protein structure modeling of the Saccharomyces cerevisiae genome. PNAS 1998, 95, 13597–13602.
[6] Jorgensen, W. L. The many roles of computation in drug discovery. Scienc 2004, 303, 1813–8. [7] Yuriev, E.; Agostino, M.; Ramsland, P. A. Challenges and advances in computational docking:
2009 in review. J. Mol. Recognit. 2011, 24, 149–164.
[8] Huang, S.-Y.; Zou, X. Advances and challenges in protein-ligand docking. Int. J. Mol. Sci. 2010, 11, 3016–34.
[9] Morris, G. M.; Goodsell, D. S.; Halliday, R. S.; Huey, R.; Hart, W. E.; Belew, R. K.; Olson, A. J. Automated docking using a Lamarckian genetic algorithm and an empirical binding free energy function. J. Comp. Chem. 1998 19, 1639–1662.
[10] Friesner, R. A.; Banks, J. L.; Murphy, R. B.; Halgren, T. A.; Klicic, J. J.; Mainz, D. T.; Repasky, M. P.; Knoll, E. H.; Shelley, M.; Perry, J. K.; Shaw, D. E.; Francis, P.; Shenkin, P. S. Glide: A New Approach for Rapid, Accurate Docking and Scoring. 1. Method and Assessment of Docking Accuracy. J. Med. Chem. 2004 47, 1739–1749.
[11] Ewing, T. J.; Makino, S.; Skillman, a G.; Kuntz, I. D. DOCK 4.0: search strategies for automated molecular docking of flexible molecule databases. J. Comput. Aided Mol. Des. 2001, 15, 411–28. [12] Wang, R.; Lu, Y.; Fang, X.; Wang, S. An extensive test of 14 scoring functions using the
PDBbind refined set of 800 protein-ligand complexes. J. Chem. Inf. Comput. Sci. 2004, 44, 2114– 2125.
[13] Jorgensen, W. L. The many roles of computation in drug discovery. Science 2004, 303, 1813– 1818.
[14] Metropolis, N.; Rosenbluth, A. W.; Rosenbluth, M. N.; Teller, A. H.; Teller, E. Equation of state calculations by fast computing machines. J. Chem. Phys. 1953, 21, 1087–1092.
[15] Sánchez-Linares, I.; Pérez-Sánchez, H.; Cecilia, J. M.; García, J. M. High-Throughput parallel blind Virtual Screening using BINDSURF. BMC Bioinformatics 2012, 13, S13.
[16] Bodor, N.; Harget, A.; Huang, M.J. Neural network studies. 1. Estimation of the aqueous solubility of organic compounds. J. Am. Chem. Soc. 1991, 113, 9480–9483.
[17] Schneider, G.; Wrede, P. Artificial neural networks for computer-based molecular design. Prog. Biophys. Mol. Biol. 1998, 70, 175–222.
[18] Peterson, K.L. Artificial Neural Networks and Their use in Chemistry. Rev. Comp. Ch. 2007, 16, 53-140.
[19] Jorgensen, W.L; Duffy, E.M. Prediction of drug solubility from structure. Adv. Drug. Deliv. Rev. 2002, 54, 355-66.
[20] Taskinen, J; Yliruusi, J. Prediction of physicochemical properties based on neural network modelling. Adv. Drug Deliv. Rev. 2003, 55, 1163–1183.
[21] Durrant, J. D.; McCammon, J. A. NNScore: A Neural-Network-Based Scoring Function for the Characterization of Protein-Ligand Complexes. J. Chem. Inf. Model. 2010, 50, 1865–1871. [22] Durrant, J. D.; McCammon, J. A. NNScore 2.0: A Neural-Network Receptor–Ligand Scoring
Function. J. Chem. Inf. Model. 2011, 51, 2897–2903.
[23] Weisel, M.; Kriegl, J.M.; Schneider, G. Architectural repertoire of ligand-binding pockets on protein surfaces. Chembiochem. 2010, 11, 556-563.
[24] Pal, N.R.; Panja, R. Finding short structural motifs for re-construction of proteins 3D structure. Appl. Soft Comput. 2013, 13, 1214–1221.
[25] Romero Reyes, I.V.; Fedyushkina, I.V.; Skvortsov, V.S.; Filimonov, D.A Prediction of
progesterone receptor inhibition by high-performance neural network algorithm. Internat. J. Math. Models and Methods Appl. Sci. 2013, 7, 303-310.
[26] Venables, W. N.; Ripley, B. D. MASS: modern applied statistics with S; Springer: New York, 2002.
[27] Cortes, C.; Vapnik, V. Support-Vector Networks. Mach. Learn. 1995, 20, 273–297.
[28] Jorissen, R. N.; Gilson, M. K. Virtual Screening of Molecular Databases Using a Support Vector Machine. J. Chem. Inf. Model. 2005, 45, 549–561.
[29] Warmuth, M.K.; Liao, J; Rätsch, G.; Mathieson, M.; Putta, S.; Lemmen, C. Active learning with support vector machines in the drug discovery process. J. Chem. Inf. Comput. Sci. 2003, 43, 667-73.
[30] Kriegl, J. M.; Arnhold, T.; Beck, B.; Fox, T. Prediction of Human Cytochrome P450 Inhibition Using Support Vector Machines. QSAR Comb. Sci. 2005, 24, 491–502.
[31] Lee, D. E.; Song, J.-H.; Song, S.-O.; Yoon, E. S. Weighted Support Vector Machine for Quality Estimation in the Polymerization Process. Ind. Eng. Chem. Res. 2005, 44, 2101–2105.
[32] Ivanciuc, O. Applications of Support Vector Machines in Chemistry. Rev. Comp. Ch. 2007, 2. 291–400.
[33] Huang, N.; Shoichet, B. K.; Irwin, J. J. Benchmarking Sets for Molecular Docking. J. Med. Chem. 2006, 49, 6789–6801.
[34] Cao, D.-S.; Xu, Q.-S.; Hu, Q.-N.; Liang, Y.-Z. ChemoPy: freely available python package for computational biology and chemoinformatics. Bioinformatics 2013, 29, 1092–1094.
![Table 1. Number of active (ligands) and inactive compounds (decoys) for each of the sets used in this study, obtained from DUD [33]](https://thumb-us.123doks.com/thumbv2/123dok_us/9722460.2853828/10.892.223.668.314.452/table-number-active-ligands-inactive-compounds-decoys-obtained.webp)