Please cite this article as: M. Dehghan Manshadi, H.Vahdat-Nejad, M. Kazemi-Esfeh, M. Alavi,Speed Detection in Wind-tunnels by Processing Schlieren Images, International Journal of Engineering (IJE), TRANSACTIONSA: Basics Vol. 29, No. 7, (July 2016) 962-967
International Journal of Engineering
J o u r n a l H o m e p a g e : w w w . i j e . i rSpeed Detection in Wind-tunnels by Processing Schlieren Images
M. Dehghan Manshadia, H.Vahdat-Nejad*b, M. Kazemi-Esfeha, M. Alavib
a Department of Mechanical & Aerospace Engineering, Malek-Ashtar University of Technology, Isfahan, Iran b Department of Computer Engineering, University of Birjand, Iran
P A P E R I N F O
Paper history: Received 10 March 2016
Received in revised form 22 April 2016 Accepted 02 June 2016
Keywords: Classification Schlieren Imaging Image Processing Feature Vector Wind-tunnel
A B S T R A C T
Schlieren imaging in wind-tunnels is extensively utilized to study the effects of air on an airplane surface. One of the interesting subjects for research is to study the effects of speed change on the airplane surface. Speed change results in occurrence of shock waves, which are visualized as lines on Schlieren images. In this paper, we study the problem of detecting speed of after occurrence of a shock wave. For this, a two-level scheme is proposed which involves Schlieren image processing and classification. In the first stage, favorite features are extracted from a Schlieren image, which are represented as a feature vector. These features are related to the power and impact of the shock wave and are extracted through the proposed image processing schemes. In the second stage, a classification system is proposed, which categorizes Schlieren images according to their features. Each class represents one specific case of speed change. Experimental results are conducted in Wind-Tunnel laboratory of the Malek Ashater University of Technology. For evaluation, we have taken images, which lie in five classes. The results of applying the proposed system to the test images show a perfect accuracy rate.
doi: 10.5829/idosi.ije.2016.29.07a.11
1. INTRODUCTION1
Schlieren imaging is widely utilized as a promising technique to visualize speed changes in wind-tunnels12 [1]. In a wind-tunnel, the plane surface is exposed to a stream of wind, which simulates the plane movement in the sky. Speed change of the plane is simulated by changing the speed of the wind stream, which results in density changes at the space around the plane. These density changes, which are referred to as shock waves, are visualized as lines in the Schlieren images of the wind-tunnel [2].
One of the important problems in aerodynamic is to estimate the speed of the plane by analyzing Schlieren images that have been taken at the time of the speed change. In fact, the issue is to estimate current speed of the plane, by processing shock waves that have been visualized on the Schlieren image. This is a problem in aerodynamic that can be solved by computer science,
1*Corresponding Author’s Email: [email protected] (H. Vahdat-Nejad)
12http://www.photron.com/?cmd=casestudy&type=schlieren
specifically image processing [3] and pattern recognition [4] subjects.
Image processing [5] concerns with diverse processes that can be applied on images. We aim to make use of it to extract interested characteristics from a Schlieren image. Although a typical image has numerous characteristics and features, we try to select those that are influenced by speed change of the plane.
Afterwards, we make use of these features to detect current speed of the plane at the time of speed transition. For this, we utilize pattern recognition [6] and propose a classification system. At first, the system is trained by some known-valued Schlieren images. Finally, we evaluate the system by entering some new Schlieren images. These images are regarded as test images. The system extracts feature values of these images, and therefore, classifies and detects the speed before and after the occurrence of shock wave. Finally, the estimated values are compared to the real speed values, which can be approximately obtained via sophisticated mathematics computations, and the amount of precision of the system is calculated.
Evaluation results show the feasibility of detecting speed of the plane in the wind-tunnel by processing Schlieren images. Moreover, they demonstrate an approximate perfect precision in classifying speed. Rest of the paper is organized as follows. After this introduction, section 2 presents some background information about Schlieren imaging as well as the most related works. Section 3 describes functionality of the proposed system. Section 4 demonstrates experimental and evaluation results, and finally, section 5 concludes the paper.
2. SCHLIEREN IMAGING
Schlieren imaging was innovated in the 1864 by German Physicist August Toepler, as a method to detect flaw or 'schliere' in glass. Schlieren (plural for the German word “schliere”) are optical heterogeneities in transparent substances23. Schlieren imaging has gained many applications in various domains such as manufacturing, safety tests and energy optimization [7]. Nowadays, this method is widely exploited to visualize shock waves in wind-tunnels34. In Aerodynamic, Wind Tunnel aims to simulate flows of air passing near the surface of the plane. It consists of a tunnel, in which the flow of air is transmitted at the desired speed. By placing a model of a plane shape inside the tunnel, effects of the air flow on the surface of the plane can be investigated. One of these effects is made upon sudden changes in the plane speed. Speed change results in changing the density of the surrounding air, which causes refraction of the light beam. According to physics, when a beam of light passes through a transparent substance like air, any change in density results in refraction of the beam [8]. By using this fact, the Schlieren system visualizes density changes by dark lines.
Previously, several pieces of research have been performed to estimate various features from flows by processing Schlieren images including the amplitude of internal waves [9], density gradients [10], and density perturbations [1]. All of these have proposed simple Schlieren image analysis techniques to estimate the interested features.
Velocity is one of the important features of a Schlieren image. In the earliest stage, Townend [11] has introduced Schlieren velocimetry; however, it was impractical before the emergence of computers. Afterward, a series of digital images have been utilized in order to track particles suspended in the moving fluid [12]. Therefore, planner velocity estimation has been performed for the fluid-dynamic systems [13]. Schlieren image velocimetry is the technique of exploiting image
23http://www.aerolab.com/Schlieren.html
34http://www.photron.com/?cmd=casestudy&type=schlieren
processing in refractive turbulent flows to estimate velocity. As an example Fu and Wu [14] make use of it to measure velocity distributions in gas fires and explosions.
In this paper, we further extend the Schlieren image velocimetry by investigating model of a plane in the wind-tunnel. The plane is exposed to a wind stream which is changed during the experiment. By analyzing the photographed schlieren image, the proposed system detects the primary and secondary speed of the wind stream.
3. THE PROPOSED SYSTEM
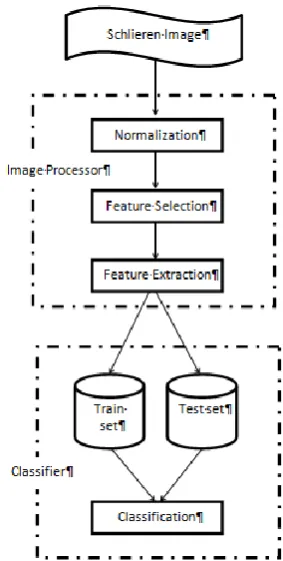
In this section, we describe the proposed system, which detects speed of the plane before and after occurrence of shock wave by analyzing Schlieren images. The system mainly consists of two components: (a) Schlieren image processor component, which aims to extract interested features from the image, and (b) speed detector component, which exploits a classification scheme. Similarly, the system could be applied to estimate other parameters such as pressure. Figure 1 illustrates the overview of the system.
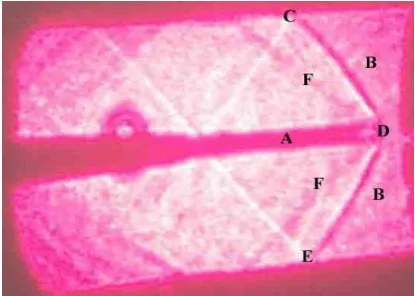
Figure 2 shows a typical Schlieren image that has been taken in the Wind-Tunnel laboratory of the Malek-Ashtar University of Technology.
Figure 2.A typical Schlieren image taken in the Wind-Tunnel
In this image, the horizontal dark object, which is distinguished by A, is part of the surface of the photography model (plane). At the right-side of the image (point B), speed of the plane is 2 Mach (i.e. twice the speed of sound). Recall, Mach is the unit for measuring speed, and is equal to the speed of sound. At the place of lines CD and DE, a transition in speed occurs, which results in a shock wave. The shock wave is visualized as lines CD and DE by the Schlieren imaging system. After the shock wave (at point F), speed decreases to 1.86 Mach. The new speed is
computed through complex and approximate
Aerodynamic formulas. In the following subsections, the components of the proposed system are described:
3.1. Processing Schlieren Image The aim of
processing Schlieren images is to extract features that may be relevant to speed change. We propose to utilize three features that are influenced by speed change of the plane. In continue, the proposed features are described:
Refraction angle between lines CD and DE- As
described earlier, lines CD and DE are appeared as a result of speed change. According to aerodynamic, the more the speed changes, the less the formed angle becomes. Therefore, we intend to compute the angle by image processing techniques. The utilized method is based on computing the equations of the two intersecting lines. Afterward, by mathematics relationships, the angle could be computed.
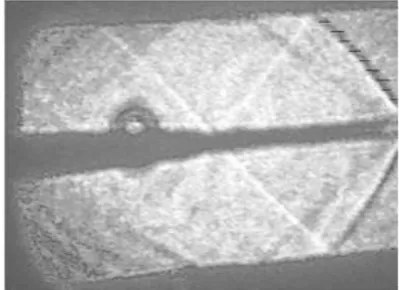
To obtain the equation of a line, we acquire some sample points of the line. For this, we use two guard-lines, which specify the vicinity of the line. Figure 3 shows assumed guard-lines for 2 different lines that visualize the shock wave. Afterward, some random points inside the pair of guard-lines are selected and the minimum intensity points are searched in their row.
These points are some of the darkest points inside the pair of guard-lines. To obtain them, we scan the line starting from a point on left guardline until reaching the right guardline. This is performed by a loop in programming languages. Meanwhile we keep the
coordinates of the darkest point. Therefore, we assume that they are located on the line. Afterward, the equation of the approximated line that is constructed by and passed through these points is interpolated. Matlab toolbox provides the “Polyfit” function that could perform this action. Finally, by applying mathematics functions, the refraction angle between lines is computed and utilized as the first feature.
Intensity difference of the line and its two
sides-Another parameter, which is influenced by the shock wave is the intensity of the visualized line. Therefore, we consider intensity difference between the line and its both sides. To acquire this feature, we need to compute mean intensity of line, its left side, and its right side. For the previous feature, we have produced some sample points of line that are used to estimate the mean intensity of line.
To obtain right and left-side mean intensity, we use 10 random points of line. Therefore, a horizontal mask (1×n pixels) with acceptable row distance from any of these points is generated both in right and left-sides. In figure 4, 10 right-side and 10 left-side masks are shown as dark lines. Mean intensity of all right-side masks is considered as the approximate intensity of right-side of the line. Correspondingly, mean intensity of all left-side masks is regarded as the approximate intensity of left-side of the line. Finally, mean difference of intensity of line and its both sides is computed and utilized as the second feature.
Mean width of line-We expect the width of the
visualized lines to be different and influenced by the strength of the shock wave. Hence, we propose mean width of the line as the third feature. To compute it, we utilize previously generated random points of the line.
For this, we introduce two new thresholds: (a) right-side threshold (TR), which is calculated by averaging the intensity level of line and its right-side:
(1)
Figure 4. Masks used to compute intensity of left and right-side of the line
Similarly, left-side threshold (TL) is obtained by the following formula:
(2) Finally, we start from any of the selected points of line and keep going to right until the TR is not passed. Meanwhile, the number of pixels of the row is computed. Similarly, we go to left from any of the selected points of line until the TL is not passed, and count the number of pixels of the row. We define width of line at any of these points as the total number of right-side and left-side pixels that have been counted. Therefore, the approximate width of line is obtained by averaging line width for all samples. Figure 5 shows the scheme.
3.2. CLASSIFICATION After extracting the interested features from a Schlieren image, the classification process is started. A classification system mainly consists of two parts [15]: (a) the training phase, and (b) the test phase. In the training phase, the system is trained by utilizing some Schlieren images that we know their primary and secondary speeds.
Figure 5. The approximate scheme to compute line width
In other words, we are going to provide some images along with their initially and new speed (after speed change) to the system to train it. Each image is processed by the system to extract the value of proposed features. Afterward, the image is summarized as a three-valued vector, in which the first, second, and third attributes are refraction angle between two pieces of line, intensity difference of the line and its two sides, and mean width of line, respectively.
Besides, for each distinct primary to secondary speed pair, a new class is considered. Classes are referred to as increasing numbers starting from one (i.e. 1, 2, 3, etc). Therefore, each class (e.g. 3) refers to a specific primary to secondary speed map (e.g. 2.5 to 1.8). As a result, for each training Schlieren image a four attribute vector is created in which the first three attributes are the extracted features, and the fourth attribute represents the class number. Finally, the system is trained by these vectors.
After performing the training procedure, the system can be applied to determine the nearest class number for any new Schlieren image. For this, when a new unknown Schlieren image arrives, the system extracts the three features by processing it. Afterward, the three attribute vector represents the image. Hence, we use a classification algorithm to map the feature vector into one of the known classes. The class that is resulted from the classification system shows an estimation of the secondary speed of the plane.
4. EXPRIMENTS
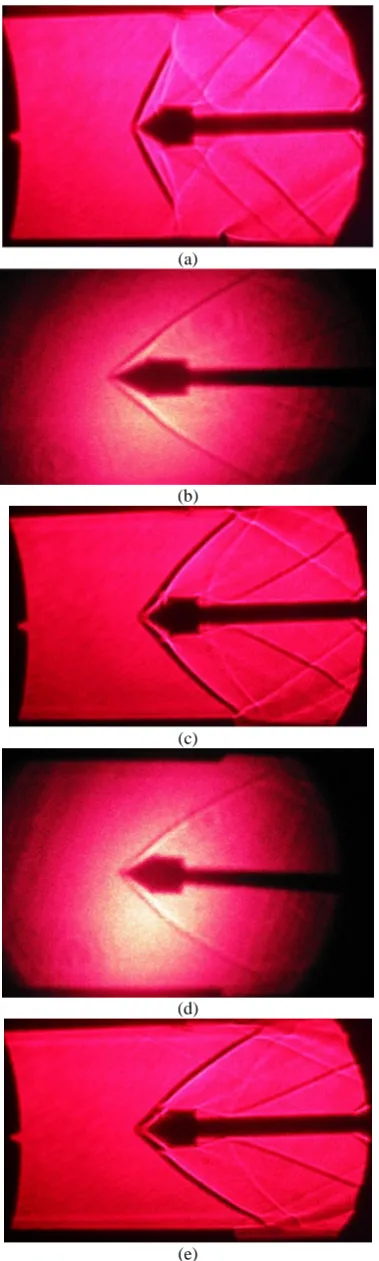
To evaluate the proposed system, we have performed Schlieren photography under five scenarios. In these scenarios, the initial speed of the wind-tunnel is set to 2, 2.25, 2.5, 2.75, and 3 Mach, respectively. After a while, wind speed has changed in all scenarios. With mathematical computations, we estimate that the new speed (after shock wave) for scenarios 1 to 5 is about 1.36, 1.51, 1.65, 1.78, and 1.9 Mach, respectively. We have taken four images in the conditions of each scenario. Figure 6 shows one of the taken images for each scenario.
In the next stage, all images are processed to acquire their three-valued feature vectors. Table 1 shows extracted features for a typical image of each class. Afterward, we use 75 percent of images of each scenario as the training set and the others for test.
(a)
(b)
(c)
(d)
(e)
Figure 6. Typical images used in (a) Scenario 1, (b) Scenario 2, and (c) Scenario 3, (d) Scenario 4, (e) Scenario 5
TABLE 1. Feature values extracted from one typical image of each class
Image Refraction
angle(deg)
Intensity difference
Line width (Pixel)
Scenario 1 122 49.5 36
Scenario 2 108 42 31
Scenario 3 95 38 27.5
Scenario 4 90 35.5 26
Scenario 5 88 32.5 25
TABLE 2. Classification results
Scenario Accuracy(%)
1 100
2 100
3 100
4 100
5 100
The results show a 100 percent accuracy of classifying test images. More precisely, the SVM classifier assigns the feature vector of the image of each scenario to the corresponding scenario class. Table 2 shows the results of classification.
It should be noted that, while the images of each scenario are similar from the view point of the proposed features, they are a bit different from other scenarios images. As a result, as expected, the SVM classifier performs a good job in detecting the correct class number. Because of our schlieren photography limitations, we were unable to increase the number of scenarios. However, in that case, an accuracy error may be introduced, as a result of similarity of feature vectors of some distinct classes.
5. CONCLUSION AND FUTURE WORKS
In this paper, a two-level system has been proposed for processing and classifying Schlieren images that have been taken from an object in the Wind-Tunnel. In the processing stage, a vector including three proposed features has been extracted from a Schlieren image. Afterward, a classification system has been implemented, which aims to classify images according to their preliminary and secondary speeds. Experimental results have shown a perfect accuracy in classification results.
the training phase of the classification step should be performed again by the new images. After training, the system is ready to classify new images taken by the imaging system.
The drawback of the proposed system is that it detects initial and secondary speed by classifying the new image into one of the known classes. However, there are situations in which none of the classes may exactly represent, and therefore, be suitable for a new image. The next step of this research is to address this issue by designing a genetic fuzzy system that accurately estimates the new speed.
6. REFRENCES
1. Davidhazy, A., "Introduction to shadowgraph and schlieren imaging", (2006).
2. Mazumdar, A., "Principles and techniques of schlieren imaging systems", Columbia University, Department of Computer Science, (2011).
3. Acharya, T. and Ray, A.K., "Image processing: Principles and applications, John Wiley & Sons, (2005).
4. Jain, A.K., Duin, R.P.W. and Mao, J., "Statistical pattern recognition: A review", IEEE Transactions on Pattern Analysis and Machine Intelligence, Vol. 22, No. 1, (2000), 4-37.
5. Gonzalez, R.C. and Woods, R.E., "Digital image processing", Nueva Jersey, (2008).
6. Owlia, M. and Fallahnezhad, M., "A new statistical approach for recognizing and classifying patterns of control charts (research note)", International Journal of Engineering-Transactions A: Basics, Vol. 28, No. 7, (2015), 1040-1048.
7. Settles, G., Schlieren and shadowgraph techniques: Visualizing phenomena in transparent media. (2002).
8. Sorensen, R.M., "Wave refraction, diffraction, and reflection", Basic Coastal Engineering, (2006), 79-111.
9. Onu, K., Flynn, M. and Sutherland, B., "Schlieren measurement of axisymmetric internal wave amplitudes", Experiments in fluids, Vol. 35, No. 1, (2003), 24-31.
10. Meier, G., "Computerized background-oriented schlieren", Experiments in fluids, Vol. 33, No. 1, (2002), 181-187. 11. Townend, H.C.H., "A method of air flow cinematography
capable of quantitative analysis", Journal of the Aeronautical Sciences, Vol. 3, No. 10, (1936), 343-352.
12. Raffel, M., Willert, C.E., Wereley, S. and Kompenhans, J., "Particle image velocimetry: A practical guide, Springer, (2013).
13. Hargather, M.J., Lawson, M.J., Settles, G.S. and Weinstein, L.M., "Seedless velocimetry measurements by schlieren image velocimetry", AIAA Journal, Vol. 49, No. 3, (2011), 611-620. 14. Fu, S. and Wu, Y., "Detection of velocity distribution of a flow
field using sequences of schlieren images", Optical Engineering, Vol. 40, No. 8, (2001), 1661-1666.
15. Godbole, S. and Sarawagi, S., "Discriminative methods for multi-labeled classification", in Pacific-Asia Conference on Knowledge Discovery and Data Mining, Springer. (2004), 22-30.
16. Cortes, C. and Vapnik, V., "Support-vector networks", Machine Learning, Vol. 20, No. 3, (1995), 273-297.
Speed Detection in Wind-tunnels by Processing Schlieren Images
RESEARCH NOTEM. Dehghan Manshadia, H.Vahdat-Nejadb, M. Kazemi-Esfeha, M. Alavib
a Department of Mechanical & Aerospace Engineering, Malek-Ashtar University of Technology, Isfahan, Iran b Department of Computer Engineering, University of Birjand, Iran
P A P E R I N F O
Paper history: Received 10 March 2016
Received in revised form 22 April 2016 Accepted 02 June 2016
Keywords: Classification Schlieren Imaging Image Processing Feature Vector Wind-tunnel
ديكچ ه
لًَت رد يیرلیض یرادربریَػت ُدرتسگ رَط ِب داب یاّ
.تسا ُذض ُدافتسا اویپاَّ حطس رب اَّ ىایرج راثآ ِعلاطه رَظٌه ِب یا
عَقٍ ِب رجٌه تعرس رییغت .تسا ِجَت درَه یتاقیقحت تاعَضَه زا یکی اویپاَّ حطس یٍر رب تعرس رییغت راثآ ِعلاطه
یه ِبرض جَه یه رّاظ يیرلیض ریٍاػت یٍر رب یطَطخ ترَغ ِب ِک دَض
سپ تعرس عیخطت ِلاسه ،ِلاقه يیا رد .ذًَض
یه یسررب ِبرض جَه عَقٍ زا ِیلا ٍد حرط کی رَظٌه يیا یارب .ددرگ
یه داٌْطیپ یا ٍ يیرلیض ریَػت شزادرپ لهاض ِک دَض
ِقبط یگژیٍ ِلحره يیلٍا رد .تسا یذٌب لطه یاّ
یه جارختسا يیرلیض ریَػت زا بَ صیاوً یگژیٍ رادرب ترَغ ِب ٍ ذًَض
یه ُداد یگژیٍ يیا .ذًَض جارختسا یداٌْطیپ ریَػت شزادرپ نتسیس طسَت ٍ ذٌتسّ ِبرض جَه ریثات ٍ ترذق اب طبتره اّ
یه ِقبط نتسیس کی ،مٍد ِلحره رد .ذًدرگ یه داٌْطیپ یذٌب
یٍ قباطه ار يیرلیض ریٍاػت ِک دَض یگژ
ِتسد اًْآ یاّ یذٌب
یه صیاهزآ .تسا تعرس رییغت زا ظاخ تلاح کی رگًایاوً سلاک رّ .ذٌک کلاه یتعٌغ ُاگطًاد داب لًَت ُاگطیاهزآ رد اّ
یه رارق ِتسد جٌپ رد ِک تسا ُذض ُدافتسا یریٍاػت زا یبایزرا یارب .تسا ُذض ماجًا رتضا ُدایپ جیاتً .ذًریگ
یبایزرا ٍ یزاس
طیپ نتسیس .تسا یػقً ىٍذب تقد خرً ُذٌّد ىاطً ،تست ریٍاػت یٍر رب یداٌْ