This is a repository copy of
An empirical study on the use of defect prediction for test case
prioritization
.
White Rose Research Online URL for this paper:
http://eprints.whiterose.ac.uk/163394/
Version: Accepted Version
Proceedings Paper:
Paterson, D., Campos, J., Abreu, R. et al. (3 more authors) (2019) An empirical study on
the use of defect prediction for test case prioritization. In: 2019 12th IEEE Conference on
Software Testing, Validation and Verification (ICST). 2019 12th IEEE Conference on
Software Testing, Validation and Verification (ICST), 22-27 Apr 2019, Xian, China. IEEE ,
pp. 346-357. ISBN 9781728117379
https://doi.org/10.1109/icst.2019.00041
© 2019 IEEE. Personal use of this material is permitted. Permission from IEEE must be
obtained for all other users, including reprinting/ republishing this material for advertising or
promotional purposes, creating new collective works for resale or redistribution to servers
or lists, or reuse of any copyrighted components of this work in other works. Reproduced
in accordance with the publisher's self-archiving policy.
[email protected] https://eprints.whiterose.ac.uk/ Reuse
Items deposited in White Rose Research Online are protected by copyright, with all rights reserved unless indicated otherwise. They may be downloaded and/or printed for private study, or other acts as permitted by national copyright laws. The publisher or other rights holders may allow further reproduction and re-use of the full text version. This is indicated by the licence information on the White Rose Research Online record for the item.
Takedown
If you consider content in White Rose Research Online to be in breach of UK law, please notify us by
An Empirical Study on the Use of Defect
Prediction for Test Case Prioritization
David Paterson
∗, Jos´e Campos
†, Rui Abreu
‡, Gregory M. Kapfhammer
§, Gordon Fraser
¶and Phil McMinn
∗∗University of Sheffield,†University of Washington,‡INESC-ID and IST, U.Lisbon,§Allegheny College, ¶University of Passau
Abstract—Test case prioritization has been extensively re-searched as a means for reducing the time taken to discover regressions in software. While many different strategies have been developed and evaluated, prior experiments have shown them to not be effective at prioritizing test suites to find real faults. This paper presents a test case prioritization strategy based on defect prediction, a technique that analyzes code features – such as the number of revisions and authors — to estimate the likelihood that any given Java class will contain a bug. Intuitively, if defect prediction can accurately predict the class that is most likely to be buggy, a tool can prioritize tests to rapidly detect the defects in that class. We investigated how to configure a defect prediction tool, called Schwa, to maximize the likelihood of an accurate prediction, surfacing the link between perfect defect prediction and test case prioritization effectiveness. Using 6 real-world Java programs containing 395 real faults, we conducted an empirical evaluation comparing this paper’s strategy, called G-clef, against eight existing test case prioritization strategies. The experiments reveal that using defect prediction to prioritize test cases reduces the number of test cases required to find a fault by on average 9.48% when compared with existing coverage-based strategies, and 10.5% when compared with existing history-based strategies.
Index Terms—Regression testing, Test case prioritization, De-fect prediction, Continuous testing, Empirical studies
I. INTRODUCTION
Software regressions occur when new changes affect code that was previously shown to be working correctly. For ex-ample, if methodA changes its return value and methodB relies on the return value from methodA, then it may no longer function correctly. In order to detect regressions in correctness, developers often create a test suite that executes methods with example inputs and compares theexpectedresult to the actual result [1]. However, as software evolves and becomes increasingly complex, the number of tests that are required to ensure correct functionality also grows, leading to a commensurate increase in the time taken to execute the test suite. Since it often may take too much time to re-execute all of the tests for every change made to the system, developers may not know whether or not they have introduced regressions.
Aiming to reduce the time taken to detect regressions, researchers have created a variety of regression testing tech-niques [2]. These include test case selection, which uses information about the current change set (i.e., the classes or methods that have been modified) to define a subset of tests that may discover any regressions. Test suite minimization attempts to find test cases that are redundant or irrelevant in light of new tests that may take similar actions. Finally, test case prioritization aims to identify the tests that are
most likely to detect a fault, placing them first to allow for the rapid detection of latent regressions. Importantly, recent studies reveal that previously evaluated strategies may be less effective at prioritizing test cases to detect real faults when compared to other fault types (e.g., [3], [4]). This result is due, in part, to the relative complexity of real faults and the use of na¨ıve coverage-based approaches under the assumption that high-coverage tests are more likely to detect faults.
Defect prediction estimates the likelihood of a file/function within a software system as being faulty. Previous experiments have shown that these methods are effective at highlighting the location of real faults in complex software [5]–[8]. This paper presents a test case prioritization strategy, called G-clef, that uses bug prediction data to reorder a test suite so that it first focuses on those classes that are most likely to contain faults. Intuitively, the more accurate a defect predictor is, the smaller the subset of the test suite needed to find potential bugs.
Since there are many ways to perform test case prioritiza-tion, this paper considers three maingroups of strategies for comparison to G-clef. The first group of strategies are based
on a single-versionof the subject program. These strategies
consider the current version of the program and order tests according to some heuristic. Second, we study strategies, based on thetest history, which considertest casesthat have recently failed. This makes these strategies closely related to defect prediction, which considersfiles that have been faulty. Finally, strategies involving the software history have been proposed. These approaches use features of the software under test to predict which test cases should be executed. However, previous work evaluating these strategies found they were less effective [9]. TableIcontains examples of single-version, test history and software-history approaches to test prioritization.
Finally, this paper presents an empirical evaluation of G-clef, using real faults from DEFECTS4J [10] to enhance the study’s validity. First, we compare G-clef with four coverage-based strategies, using 365 real faults. We also compare G-clef to four test-history strategies. For this phase of experimenta-tion, 82 faults of the DEFECTS4J set qualified for further use. This experiment reveals that G-clef significantly outperforms six of the eight strategies, reducing the average number of test cases required to find a fault by 4.8-15.3%. In summary, the contributions of this paper are twofold: 1) a new test case prioritization strategy that uses defect prediction to reorder a test suite, and 2) an empirical study on real faults to compare the proposed strategy with nine previously proposed strategies.
II. BACKGROUND A. Test Case Prioritization
Test case prioritization aims to decrease the cost of regres-sion testing by finding a test case ordering that maximizes the fault detection capability of the test suite [11], such that any faults in a program can be quickly identified by running a reduced number of tests. Definition 1 defines it as [12]:
Definition 1: Test Case Prioritization
Requirements:
T, a test suite
P T, the set of permutations ofT
f, a function that gives a numerical score forT′∈
P T Problem: FindT′∈ P T such that (∀T′′ )(T′′ ∈P T)(T′′ 6 =T′ )[f(T′ )≥f(T′′ )]
In order to maximize the fault detection capability of the test suite, an appropriate f function must be chosen to select the permutation T′
that finds all regressions as soon as possible. Since we cannot know about either the existence or location of faults prior to running the test suite, f can only be a surrogate for actual fault detection. Most previous research on test case prioritization has tried to find an implementation of f that most closely approximates fault detection, using a variety of strategies (e.g., [12]–[15]). In TableI, we categorize a non-exhaustive, but representative, list of previous test case prioritization research into three groups: strategies that are based on asingle versionof the software under test (e.g., [12], [13]), strategies based on thesoftware history(e.g., [9], [16]), and strategies based on the test history(e.g., [17], [18]). B. Bug Prediction
One of the most explored topics in Mining Software Repos-itories (MSR) isbug prediction[24]. Typically, bug prediction (also known as fault prediction [25]) approaches predict the likelihood of a component (e.g., file) being faulty in the future based on historical data from a version control system [7].
As reported by Graves et al. [6], the two best predictors of bugs are prior bugs and prior changes. As such, researchers have proposed several techniques based on these two key factors; due to space constraints we survey them briefly in this section. For instance, Kim et al. [26] proposed a cache-based approach in which files involved in a bug fix are stored in a cache and used to predict future faults. Kim et al.’s assumptions were that new changes are likely to be more faulty than old changes and that a file that contained a fault in the past is likely to contain further faults. Men-zies et al. [8] proposed a prediction model based on static code attributes. Moser et al. [27] and Kim et al. [28] used machine learning techniques based on previous code changes and Hassan et al. [29] used the complexity of previous code changes, to predict future faults. Rahman et al. [30] proposed an approach that ranks files by the number of times there were involved in a fix commit. Although simple, it performed similarly to more sophisticated and complex approaches (e.g.,
Kim et al. [26]) and the Google Engineering team has used it1 [31]. We next discuss this approach and its enhancements.
1) Schwa: Given a Git2 repository of a Java project, the
Schwa tool3[32] extracts information from each commit, such
as its message, author, timestamp, list of all modified files, and the changes performed (i.e., the diff). It performs a bug prediction computation based on three metrics that have been shown to be effective at predicting bugs: 1) revisions [6] (how often a Java class has been changed), 2) fixes [5] (how often a Java class has been fixed), and 3) authors [33] (how often a Java class has been modified by more than one developer). Schwa is robust, readily available software that is not language specific, making it a suitable choice for many subjects.
Schwa uses a ranked-based technique, Time-Weighted Risk (TWR) [31], [32], to estimate how reliable a Java class is:
TWR(α) = 1
1 +e−12α+w (1)
whereαis a normalized timestamp of a bug-fixing commit in the range0.0≤α≤1.0, where0.0represents the first bug fix commit’s timestamp and 1.0 is the timestamp of the last bug fix commit; herewis used to weight the importance of newer bug fix commits as opposed to older commits. Lewis et al. [31] suggested w = 12 as a good value to score the files of two Google projects by their bug-propensity. Rather than a fixed value, Schwa uses w = 2 + ((1−TR)×10), where TR
represents the time-range of bug fix commits:TRvalues close to 0.0 indicate that newer commits are more important than older commits, whereas TR values close to 1.0 indicate the inverse. It is important to note that if TR = 0.0, then w is equal to12, the original value suggested by Lewis et al. [31]. Schwa estimates the likelihood that a Java classccontains a bug using Equation2, in which each of the three factors (i.e., revisions, authors, and fixes) is calculated and modified by a weight, where the sum of all weights must be equal to 1.
βc=RevisionsWeight× X Rc∈R TWR(Rc) +AuthorsWeight× X Ac∈A TWR(Ac) +FixesWeight× X Fc∈F TWR(Fc) (2) P Rc∈RTWR(
Rc) is the sum of all TWRs in which c has been modified. PAc∈ATWR(
Ac) is the sum of all TWRs in which a new author has modified c. PFc∈FTWR(
Fc) is the sum of all TWRs in which c has been involved in a fix operation.R,A, andFrepresent the revisions’, authors’, and fixes’ timestamps in whichc has been involved. The valueβc
is normalized to [0,1]and estimates the defect probability of
c,defectc= 1−e−βc. Intuitively, a Java classcwith a higher
defectc value is less reliable (i.e., is more likely to contain a
bug) than those classes with a lowdefectc value.
1http://google-engtools.blogspot.co.uk/2011/12/, accessed January 31, 2019. 2https://git-scm.com/, accessed January 31, 2019.
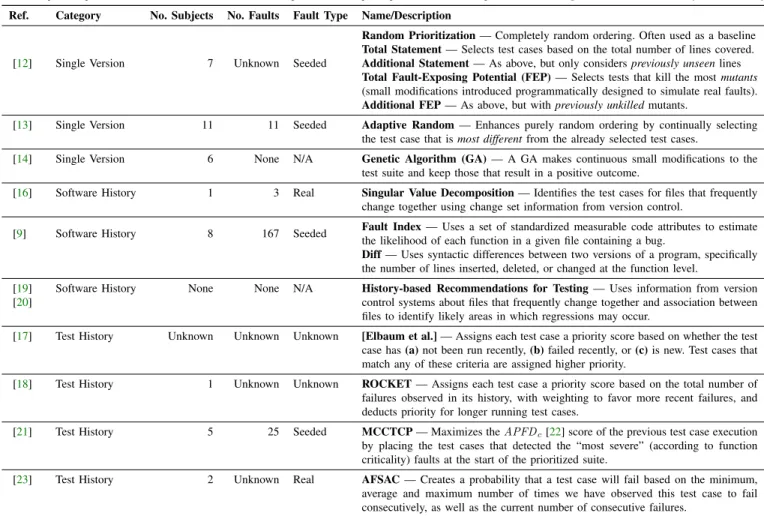
Table I: Existing strategies for test case prioritization based on single versions of software, software history, and test history.
This technique listing in the table is not exhaustive, but includes a representative sample of previous research categorized as eithersingle-version,software history, ortest history.
Ref. Category No. Subjects No. Faults Fault Type Name/Description
[12] Single Version 7 Unknown Seeded
Random Prioritization— Completely random ordering. Often used as a baseline Total Statement— Selects test cases based on the total number of lines covered. Additional Statement— As above, but only considerspreviously unseenlines Total Fault-Exposing Potential (FEP)— Selects tests that kill the mostmutants
(small modifications introduced programmatically designed to simulate real faults). Additional FEP— As above, but withpreviously unkilledmutants.
[13] Single Version 11 11 Seeded Adaptive Random— Enhances purely random ordering by continually selecting the test case that ismost differentfrom the already selected test cases.
[14] Single Version 6 None N/A Genetic Algorithm (GA)— A GA makes continuous small modifications to the test suite and keep those that result in a positive outcome.
[16] Software History 1 3 Real Singular Value Decomposition— Identifies the test cases for files that frequently change together using change set information from version control.
[9] Software History 8 167 Seeded Fault Index— Uses a set of standardized measurable code attributes to estimate the likelihood of each function in a given file containing a bug.
Diff— Uses syntactic differences between two versions of a program, specifically the number of lines inserted, deleted, or changed at the function level.
[19] [20]
Software History None None N/A History-based Recommendations for Testing— Uses information from version control systems about files that frequently change together and association between files to identify likely areas in which regressions may occur.
[17] Test History Unknown Unknown Unknown [Elbaum et al.]— Assigns each test case a priority score based on whether the test case has(a)not been run recently,(b)failed recently, or(c)is new. Test cases that match any of these criteria are assigned higher priority.
[18] Test History 1 Unknown Unknown ROCKET— Assigns each test case a priority score based on the total number of failures observed in its history, with weighting to favor more recent failures, and deducts priority for longer running test cases.
[21] Test History 5 25 Seeded MCCTCP— Maximizes theAPFDc[22] score of the previous test case execution by placing the test cases that detected the “most severe” (according to function criticality) faults at the start of the prioritized suite.
[23] Test History 2 Unknown Real AFSAC— Creates a probability that a test case will fail based on the minimum, average and maximum number of times we have observed this test case to fail consecutively, as well as the current number of consecutive failures.
III. G-CLEF
Algorithm1 illustrates the procedure of G-clef, which inte-grates defect prediction into a test case prioritization strategy. In order to prioritize test cases using Schwa, G-clef first orders the classes in a program by the bug prediction score produced by Schwa (line 1). For each of the classesc∈C, G-clef then identifies the tuple of test cases T′′ ⊆ T
that execute lines in c (line 4). Since this process returns many test cases, G-clef applies a secondary objective g(line 5), discussed in the following subsection, to orderT′′
using an alternative heuristic (e.g., coverage). Finally, G-clef places the ordered test cases into the prioritized suite (T′
) (line 5). Since G-clef starts with the class that is most likely to be faulty, and selects all tests that cover this class, better bug prediction will directly result in faster fault detection during test suite execution.
To illustrate how G-clef works, we introduce a small ex-ample program with 3 classes —ClassAhas 100 test cases and a defectc score of 0.8. ClassBhas 30 test cases and a defectc score of0.35, whileClassChas 1000 test cases and a defectc score of 0.1. G-clef starts by selecting all the test cases for ClassA, since this is the most likely to contain a bug. Following this, the secondary objectivedecides how the 100 tests for ClassA should be ordered. A good secondary objective will place first the test case that detects the fault.
Algorithm 1 G-clef
Input: Classes Under Test C={c1, c2, ..., cn}
Test SuiteT =ht1, t2, ..., tmi
Function to return defectc score for classci,b(ci)
Function to determine classes covered by test tj,s(tj)
Secondary Objective Function g
Output: Prioritzed Test SuiteT′
1: C←SORT(C, b) 2: T′ ← ∅ 3: for all ci∈C do 4: T′′← h tj∈T|ci∈s(tj)i 5: T′← UNIQUE(T′∪ SORT(T′′ , g)) 6: end for 7: return T′
Now consider a bug report that incorrectly assignsClassC a defectc score of 0.9. Since G-clef takes all the tests for ClassC first, there are now 1000 test cases being executed before they detect a bug. To address this problem, our approach groupsclasses together based on their likelihood of containing a fault. In this instance, a group size of 2 would include ClassCand ClassAin the first group of classes, meaning the secondary objective has the combined set of tests from ClassCandClassA(i.e., 1100 tests) from which to choose.
A. Secondary Objective
G-clef utilizes a secondary objective to determine the or-dering of test cases given a set of tests that cover a target class. For this paper, we investigate the use of four secondary objectives to prioritize test cases once we have established a subset based on bug prediction: greedy (or total statement) orders test cases by the total number of statements covered,
additional greedy (or additional statement) keeps a track of
the combined set of lines covered by the prioritized suite, selecting the test that covers the most previously uncovered lines,randomreturns a purely random ordering for test cases, ensuring diversity of the prioritized test cases. Finally, similar to the work by Hao et al. [34] and Campos and Abreu [35], we apply a constraint solver, representing the lines of code as constraints that must be covered by one or more test cases and finding the minimal set of tests that satisfies all of the constraints, thereby covering all of the lines of code.
B. Grouping Classes
In addition to the secondary objective, G-clef may also need to group classes together. If a bug prediction report incorrectly assigns a high defectc score to a class with many test cases, G-clef may suffer as a result. In this paper, we investigate four different settings for grouping classes, with the default behavior of G-clef being the use of a single class. In addition, we run experiments using 5%, 10%, and 25% of the total classes that exist in each subject program. To avoid bias for or against subject programs that contain more classes than others, we use a percentage of the classes in the chosen project.
IV. EMPIRICALEVALUATION
In order to evaluate G-clef against the existing test case prioritization strategies described in Section II-A, we con-ducted experiments using real programs, tests, and faults. The experiments aim to answer the following research questions:
RQ1: Which configuration of G-clef is the most effective? With this RQ, we aim to identify the best parameters for initializing G-clef, based on the weights for Schwa, secondary objectives, and the grouping of classes.
RQ2: How does G-clef compare to previously proposed coverage-based test case prioritization strategies at pri-oritizing manually-written test cases?
With this RQ, we evaluate G-clef against existing coverage-based strategies for test case prioritization.
RQ3: How does G-clef compare to previously proposed history-based test case prioritization strategies at priori-tizing manually-written test cases?
With this RQ, we evaluate G-clef against existing history-based strategies for test case prioritization.
A. Experimental Setup
1) Subject Programs: To automatically perform our exper-imental analysis, the selection of subject programs used in our empirical evaluations adhered to the following requirements: 1) the programs used should be developed in Java (as the test prioritization tools used only support Java), 2) it must
be possible to “roll-back” changes from the repository (i.e., obtain previous versions of the source code) in order to support the collection of test history data for the history-based strategies, and 3) it must be possible to detect faulty behavior in the current version of the program using a test suite. One particular collection of subject programs that meets all of the aforementioned requirements is DEFECTS4J [10], a collection of 395 reproducible and isolated real software faults from six Java large open-source programs. All DEFECTS4J projects were collected from version control systems, meaning that it is possible to identify, check-out, and execute tests on previous versions of the software using a version control tool such as Git. Finally, DEFECTS4J provides a developer-written test suite for each program in the repository, which includes at least one test that triggers the faulty behavior of the current version of the software, which we refer to as thetrigger tests. 2) Coverage Analysis: Some of the algorithms described in Table Irely on the collection of code coverage (e.g., greedy and additional greedy [12]). Thus, for each subject program, we had to collect the code coverage of the developer written test suite. For this, we used GZoltar [36], [37]. One of the important features of GZoltar is that it executes the test cases using the same build tools that developers would be using (e.g., ANT, MAVEN, and GRADLE), meaning that the code coverage collected is as similar as is possible to a “natural” execution of test cases by a developer. Additionally, since GZoltar produces a serialized coverage file, we can use the same file across test case prioritization strategies to better ensure consistency.
3) Test History Analysis: As shown in TableI, the history-based approaches require the collection of information from previous versions of the program, including how many times each test case has been executed, how many times each test case has failed, and how recently a test case failed, amongst other information. To collect this information, we wrote a script that uses version control details to iteratively checkout previous versions of the program, compile it, execute the test cases and record their results, execution times and, if necessary, cause of failure, in a history file. In some cases, previous versions of the program may not compile due to ei-ther mistakes made in particular commits or missing libraries. In these instances, since the code does not compile, it is not possible for us to run the tests. In experiments with history-based methods, if we encounter a version of the code that does not compile, we continually retry for five preceding versions. If we cannot compile any of the preceding five versions, we terminate the history analysis for the subject at that point. Depending on the subject, we were able to collect test case execution data for up to 2522previous versions (in Math-1).
4) Schwa: The default configuration of Schwa uses these weights: 0.25 for revisions and authors, 0.5 for fixes, and
0.4 for TR. As each software project is unique in terms of, for instance, repository history and development model, these weights may vary in suitability for different projects. For example, the “authors” metric is irrelevant if only a single developer contributed to a project. For RQ1, we performed a tuning study of Schwa’s weights and the TR value. As
Schwa’s feature weights andTRvalue are in the range of0.0
and 1.0, we chose all values in this range with interval 0.1. Although there are13310 different combinations, the sum of all weights must be equal to 1, leaving726valid combinations. To assess the effectiveness of each combination at ranking a class that isbuggy, we randomly selected 5 faults of each of DEFECTS4J’s [10] projects (a total of 30 faults), and executed Schwa on the repository history of those faults. As Schwa returns a defectc value for each class of the software under
test, we ranked all classes by this value value and identified, for each combination, the ranking position of the known buggy class. The best combination of weights and TR would rank the known buggy class first, on the other hand, the worst combination of parameters would rank the buggyclass last.
5) Test Case Prioritization: For RQ2 and RQ3, we used the test case prioritization tool KANONIZO(https://github.
com/kanonizo/kanonizo). KANONIZO already has an
implementation of four coverage-based strategies: greedy, ad-ditional greedy, genetic algorithm, and random search [3]. These coverage-based strategies will be used to answer RQ2. We extended the KANONIZO tool with four history-based strategies for RQ3: ROCKET [18], MCCTCP [21], AF-SAC [23], and Elbaum et al. [17]. These strategies were se-lected to be a representative sample of previous history-based strategies, and importantly, each strategy requires information that is possible to collect using the DEFECTS4J framework.
For ROCKET, higher priority is given to newer failures over older failures. In this method’s paper, Marijan et al. adopt a variableω whereω= 0.7 if the test failed on its most recent execution, ω = 0.2 if the test failed on the execution before that, andω= 0.1for any failures on executions further back. For MCCTCP, the authors use theAPFDc metric, which is
the cost-cognizant version of the Average Percentage of Faults Detected (APFD) metric described in SectionIV-A6.APFDc
prioritizes test cases that a) discover faults that are more “severe” and b) run in the least amount of time. In their study, Huang et al. use a function criticality metric to determine how severe faults are, based on how many times buggy functions are used elsewhere in the code base. In our implementation, we assign priority to failing test cases according to the severity of the failure cause (e.g.,NullPointerExceptions are very serious). Notably, Sabor et al. showed that using stack traces to model failure severity is an effective method [38].
AFSAC uses four weights, distinct from the Schwa pa-rameters of Section II-B1, to model the likelihood that tests fail again, given the average number of times a test has consecutively failed in the past. It uses the weightαif, in the history of the test, it has always failedmoreconsecutive times than the current streak. βrepresents consecutive failures that
arehigherthan theminimumbut below theaveragenumber
of consecutive failures. γ is used when the current number of failures is above average but lower than the maximum
number of consecutive failures observed for the test, andδ is used when the current number of failures is more than has ever been observed. Since Cho et al. state thatα≥β≥γ≥δ≥0, we choose 1,0.7,0.4, and0.1, respectively.
For Elbaum et al., there are three conditions under which a test case is given a higher priority over another test. These are the “failure window”, denoted WF, which is the time since the most recent failure of the test case, and the “execution window”, denotedWE, which represents how long it has been since a test case was last run. Since, during testing with JUnit, it is common for testers to run all tests every time, we discard the WE variable. Finally, if a test case is “new”, then it is assigned a priority denoted WN. In our implementation, we assign values of5 to both the failure window,WF, and the “new test” value,WN, meaning if a test has been executed less than five times, or has failed in its most recent five executions, then it will be assigned higher priority than other test cases.
We also added G-clef, from Algorithm1, to KANONIZO. 6) Evaluation Measurements: For RQ2 and RQ3, we com-pare the effectiveness G-clef to that of the existing test priori-tization strategies. The most commonly used evaluation metric in this field is the Average Percentage of Faults Detected (APFD), an area-under-curve metric that compares the per-centage of test cases executed to the perper-centage of faults found. However, in our study we consider 395 program versions, each containing a single fault. This reduces the APFD metric to the percentage of tests that were executed before the fault was detected. DEFECTS4J provides a list of the trigger tests that detect each fault. To compare the strategies in the experimental evaluation, we calculate the percentage of each prioritized test suite that was placed higher than the trigger test for the subject program. For example, if the trigger test is the50th test case
out of 1000 test cases, the suite is scored as 5%.
7) Analysis Procedure: We analyzed all of the data re-sulting from the experiments by following well-established guidelines [39]. For instance, we use the Mann-Whitney U-test to compare two different data sets, obtaining a p-value representing the likelihood that our data was observed as a result of chance. For the Mann-Whitney U-test, we adopt a 95% confidence interval, meaning p < 0.05 indicates that our results are statistically significant. In addition, we use the Vargha-Delaney Aˆ test to compare G-clef with existing strategies. For this,Aˆvalues closer to 0 indicate that G-clef, on average, is expected to outperform the existing strategy, while a value closer to 1 indicates that the previous prioritization strategy, on average, is expected to outperform G-clef.
8) Threats to Validity: Despite the fact we used a high number of real faults from six different Java programs, this paper’s results may not generalize to other programs with either different characteristics or types of test suites or faults. Although we evaluate prioritization strategies on manually written test suites, it is conceivable that the use of different test suites could improve the results for some prioritization strategies, while degrading the results for others — in such cases, our results and conclusions would not be generally valid. Even though we do not have evidence to suggest that this would occur, future work should further study prioritization effectiveness for different types of test suites (e.g., automati-cally generated test cases from tools such as EVOSUITE [40] and Randoop [41]). While Just et al. [42] suggest that there is
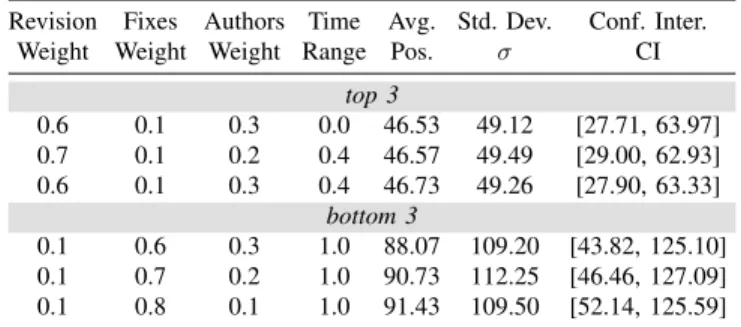
Table II: Best and worst of top and bottom three Schwa configurations. For each configuration we report the revision, fixes, and authors weights,TRvalue, average, standard deviation (σ), and confidence intervals (CI) using bootstrapping at 95% significance level of the ranking position of the known buggy class.
Revision Fixes Authors Time Avg. Std. Dev. Conf. Inter. Weight Weight Weight Range Pos. σ CI
top 3 0.6 0.1 0.3 0.0 46.53 49.12 [27.71, 63.97] 0.7 0.1 0.2 0.4 46.57 49.49 [29.00, 62.93] 0.6 0.1 0.3 0.4 46.73 49.26 [27.90, 63.33] bottom 3 0.1 0.6 0.3 1.0 88.07 109.20 [43.82, 125.10] 0.1 0.7 0.2 1.0 90.73 112.25 [46.46, 127.09] 0.1 0.8 0.1 1.0 91.43 109.50 [52.14, 125.59]
a correlation between real faults and synthetic mutants, recent work from Luo et al. [4] and Paterson et al. [3] shows that the most effective test prioritizer on mutants may not be the best on real faults, thus motivating us to focus on real faults in DEFECTS4J. Finally, even though DEFECTS4J’s programs have fast tests for which prioritization is less necessary, our experiments yield useful insights when, for instance, tests run in a continuous integration environment (e.g., [17], [43]).
Moreover, this paper does not consider the runtime of test cases when evaluating prioritizations. It is possible that with long running test cases, new orderings may actually beslower to detect faults, even if they require fewer tests. However, in our experience, approximately 98% of tests ran in under one second, making it unlikely that this would occur in practice.
G-clef prioritizes tests from an entire test suite rather than using a test case selection approach to identify relevant test cases. While this is consistent with many previous approaches (e.g., [9], [12], [17]), it is conceivable that using subsets of test cases may lead to different results. Future work should also examine the effectiveness of a hybrid approach that selects subsets of test cases in conjunction with defect prediction.
Additionally, the random sample of 30 faults used to tune Schwa’s parameters in RQ1 may not have resulted in the best overall parameters for this tool, and thus using different subjects may have resulted in different parameters. To mitigate this, we chose bugs from each of the projects in DEFECTS4J, thereby avoiding bias towards any particular project. Next, we selected the test case prioritization strategies used in the experiments as a representative sample of previous history-based approaches. Since our evaluation is not exhaustive, it is possible that using other strategies may lead to different results. We mitigated this threat by using a range of strategies from the literature that require different input and process the test execution history in different ways. One of the considerations when running Schwa is the number of commits that it analyzes when calculating prediction scores. If Schwa can analyze the entire repository history, while a history-based strategy only has a small number of commits available due to reasons discussed in Section IV-A3, then it may give G-clef an unfair advantage. Although space constraints restrict us from including the results, we also conducted experiments in which we limited the number of commits available to Schwa to be equal to the number used by the history-based strategies, observing no significant differences in the overall results.
Table III: Relative ranking position of buggy classes reported by the best Schwa configuration.We report the average number of classes (ranking size), minimum, maximum, average, and standard deviation (σ) of the relative ranking position of a buggy class, and the averagedefectcvalue of a buggy class (def).
Ranking Relative Ranking Position
Project Size min max avg σ def
Chart 1016 0.1% 56.0% 16.6% 19.9 0.39 Closure 1478 0.1% 90.4% 9.2% 15.6 0.89 Lang 344 0.3% 52.3% 12.8% 14.3 0.96 Math 1069 0.1% 94.0% 17.7% 21.3 0.91 Mockito 1018 0.1% 86.6% 10.6% 19.7 0.85 Time 585 0.1% 67.6% 12.6% 17.1 0.80 Overall 1046 0.1% 74.5% 13.0% 18.0 0.86
The bug prediction described in SectionII-Buses the com-mit history of a repository as a black box. It has been shown, for example, that modelling commit authors could improve the effectiveness of identifying which commits introduce a bug, thereby improving the effectiveness of bug-predictors [44]. With that said, this paper’s main goal is to evaluate how leveraging defect prediction in test case prioritization could lead to faster regression detection — and not what is the best bug prediction approach for this particular problem.
A final validity threat is potential defects in the tools used during experimentation (i.e., KANONIZO [3] and Schwa [32]). Used without error in prior experi-ments, both of these publicly available tools have been extensively tested. Moreover, all of this paper’s data and the scripts needed to reproduce the experiments are available at https://bitbucket.org/josecampos/ history-based-test-prioritization-data/.
B. RQ1: Which configuration of G-clef is the most effective? 1) RQ1.1: What are the best parameters for Schwa? TableIIreports the three best and the three worst of Schwa’s configurations identified during tuning. For the 30 randomly selected faults, Schwa works best, on average, with a revision weight of0.6, fixes weight of0.1, authors weight of0.3, and a
TRvalue of0.0, which lines up with Graves et al. [6] finding that recent changes have a higher impact on the likelihood of code being buggy. ATRvalue of 0.0 means thatw, as given in Equation (1), is equal to12, which is the same value sug-gested by Lewis et al. [31]. With 99% confidence, according to the Anderson-Darling statistical test [45], the ranking position of each buggy class of any Schwa configuration is not normally distributed. When ranking buggy classes, according to the Mann-Whitney U-test, no Schwa configuration X performs significantly better than any other Schwa configuration Y.
RQ1.1: For the 30 faults randomly selected from the DE -FECTS4J’s dataset, Schwa works best with the following parameters: revision weight of 0.6, fixes weight of 0.1, authors weight of 0.3, and aTR value of0.0.
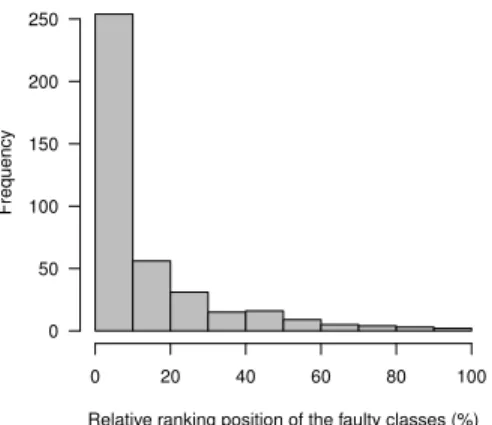
2) RQ1.2: How effective is the best Schwa configuration at ranking a buggy class? Table III and Figure 1 report the relative ranking position of buggy classes for the 395 faults in DEFECTS4J’s [10] dataset when Schwa uses the best parameters found by RQ1.1. For instance, on average, the buggy classes of the Closure project appear in the first9.2%
Relative ranking position of the faulty classes (%) Frequency 0 20 40 60 80 100 0 50 100 150 200 250
Figure 1: Relative ranking position of the buggy class. This is calculated by Schwa as the position divided by the total number classes for the subject.
positions, for a total of 1478 classes, with a defect value of
0.89. As shown by Figure1, a total of 267 bugs were correctly estimated within the top 10% of all classes in the subject programs. In fact, for 17 faults, Schwa ranks the buggy class as the most buggy one, and for 281 faults the relative ranking position of the buggy class is lower than the average value.
RQ1.2: Schwa ranks the buggy classes of all projects in the top 13.0%, with an averagedefectc value of 0.86.
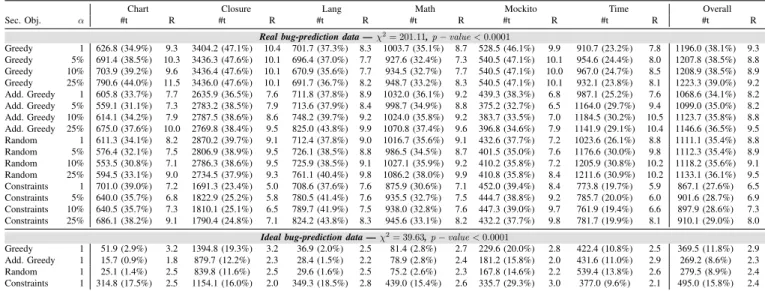
3) RQ1.3: Assuming either an ideal and non-ideal bug-prediction report, what are the best parameters for G-clef? As described in SectionIII, G-clef can be instantiated with differ-entsecondary objectivefunctions andgrouping classesvalues. To assess which combination of parameters works best (i.e., requires the execution of fewer test cases) we ran G-clef on 365 faults4 with four different secondary objective functions
(i.e., greedy, additional greedy, random, and constraints) and four grouping classes values (1, 5%, 10%, and 25%). As G-clef relies on the outcome of a bug-prediction tool, we also defined two different scenarios to assess the influence of the underlying tool: 1) anidealscenario in which a bug-prediction tool always ranks first a true buggy class and 2) a realscenario when a bug-prediction tool ranks classes as previously described.
TableIVreports the total number of test cases that must be executed in order to trigger the faulty behavior of each real fault. For each configuration/project, TableIValso reports the ranking position of each configuration at prioritizing the failure revealing test case. For instance, if a configuration A ranks the trigger test in 3rd and configuration B ranks it in 16th, configuration A is ranked first and configuration B is second. In case of a tie, all configurations are ranked in the same posi-tion. As an example, for the Closure project the configuration requiring the execution of the fewest tests is constraints as a secondary objective and a grouping classes value of 1 (which ranked 5th, on average, among all configurations). Overall, for therealbug-prediction scenario, G-clef performs best with constraints as a secondary objective (5 out of 6 projects) and grouping classes value of 1 (3 out of 6 projects). On the other hand, for theidealbug-prediction scenario, G-clef works best with additional greedy as a secondary objective for 3 out of 6 projects (Chart, Lang, and Mockito).
4Although DEFECTS4J [10] contains 395 real faults, we used 30 faults to
tune Schwa’s parameters, thus prohibiting us from using them in this study.
The reason why the constraint solver performed relatively poorly with ideal bug prediction is that it also applies a minimization to the test set. For example, if the buggy class is covered by 100 tests (including the trigger test), but the constraint solver finds a minimized set of 80 tests completely covers the class but doesnot include the trigger test, then G-clef will not prioritize the trigger test until it covers another class. Future work could enhance the constraint solver sec-ondary objective to ensure that all tests are used. Although G-clef with constraints as a secondary objective only works best for 2 out of 6 projects (Closure and Time), overall it is ranked 2.4 (nearly the same as additional greedy). The overall configuration ranking, for both therealandidealscenarios, is statistically significant according to the Friedman test.
RQ1.3: Assuming a perfect bug-prediction tool exists, G-clef works best with constraints as a secondary objective and a grouping classes value of 1; for a real bug-prediction report additional greedy is the best secondary objective for G-clef. C. RQ2: How does G-clef compare to previously proposed coverage-based test case prioritization strategies at prioritiz-ing manually-written test cases?
As stated in Section IV-A5, KANONIZO has implementa-tions for four coverage-based strategies that are commonly used in test case prioritization evaluations, as well as a completely random ordering. Thus, for this research question, we compare G-clef to these strategies. Since we use 30 subject programs for the tuning study in RQ1, we eliminate those subject programs from this RQ to avoid bias, leaving a total of 365 real faults. For each of these subjects, we run KANONIZOwith each of the coverage-based strategies and the best configuration of G-clef found in RQ1. We then evaluate the prioritized test suite by the percentage of the test suite that is executed before the fault is found. Table V reports the average number of tests that are required to be executed before a fault is found across all projects and strategies, with the percentage of the test suite required reported in brackets. As shown by Figure2, G-clef often requires the fewest overall test cases in order to detect a fault (Closure, Math, Time). For the remaining three projects, in two cases (Chart and Lang) G-clef was only beaten by a single other strategy. Furthermore, as reported by TableVI, there are a number of cases in which G-clef significantly outperformed other strategies, as reported by the Mann-Whitney U-Test. For the Closure project, G-clef significantly outperformed all other strategies except additional greedy, while for both Math and Time, G-clef significantly outperforms a further three strategies. Notably, there are only four combinations of project/strategy with anAˆscore of>0.5
(meaning on average the alternative approach is expected to outperform G-clef). Overall, of the 1,825 combinations of subject/strategy included in this study, G-clef performs best for 1,165, and significantly outperforms four of the five coverage-based strategies we compare against.
RQ2: G-clef performs better than any other coverage-based strategy, statistically better than 4 out of 5 strategies.
Table IV: Test case prioritization results of G-clef with different secondary objective functions and grouping classes values.
Theαcolumn represents thegrouping classesparameter (see SectionIII-Bfor more details), #t stands for the number of test cases that have to be executed in order to trigger the faulty behavior, and R is the ranking position of a configuration. For the overall ranking position of each configuration theχ2and p-value of the Friedman test is also reported.
Chart Closure Lang Math Mockito Time Overall
Sec. Obj. α #t R #t R #t R #t R #t R #t R #t R
Real bug-prediction data —χ2= 201.11,p−value<0.0001
Greedy 1 626.8 (34.9%) 9.3 3404.2 (47.1%) 10.4 701.7 (37.3%) 8.3 1003.7 (35.1%) 8.7 528.5 (46.1%) 9.9 910.7 (23.2%) 7.8 1196.0 (38.1%) 9.3 Greedy 5% 691.4 (38.5%) 10.3 3436.3 (47.6%) 10.1 696.4 (37.0%) 7.7 927.6 (32.4%) 7.3 540.5 (47.1%) 10.1 954.6 (24.4%) 8.0 1207.8 (38.5%) 8.8 Greedy 10% 703.9 (39.2%) 9.6 3436.4 (47.6%) 10.1 670.9 (35.6%) 7.7 934.5 (32.7%) 7.7 540.5 (47.1%) 10.0 967.0 (24.7%) 8.5 1208.9 (38.5%) 8.9 Greedy 25% 790.6 (44.0%) 11.5 3436.0 (47.6%) 10.1 691.7 (36.7%) 8.2 948.7 (33.2%) 8.3 540.5 (47.1%) 10.1 932.1 (23.8%) 8.1 1223.3 (39.0%) 9.2 Add. Greedy 1 605.8 (33.7%) 7.7 2635.9 (36.5%) 7.6 711.8 (37.8%) 8.9 1032.0 (36.1%) 9.2 439.3 (38.3%) 6.8 987.1 (25.2%) 7.6 1068.6 (34.1%) 8.2 Add. Greedy 5% 559.1 (31.1%) 7.3 2783.2 (38.5%) 7.9 713.6 (37.9%) 8.4 998.7 (34.9%) 8.8 375.2 (32.7%) 6.5 1164.0 (29.7%) 9.4 1099.0 (35.0%) 8.2 Add. Greedy 10% 614.1 (34.2%) 7.9 2787.5 (38.6%) 8.6 748.2 (39.7%) 9.2 1024.0 (35.8%) 9.2 383.7 (33.5%) 7.0 1184.5 (30.2%) 10.5 1123.7 (35.8%) 8.8 Add. Greedy 25% 675.0 (37.6%) 10.0 2769.8 (38.4%) 9.5 825.0 (43.8%) 9.9 1070.8 (37.4%) 9.6 396.8 (34.6%) 7.9 1141.9 (29.1%) 10.4 1146.6 (36.5%) 9.5 Random 1 611.3 (34.1%) 8.2 2870.2 (39.7%) 9.1 712.4 (37.8%) 9.0 1016.7 (35.6%) 9.1 432.6 (37.7%) 7.2 1023.6 (26.1%) 8.8 1111.1 (35.4%) 8.8 Random 5% 576.4 (32.1%) 7.5 2806.9 (38.9%) 9.5 726.1 (38.5%) 8.8 986.5 (34.5%) 8.7 401.5 (35.0%) 7.6 1176.6 (30.0%) 9.8 1112.3 (35.4%) 8.9 Random 10% 553.5 (30.8%) 7.1 2786.3 (38.6%) 9.5 725.9 (38.5%) 9.1 1027.1 (35.9%) 9.2 410.2 (35.8%) 7.2 1205.9 (30.8%) 10.2 1118.2 (35.6%) 9.1 Random 25% 594.5 (33.1%) 9.0 2734.5 (37.9%) 9.3 761.1 (40.4%) 9.8 1086.2 (38.0%) 9.9 410.8 (35.8%) 8.4 1211.6 (30.9%) 10.2 1133.1 (36.1%) 9.5 Constraints 1 701.0 (39.0%) 7.2 1691.3 (23.4%) 5.0 708.6 (37.6%) 7.6 875.9 (30.6%) 7.1 452.0 (39.4%) 8.4 773.8 (19.7%) 5.9 867.1 (27.6%) 6.5 Constraints 5% 640.0 (35.7%) 6.8 1822.9 (25.2%) 5.8 780.5 (41.4%) 7.6 935.5 (32.7%) 7.5 444.7 (38.8%) 9.2 785.7 (20.0%) 6.0 901.6 (28.7%) 6.9 Constraints 10% 640.5 (35.7%) 7.3 1810.1 (25.1%) 6.5 789.7 (41.9%) 7.5 938.0 (32.8%) 7.6 447.3 (39.0%) 9.7 761.9 (19.4%) 6.6 897.9 (28.6%) 7.3 Constraints 25% 686.1 (38.2%) 9.1 1790.4 (24.8%) 7.1 824.2 (43.8%) 8.3 945.6 (33.1%) 8.2 432.2 (37.7%) 9.8 781.7 (19.9%) 8.1 910.1 (29.0%) 8.0
Ideal bug-prediction data —χ2
= 39.63,p−value<0.0001
Greedy 1 51.9 (2.9%) 3.2 1394.8 (19.3%) 3.2 36.9 (2.0%) 2.5 81.4 (2.8%) 2.7 229.6 (20.0%) 2.8 422.4 (10.8%) 2.5 369.5 (11.8%) 2.9 Add. Greedy 1 15.7 (0.9%) 1.8 879.7 (12.2%) 2.3 28.4 (1.5%) 2.2 78.9 (2.8%) 2.4 181.2 (15.8%) 2.0 431.6 (11.0%) 2.9 269.2 (8.6%) 2.3 Random 1 25.1 (1.4%) 2.5 839.8 (11.6%) 2.5 29.6 (1.6%) 2.5 75.2 (2.6%) 2.3 167.8 (14.6%) 2.2 539.4 (13.8%) 2.6 279.5 (8.9%) 2.4 Constraints 1 314.8 (17.5%) 2.5 1154.1 (16.0%) 2.0 349.3 (18.5%) 2.8 439.0 (15.4%) 2.6 335.7 (29.3%) 3.0 377.0 (9.6%) 2.1 495.0 (15.8%) 2.4
Table V: Test case prioritization results of G-clef and coverage-based strategies.For each prioritization strategy we report the total number of test cases (#t) that have to be executed to trigger the faulty behavior, and its ranking position when compared to the other strategies.
Chart Closure Lang Math Mockito Time Overall
Strategy #t R #t R #t R #t R #t R #t R #t R χ2= 110.70,p−value <0.0001 Greedy 859.1 (47.9%) 3.7 3439.4 (47.6%) 4.2 623.4 (33.1%) 2.6 909.5 (31.8%) 2.9 540.1 (47.1%) 4.1 970.0 (24.7%) 3.1 1223.6 (39.0%) 3.5 Add. Greedy 740.4 (41.2%) 3.6 1955.3 (27.1%) 2.6 939.8 (49.9%) 3.9 1046.2 (36.6%) 3.1 408.2 (35.6%) 3.1 953.1 (24.3%) 3.0 1007.2 (32.1%) 3.1 GA 719.4 (40.1%) 3.7 2817.6 (39.0%) 3.9 840.4 (44.6%) 3.9 1287.9 (45.0%) 4.1 423.9 (37.0%) 3.3 1385.3 (35.3%) 4.1 1245.8 (39.7%) 3.9 Random 674.6 (37.6%) 3.5 2811.0 (38.9%) 3.9 826.1 (43.8%) 3.6 1271.9 (44.5%) 4.1 425.5 (37.1%) 3.6 1410.2 (36.0%) 4.4 1236.6 (39.4%) 3.9 Rand. Search 717.7 (40.0%) 3.7 2828.7 (39.2%) 3.9 829.4 (44.0%) 3.6 1267.3 (44.3%) 4.0 422.1 (36.8%) 3.4 1400.6 (35.7%) 4.3 1244.3 (39.7%) 3.9 G-clef 701.0 (39.0%) 2.8 1691.3 (23.4%) 2.5 708.6 (37.6%) 3.3 875.9 (30.6%) 2.8 452.0 (39.4%) 3.5 773.8 (19.7%) 2.1 867.1 (27.6%) 2.8
Table VI: G-clef vs coverage-based strategies.The # column reports the number of bugs for which G-clef performed better thanXand the total number of bugs per project,Aˆcolumn reports the effect size ofXvs. G-clef (a value lower than 0.5 meansXperformed worse than G-clef, and a value greater than 0.5 means G-clef performed worse thanX), andpcolumn reports the p-value of the Mann-Whitney U-test. Statistically significantly results at 95% significance level are given in bold-face.
Chart Closure Lang Math Mockito Time Overall
Strategy # Aˆ p # Aˆ p # Aˆ p # Aˆ p # Aˆ p # Aˆ p # Aˆ p Greedy 14 / 21 0.41 0.30 97 / 128 0.29 0.00 25 / 60 0.55 0.34 49 / 101 0.50 0.97 21 / 33 0.43 0.33 14 / 22 0.44 0.52 220 / 365 0.42 0.00 Add. Greedy 12 / 21 0.47 0.72 63 / 128 0.50 0.97 38 / 60 0.41 0.09 54 / 101 0.47 0.41 14 / 33 0.53 0.66 16 / 22 0.44 0.50 197 / 365 0.48 0.35 GA 14 / 21 0.44 0.48 96 / 128 0.25 0.00 33 / 60 0.41 0.10 73 / 101 0.28 0.00 13 / 33 0.48 0.79 18 / 22 0.23 0.00 247 / 365 0.31 0.00 Random 14 / 21 0.44 0.53 93 / 128 0.26 0.00 35 / 60 0.42 0.14 72 / 101 0.29 0.00 16 / 33 0.48 0.81 19 / 22 0.22 0.00 249 / 365 0.31 0.00 Rand. Search 14 / 21 0.44 0.48 98 / 128 0.26 0.00 32 / 60 0.42 0.14 73 / 101 0.28 0.00 17 / 33 0.48 0.80 18 / 22 0.24 0.00 252 / 365 0.31 0.00 ● ● ● ● ● ● ● ● ● ● ● ● ● ● ● ● ● ● ● ● ● ● ● ● ● ● ● ● ● ● ● ● ● ● ●
Math Mockito Time
Chart Closure Lang
Random Greedy Add. Greedy GA Rand. Search G−clef Random Greedy Add. Greedy GA Rand. Search G−clef Random Greedy Add. Greedy GA Rand. Search G−clef 0.00 0.25 0.50 0.75 1.00 0.00 0.25 0.50 0.75 1.00 Strategy
% of test cases that ha
ve to be e xecuted to tr igger the f aulty beha viour
∗represents the average % of test cases that have to be executed to trigger the faulty behavior.
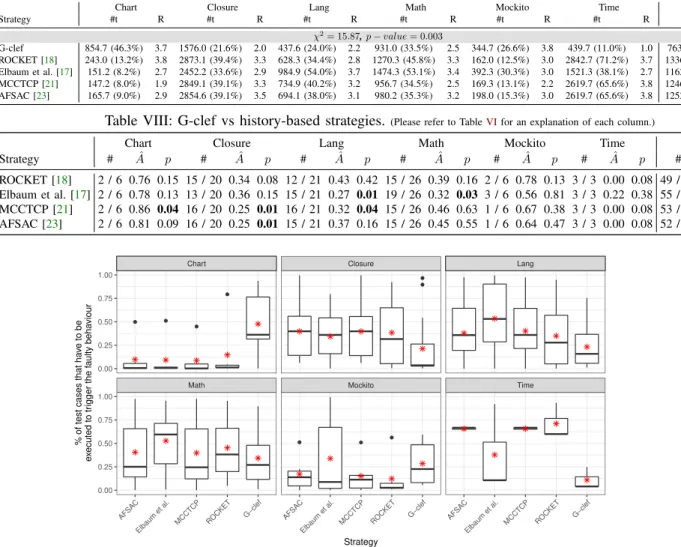
Table VII: Test case prioritization results of G-clef and history-based strategies.(Please refer to TableVfor an explanation of each column.)
Chart Closure Lang Math Mockito Time Overall
Strategy #t R #t R #t R #t R #t R #t R #t R χ2= 15.87,p−value= 0.003 G-clef 854.7 (46.3%) 3.7 1576.0 (21.6%) 2.0 437.6 (24.0%) 2.2 931.0 (33.5%) 2.5 344.7 (26.6%) 3.8 439.7 (11.0%) 1.0 763.9 (24.1%) 2.5 ROCKET [18] 243.0 (13.2%) 3.8 2873.1 (39.4%) 3.3 628.3 (34.4%) 2.8 1270.3 (45.8%) 3.3 162.0 (12.5%) 3.0 2842.7 (71.2%) 3.7 1336.6 (42.1%) 3.2 Elbaum et al. [17] 151.2 (8.2%) 2.7 2452.2 (33.6%) 2.9 984.9 (54.0%) 3.7 1474.3 (53.1%) 3.4 392.3 (30.3%) 3.0 1521.3 (38.1%) 2.7 1162.7 (36.7%) 3.2 MCCTCP [21] 147.2 (8.0%) 1.9 2849.1 (39.1%) 3.3 734.9 (40.2%) 3.2 956.7 (34.5%) 2.5 169.3 (13.1%) 2.2 2619.7 (65.6%) 3.8 1246.1 (39.3%) 2.9 AFSAC [23] 165.7 (9.0%) 2.9 2854.6 (39.1%) 3.5 694.1 (38.0%) 3.1 980.2 (35.3%) 3.2 198.0 (15.3%) 3.0 2619.7 (65.6%) 3.8 1252.0 (39.5%) 3.2
Table VIII: G-clef vs history-based strategies.(Please refer to TableVIfor an explanation of each column.)
Chart Closure Lang Math Mockito Time Overall
Strategy # Aˆ p # Aˆ p # Aˆ p # Aˆ p # Aˆ p # Aˆ p # Aˆ p ROCKET [18] 2 / 6 0.76 0.15 15 / 20 0.34 0.08 12 / 21 0.43 0.42 15 / 26 0.39 0.16 2 / 6 0.78 0.13 3 / 3 0.00 0.08 49 / 82 0.42 0.09 Elbaum et al. [17] 2 / 6 0.78 0.13 13 / 20 0.36 0.15 15 / 21 0.27 0.01 19 / 26 0.32 0.03 3 / 6 0.56 0.81 3 / 3 0.22 0.38 55 / 82 0.38 0.01 MCCTCP [21] 2 / 6 0.86 0.04 16 / 20 0.25 0.01 16 / 21 0.32 0.04 15 / 26 0.46 0.63 1 / 6 0.67 0.38 3 / 3 0.00 0.08 53 / 82 0.39 0.02 AFSAC [23] 2 / 6 0.81 0.09 16 / 20 0.25 0.01 15 / 21 0.37 0.16 15 / 26 0.45 0.55 1 / 6 0.64 0.47 3 / 3 0.00 0.08 52 / 82 0.40 0.02 ● ● ● ● ● ● ● ● ●
Math Mockito Time
Chart Closure Lang
AFSA C
Elbaum et al.
MCCTCP ROCKET G−clef AFSA C
Elbaum et al.
MCCTCP ROCKET G−clef AFSA C Elbaum et al. MCCTCP ROCKET G−clef 0.00 0.25 0.50 0.75 1.00 0.00 0.25 0.50 0.75 1.00 Strategy
% of test cases that ha
ve to be e xecuted to tr igger the f aulty beha viour
∗represents the average % of test cases that have to be executed to trigger the faulty behavior.
Figure 3: Test case prioritization results of G-clef and the history-based strategies. D. RQ3: How does G-clef compare to previously proposed
history-based test case prioritization strategies at prioritizing manually-written test cases?
As with RQ2, RQ3 involves the execution of G-clef com-pared against four history-based approaches described in Sec-tion IV-A5. In the DEFECTS4J dataset, there are a substantial number of subject programs for which the test case that detects a fault has no execution history. This may cause an unnecessary bias either in favor of or against certain history-based strategies, since some strategies rely on the number of prior executions and/or failures. In order to give a fair opportunity to all strategies, we only include bugs where the trigger test has at least one prior execution before the current version of the subject program. This means that, for this RQ, we use 82 bugs for the evaluation. Table VIIreports the average number of tests that have to be executed before a fault is found across all projects and strategies. For four of the six projects (Closure, Lang, Math, Time), G-clef had the lowest number of test cases required of any strategy. Additionally, as shown by TableVIII, G-clef was significantly better for five project/strategy combinations, and was only
significantly outperformed once (Chart/MCCTCP [21]). For the Time project, while the Vargha-DelaneyAˆeffect size was
0.00for three of the four competing approaches, due to only having three bugs for this project, we were unable to achieve a significant result for this project. Yet, G-clef overall achieved significantly better results than three of the four history-based strategies evaluated in this paper, and outperformed ROCKET for 49 out of the 82 bugs used in this evaluation.
Figure 3 contains a boxplot showing the percentage of test cases executed before the trigger test. One of the most noticeable results in Figure 3 is how effective history-based strategies were on the Chart project. On average, only 10.5%
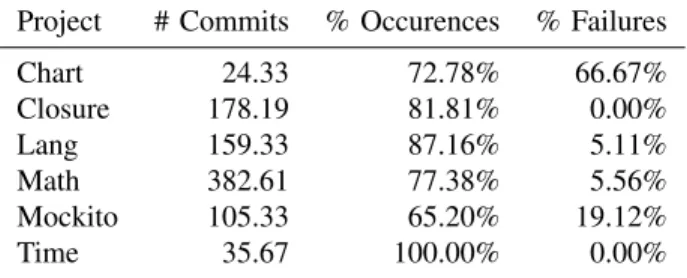
of the total test cases were required to find a fault, and for four of the six Chart subjects used, at least one of the history-based strategies was able to detect the fault in fewer than 10 test cases. Table IX shows, for each project, the average number of commits analyzed, percentage of commits in which the trigger test was present, and for the times when the trigger test was present, the percentage of occasions on which the test
case failed. In the Chart project, a relatively low number of
Table IX: Test execution statistics.For each project, this reports the average number of commits analyzed, the percentage of commits in which the trigger test was present, and the percentage of occasions on which the trigger test failed when present.
Project # Commits % Occurences % Failures
Chart 24.33 72.78% 66.67% Closure 178.19 81.81% 0.00% Lang 159.33 87.16% 5.11% Math 382.61 77.38% 5.56% Mockito 105.33 65.20% 19.12% Time 35.67 100.00% 0.00%
the trigger test was very often present in the commits (72.78% of commits contained the trigger test), and more importantly, the trigger test failed on average two-thirds of the time it was included in a commit. Likewise, for the Mockito project, on which history-based strategies outperformed G-clef, the percentage of occasions on which the trigger test failed is higher than on the other projects. Conversely, two of the projects for which history-based strategies did not perform as well, Closure and Time, featured zero previous failures of the trigger test, meaning history-based strategies are unlikely to effectively prioritize test suites for these projects.
RQ3: G-clef performs better than any other history-based strategy, statistically better than 3 out of 4 strategies.
V. RELATEDWORK
Many previous papers proposed and/or evaluated test case prioritization. Rothermel et al. [12] and Elbaum et al. [9] con-sidered a number of coverage-based and mutation-based ap-proaches to greedily prioritizing test cases, while Li et al. [14] and Conrad et al. [46] studied search-based methods. Finally, Walcott et al. [47] and Alspaugh et al. [48] developed test prioritization methods that take into account the time budget allocated for testing. Yet, unlike this paper, neither these studies, nor those omitted due to space constraints, used defect prediction to support the process of test prioritization.
There also has been prior work that uses historical test case information in order to predict the future results of test cases. For instance, Huang et al. [21] proposed an approach for test case prioritization based on historical test failures and their associated severities, while Elbaum et al. [17] presented a method that considered how recently a test had either been run or failed. Marijan et al. [18] suggested an approach based on test failures (with higher weighting for recent failures) and Cho et al. [23] used test history statistics to predict future failures. Importantly, all of these approaches look at the history of test case behavior, while in contrast this paper’s approach focuses on historical changes to the project’s source code.
Finally, there have been prior studies that used variations of fault proneness or defect prediction for test case prior-itization. For instance, Li et al. [49] adopted 32 software metrics to identify sub-systems that were most likely to fail. Srikanth et al. [50] considered requirements that have been reported by users as most likely to contain failures. Wang et al. [51] proposed a test prioritization technique based
on software quality, incorporating an unsupervised machine learning model based on software quality metrics. Moreover, Mirarab et al. [52] used software quality metrics in a Bayesian model that supported test prioritization. Notably, all of these studies used software quality metrics as a surrogate for fault proneness, while G-clef uses the history of the software from version control as an indicator for future defect locations.
VI. CONCLUSIONS ANDFUTUREWORK
This paper presents a new strategy, called G-clef, that uses defect prediction for test case prioritization. After explaining how G-clef works, we present an empirical study comparing it to four coverage-based strategies on 365 real faults, and to four history-based strategies on 82 real faults from the DEFECTS4J dataset. When compared against four coverage-based strategies, G-clef resulted in the lowest number of test cases required to find a fault for 1,165 out of 1,825 combi-nations of project/strategy, statistically outperforming three of the four strategies. Notably, while there are some strategies that work better on some subject programs, G-clef is never statistically outperformed by any other strategy, suggesting that G-clef is at least as good for all projects as existing strategies. Moreover, when compared against the four history-based strategies, such as ROCKET, the experiments show that G-clef results in the lowest number of tests required to find a fault in 199 out of 312 combinations of project/strategy, statistically outperforming three of the four strategies.
Given the importance of test prioritization for decreasing the cost of regression testing and the demonstrated promise of G-clef, we intend to improve the presented approach and conduct additional experiments with new subjects. In this paper, we present a test prioritization strategy based on defect prediction values. In future work, we will investigate how defect prediction is able to capture characteristics of test suites in comparison with other strategies described in this paper. Additionally, since Schwa uses features of the version control repository’s history to calculate its prediction values, we will investigate whether defect prediction techniques based on software features (e.g., Chidamber-Kemerer [53]) are able to achieve similar or better results. Since, in our experiments, even an ideal bug prediction report admits opportunities to decrease the number of required test cases, we will also develop and study new secondary objectives. As improvements are made to bug prediction methods, we will update G-clef and evaluate the effectiveness of new test prioritizers. Finally, since current defect prediction tools rely on constructs such as classes and methods, we will investigate how the choice of a programming language influences the effectiveness of G-clef.
ACKNOWLEDGMENTS
This work was partially funded by the ERDF through COMPETE 2020 Program and by National Funds through the Portuguese funding agency (FCT) with reference UID/CEC/50021/2019, and by the FaultLocker project (PTDC/CCI-COM/29300/2017).
REFERENCES
[1] G. M. Kapfhammer, “Software testing,” in The Computer Science Handbook, 2004.
[2] S. Yoo and M. Harman, “Regression testing minimization, selection and prioritization: A survey,”Software Testing, Verification and Reliability, vol. 22, no. 2, 2012.
[3] D. Paterson, G. M. Kapfhammer, G. Fraser, and P. McMinn, “Using controlled numbers of real faults and mutants to empirically evaluate coverage-based test case prioritization,” inInternational Workshop on the Automation of Software Test, 2018.
[4] Q. Luo, K. Moran, D. Poshyvanyk, and M. D. Penta, “Assessing test case prioritization on real faults and mutants,” inProceedings of the International Conference on Software Maintenance and Evolution, 2018. [5] T. Zimmermann, R. Premraj, and A. Zeller, “Predicting defects for Eclipse,” inProceedings of the 3rd International Workshop on Predictor Models in Software Engineering, 2007.
[6] T. L. Graves, A. F. Karr, J. S. Marron, and H. Siy, “Predicting fault incidence using software change history,” Transactions on Software Engineering, vol. 26, no. 7, 2000.
[7] T. J. Ostrand, E. J. Weyuker, and R. M. Bell, “Predicting the location and number of faults in large software systems,”Transactions on Software Engineering, vol. 31, no. 4, 2005.
[8] T. Menzies, J. Greenwald, and A. Frank, “Data mining static code attributes to learn defect predictors,” Transactions on Software Engi-neering, vol. 33, no. 1, 2007.
[9] S. Elbaum, A. G. Malishevsky, and G. Rothermel, “Test case pri-oritization: A family of empirical studies,” Transactions on Software Engineering, vol. 28, no. 2, 2002.
[10] R. Just, D. Jalali, and M. D. Ernst, “Defects4J: A database of existing faults to enable controlled testing studies for Java programs,” in Pro-ceedings of the 2014 International Symposium on Software Testing and Analysis.
[11] G. M. Kapfhammer, “Regression testing,” in The Encyclopedia of Software Engineering, 2010.
[12] G. Rothermel, R. H. Untch, C. Chu, and M. J. Harrold, “Test case prioritization: An empirical study,” inProceedings of the International Conference on Software Maintenance, 1999.
[13] B. Jiang, Z. Zhang, W. K. Chan, and T. H. Tse, “Adaptive random test case prioritization,” inProceedings of the International Conference on Automated Software Engineering, 2009.
[14] Z. Li, M. Harman, and R. M. Hierons, “Search algorithms for regression test case prioritization,”Transactions on Software Engineering, vol. 33, no. 4, 2007.
[15] A. Gonzalez-Sanchez, R. Abreu, H.-G. Gross, and A. J. van Gemund, “Prioritizing tests for fault localization through ambiguity group reduc-tion,” inProceedings of the 26th International Conference on Automated Software Engineering, 2011.
[16] M. Sherriff, M. Lake, and L. Williams, “Prioritization of regression tests using singular value decomposition with empirical change records,” in
Proceedings of the 18th International Symposium on Software Reliabil-ity, 2007.
[17] S. Elbaum, G. Rothermel, and J. Penix, “Techniques for improving regression testing in continuous integration development environments,” inProceedings of the 22nd International Symposium on Foundations of Software Engineering, 2014.
[18] D. Marijan, A. Gotlieb, and S. Sen, “Test case prioritization for continuous regression testing: An industrial case study,” inProceedings of the International Conference on Software Maintenance, 2013. [19] T. Rolfsnes, “Mining change history for test-plan generation,” in
Pro-ceedings of the International Symposium on Software Testing and Analysis, 2015.
[20] T. Rolfsnes, R. Behjati, and L. Moonen, “Generating test-plans by mining version histories,” Simula Research Laboratory, Tech. Rep. 2015-1, 2015.
[21] Y.-C. Huang, K.-L. Peng, and C.-Y. Huang, “A history-based cost-cognizant test case prioritization technique in regression testing,”Journal of Systems and Software, vol. 85, no. 3, 2012.
[22] S. Elbaum, A. Malishevsky, and G. Rothermel, “Incorporating varying test costs and fault severities into test case prioritization,” inProceedings of the 23rd International Conference on Software Engineering, 2001. [23] Y. Cho, J. Kim, and E. Lee, “History-based test case prioritization for
failure information,” inProceedings of the 23rd Asia-Pacific Software Engineering Conference, 2016.
[24] H. Hemmati, S. Nadi, O. Baysal, O. Kononenko, W. Wang, R. Holmes, and M. W. Godfrey, “The MSR cookbook: Mining a decade of research,” in Proceedings of the 10th Working Conference on Mining Software Repositories, 2013.
[25] C. Catal and B. Diri, “A systematic review of software fault prediction studies,”Expert Systems with Applications, vol. 36, no. 4, 2009. [26] S. Kim, T. Zimmermann, E. J. Whitehead Jr., and A. Zeller, “Predicting
faults from cached history,” in Proceedings of the 29th International Conference on Software Engineering, 2007.
[27] R. Moser, W. Pedrycz, and G. Succi, “A comparative analysis of the efficiency of change metrics and static code attributes for defect prediction,” in Proceedings of the 30th International Conference on Software Engineering, 2008.
[28] S. Kim, E. J. Whitehead, Jr., and Y. Zhang, “Classifying software changes: Clean or buggy?” Transactions on Software Engineering, vol. 34, no. 2, 2008.
[29] A. E. Hassan, “Predicting faults using the complexity of code changes,” inProceedings of the 31st International Conference on Software Engi-neering, 2009.
[30] F. Rahman, D. Posnett, A. Hindle, E. Barr, and P. Devanbu, “BugCache for inspections: Hit or miss?” inProceedings of the 19th Symposium and the 13th European Conference on Foundations of Software Engineering, 2011.
[31] C. Lewis, Z. Lin, C. Sadowski, X. Zhu, R. Ou, and E. J. Whitehead Jr., “Does bug prediction support human developers? Findings from a Google case study,” inProceedings of the 25th International Conference on Software Engineering, 2013.
[32] A. Freitas, “Software repository mining analytics to estimate software component reliability,” Master’s thesis, Faculdade de Engenharia da Universidade do Porto, 2015.
[33] M. D’Ambros, M. Lanza, and R. Robbes, “Evaluating defect prediction approaches: A benchmark and an extensive comparison,” Empirical Software Engineering, vol. 17, no. 4-5, 2012.
[34] D. Hao, L. Zhang, L. Zang, Y. Wang, X. Wu, and T. Xie, “To be optimal or not in test-case prioritization,”Transactions on Software Engineering, vol. 42, no. 5, 2016.
[35] J. Campos and R. Abreu, “Encoding Test Requirements as Constraints for Test Suite Minimization,” inProceedings of the 10th International Conference on Information Technology: New Generations, 2013. [36] J. Campos, A. Riboira, A. Perez, and R. Abreu, “GZoltar: An Eclipse
plug-in for testing and debugging,” inProceedings of the 27th Interna-tional Conference on Automated Software Engineering, 2012. [37] GZoltar, “GZoltar,” 2012 (accessed January 31, 2019). [Online].
Available:http://www.gzoltar.com
[38] K. K. Sabor, M. Hamdaqa, and A. Hamou-Lhadj, “Automatic prediction of the severity of bugs using stack traces,” inProceedings of the 26th Annual International Conference on Computer Science and Software Engineering, 2016.
[39] A. Arcuri and L. Briand, “A hitchhiker’s guide to statistical tests for assessing randomized algorithms in software engineering,” Software Testing, Verification & Reliability, vol. 24, no. 3, 2014.
[40] G. Fraser and A. Arcuri, “EvoSuite: Automatic test suite generation for object-oriented software,” inProceedings of the 19th Symposium and the 13th European Conference on Foundations of Software Engineering, 2011.
[41] C. Pacheco and M. D. Ernst, “Randoop: Feedback-directed random testing for Java,” inCompanion to the 22nd International Conference on Object-oriented Programming Systems and Applications Companion, 2007.
[42] R. Just, D. Jalali, L. Inozemtseva, M. D. Ernst, R. Holmes, and G. Fraser, “Are mutants a valid substitute for real faults in software testing?” in
Proceedings of the 22nd International Symposium on Foundations of Software Engineering, 2014.
[43] D. Saff and M. D. Ernst, “An experimental evaluation of continuous testing during development,” inProceedings of the International Sym-posium on Software Testing and Analysis, 2004.
[44] J. Eyolfson, L. Tan, and P. Lam, “Do time of day and developer experience affect commit bugginess?” inProceedings of the 8th Working Conference on Mining Software Repositories, 2011.
[45] T. W. Anderson and D. A. Darling, “Asymptotic theory of certain ”goodness of fit” criteria based on stochastic processes,” The Annals of Mathematical Statistics, vol. 23, no. 2, 1952.
[46] A. P. Conrad, R. S. Roos, and G. M. Kapfhammer, “Empirically studying the role of selection operators during search-based test suite prioritization,” inProceedings of the 12th International Conference on Genetic and Evolutionary Computation, 2010.
[47] K. R. Walcott, M. L. Soffa, G. M. Kapfhammer, and R. S. Roos, “Time-aware test suite prioritization,” inProceedings of the International Symposium on Software Testing and Analysis, 2006.
[48] S. Alspaugh, K. R. Walcott, M. Belanich, G. M. Kapfhammer, and M. L. Soffa, “Efficient time-aware prioritization with knapsack solvers,” in
Proceedings of the International Workshop on Empirical Assessment of Software Engineering Languages and Technologies, 2007.
[49] P. L. Li, J. Herbsleb, M. Shaw, and B. Robinson, “Experiences and re-sults from initiating field defect prediction and product test prioritization efforts at abb inc.” inProceedings of the 28th International Conference
on Software Engineering, 2006.
[50] H. Srikanth, L. Williams, and J. Osborne, “System test case prioritization of new and regression test cases,” inProceedings of the International Symposium on Empirical Software Engineering, 2005.
[51] S. Wang, J. Nam, and L. Tan, “QTEP: Quality-aware test case prioriti-zation,” in Proceedings of the 11th Joint Meeting European Software Engineering Conference and the Symposium on the Foundations of Software Engineering, 2017.
[52] S. Mirarab and L. Tahvildari, “A prioritization approach for software test cases based on Bayesian networks,” inProceedings of the 10th Interna-tional Conference on Fundamental Approaches to Software Engineering, 2007.
[53] S. R. Chidamber and C. F. Kemerer, “A metrics suite for object oriented design,”Transactions on Software Engineering, vol. 20, no. 6, 1994.