Thank you for downloading this document from the RMIT
Research Repository.
The RMIT Research Repository is an open access database showcasing
the research outputs of RMIT University researchers.
RMIT Research Repository:
http://researchbank.rmit.edu.au/
PLEASE DO NOT REMOVE THIS PAGE
Citation:
See this record in the RMIT Research Repository at:
Version:
Copyright Statement:
©
Link to Published Version:
https://researchbank.rmit.edu.au/view/rmit:53143
Published Version
2018 The Author(s). Published by Elsevier Ltd. Open Access; CC BY-NC-ND 4.0
https://dx.doi.org/10.1016/j.procS.2018.08.057
Tariq, M, Trivailo, P and Simic, M 2018, 'Motor imagery based EEG features visualization for BCI applications', Procedia Computer Science, vol. 126, pp. 1936-1944.
ScienceDirect
Available online at www.sciencedirect.com
Procedia Computer Science 126 (2018) 1936–1944
1877-0509 © 2018 The Authors. Published by Elsevier Ltd.
This is an open access article under the CC BY-NC-ND license (https://creativecommons.org/licenses/by-nc-nd/4.0/) Selection and peer-review under responsibility of KES International.
10.1016/j.procs.2018.08.057
10.1016/j.procs.2018.08.057
© 2018 The Authors. Published by Elsevier Ltd.
This is an open access article under the CC BY-NC-ND license (https://creativecommons.org/licenses/by-nc-nd/4.0/) Selection and peer-review under responsibility of KES International.
1877-0509 Available online at www.sciencedirect.com
ScienceDirect
Procedia Computer Science 00 (2018) 000–000
www.elsevier.com/locate/procedia
1877-0509 © 2018 The Authors. Published by Elsevier Ltd.
This is an open access article under the CC BY-NC-ND license (https://creativecommons.org/licenses/by-nc-nd/4.0/) Selection and peer-review under responsibility of KES International.
22nd International Conference on Knowledge-Based and Intelligent Information &
Engineering Systems
Motor imagery based EEG features visualization for BCI
applications
Madiha Tariq*, Pavel M. Trivailo, Milan Simic
School of Engineering, RMIT university Bundoora Plenty Road, 3083 Victoria Australia
Abstract
Over recent years, electroencephalography’s (EEG) use in the state-of-the-art brain-computer interface (BCI) technology has broadened to augment the quality of life, both with medical and non-medical applications. For medical applications, the availability of real-time data for processing, which could be used as command signals to control robotic devices, is limited to specific platforms. This paper focuses on the possibility to analyse and visualize EEG signal features using OpenViBE acquisition platform in offline mode apart from its default real-time processing capability, and the options available for processing of data in offline mode. We employed OpenViBE platform to acquire EEG signals, pre-process it and extract features for a BCI system. For testing purposes, we analysed and tried to visualize EEG data offline, by developing scenarios, using method for quantification of event-related (de)synchronization ERD/ERS patterns, as well as, built in signal processing algorithms available in OpenViBE-designer toolbox. Acquired data was based on deployment of standard Graz BCI experimental protocol, used for foot kinaesthetic motor imagery (KMI). Results clearly reflect that the platform OpenViBE is a streaming tool that encourages processing and analysis of EEG data online, contrary to analysis, or visualization of data in offline, or global mode. For offline analysis and visualization of data, other relevant platforms are discussed. In online execution of BCI, OpenViBE is a potential tool for the control of wearable lower-limb devices, robotic vehicles and rehabilitation equipment. Other applications include remote control of mechatronic devices, or driving of passenger cars by human thoughts.
© 2018 The Authors. Published by Elsevier Ltd.
This is an open access article under the CC BY-NC-ND license (https://creativecommons.org/licenses/by-nc-nd/4.0/) Selection and peer-review under responsibility of KES International.
Keywords: EEG; BCI; OpenViBE; kinaesthetic motor imagery (KMI)
* Corresponding author. Tel.: +61 421 136 356; fax: +0-000-000-0000 . E-mail address: [email protected]
Available online at www.sciencedirect.com
ScienceDirect
Procedia Computer Science 00 (2018) 000–000
www.elsevier.com/locate/procedia
1877-0509 © 2018 The Authors. Published by Elsevier Ltd.
This is an open access article under the CC BY-NC-ND license (https://creativecommons.org/licenses/by-nc-nd/4.0/) Selection and peer-review under responsibility of KES International.
22nd International Conference on Knowledge-Based and Intelligent Information &
Engineering Systems
Motor imagery based EEG features visualization for BCI
applications
Madiha Tariq*, Pavel M. Trivailo, Milan Simic
School of Engineering, RMIT university Bundoora Plenty Road, 3083 Victoria Australia
Abstract
Over recent years, electroencephalography’s (EEG) use in the state-of-the-art brain-computer interface (BCI) technology has broadened to augment the quality of life, both with medical and non-medical applications. For medical applications, the availability of real-time data for processing, which could be used as command signals to control robotic devices, is limited to specific platforms. This paper focuses on the possibility to analyse and visualize EEG signal features using OpenViBE acquisition platform in offline mode apart from its default real-time processing capability, and the options available for processing of data in offline mode. We employed OpenViBE platform to acquire EEG signals, pre-process it and extract features for a BCI system. For testing purposes, we analysed and tried to visualize EEG data offline, by developing scenarios, using method for quantification of event-related (de)synchronization ERD/ERS patterns, as well as, built in signal processing algorithms available in OpenViBE-designer toolbox. Acquired data was based on deployment of standard Graz BCI experimental protocol, used for foot kinaesthetic motor imagery (KMI). Results clearly reflect that the platform OpenViBE is a streaming tool that encourages processing and analysis of EEG data online, contrary to analysis, or visualization of data in offline, or global mode. For offline analysis and visualization of data, other relevant platforms are discussed. In online execution of BCI, OpenViBE is a potential tool for the control of wearable lower-limb devices, robotic vehicles and rehabilitation equipment. Other applications include remote control of mechatronic devices, or driving of passenger cars by human thoughts.
© 2018 The Authors. Published by Elsevier Ltd.
This is an open access article under the CC BY-NC-ND license (https://creativecommons.org/licenses/by-nc-nd/4.0/) Selection and peer-review under responsibility of KES International.
Keywords: EEG; BCI; OpenViBE; kinaesthetic motor imagery (KMI)
* Corresponding author. Tel.: +61 421 136 356; fax: +0-000-000-0000 . E-mail address: [email protected]
Tariq et al./ Procedia Computer Science 00 (2018) 000–000
1.Introduction
In recent years, new attributes to human computer interaction have revolutionized various fields of application, e.g. medicine, entertainment, etc. Predominantly, these technologies are of the key interest to researchers in the areas of health and rehabilitation, e.g. upper or lower-limb wearable robot control such as prosthetic, exoskeleton, or orthosis devices [1]. The state of the art brain-computer interface (BCI) has enabled real-time monitoring of the brain activities, and allows the brain signals to control external devices, like neuroprosthesis, without the involvement of any muscular activity [2-5]. It also functions as a bridge to bring sensory input into the brain, bypassing damages sight, listening or sensing abilities. A BCI system commonly deploys input signals that are elicited upon execution of motor imagery tasks, i.e. kinaesthetic imagination of a limb movement; these could be hand, foot or tongue movements.
The application areas of BCI range from wheelchair control to security system [6]. BCI has been used to control vehicles in 3D environment recently, as already presented in [7-15]. Various types of BCI system applications are shown in Fig. 1. In the near future, we hope to see a new revolutionary application of the BCI control of human limbs, in the cases when patients have spinal cord injuries. Driving a virtual car in a simulated and in realistic city using EEG is already presented [12]. System is based on P300 wave signal acquisition, which is analysed, recognised and converted into control commands. Virtual car is controlled in 3D environment. The P300 is an event related potential associated to brain activities in decision making. Vehicle control, in a car racing game, which is
based on EEG signals that correspond to the driver’s right hand, left hand and both hands imaginary movements is also investigated and reported here [10].
In order to analyse and visualize acquired EEG signals, the approach could be offline, or online. Offline analysis enables better understanding of brain functions and building the knowledge based on acquired data, it provides options of various processing tools needed to analyse data and visualize it graphically (in form of plots or graphs). However, it does not allow time execution of commands that could be used to control output devices in real-time. On the contrary, online processing is suitable for real-time control of output devices; however, the limitations lie with the data analysis and realization of actions. Online processing of EEG data is apt for experts in the field who can visualize the quality of data. To analyse or process data, various tools are available, both for online and offline mode, and both open source and non-open source, such as, OpenViBE, BioSig, BCI2000, BCI++, MATLAB toolboxes EEGLAB, BCILAB (plug-in of EEGLAB) [16-20]. OpenViBE is open source software, popular and easy to access. It provides a platform for designing, testing and using the BCI in real-time and in virtual-time environments [21].
Madiha Tariq et al. / Procedia Computer Science 126 (2018) 1936–1944 1937 Available online at www.sciencedirect.com
ScienceDirect
Procedia Computer Science 00 (2018) 000–000
www.elsevier.com/locate/procedia
1877-0509 © 2018 The Authors. Published by Elsevier Ltd.
This is an open access article under the CC BY-NC-ND license (https://creativecommons.org/licenses/by-nc-nd/4.0/) Selection and peer-review under responsibility of KES International.
22nd International Conference on Knowledge-Based and Intelligent Information &
Engineering Systems
Motor imagery based EEG features visualization for BCI
applications
Madiha Tariq*, Pavel M. Trivailo, Milan Simic
School of Engineering, RMIT university Bundoora Plenty Road, 3083 Victoria Australia
Abstract
Over recent years, electroencephalography’s (EEG) use in the state-of-the-art brain-computer interface (BCI) technology has broadened to augment the quality of life, both with medical and non-medical applications. For medical applications, the availability of real-time data for processing, which could be used as command signals to control robotic devices, is limited to specific platforms. This paper focuses on the possibility to analyse and visualize EEG signal features using OpenViBE acquisition platform in offline mode apart from its default real-time processing capability, and the options available for processing of data in offline mode. We employed OpenViBE platform to acquire EEG signals, pre-process it and extract features for a BCI system. For testing purposes, we analysed and tried to visualize EEG data offline, by developing scenarios, using method for quantification of event-related (de)synchronization ERD/ERS patterns, as well as, built in signal processing algorithms available in OpenViBE-designer toolbox. Acquired data was based on deployment of standard Graz BCI experimental protocol, used for foot kinaesthetic motor imagery (KMI). Results clearly reflect that the platform OpenViBE is a streaming tool that encourages processing and analysis of EEG data online, contrary to analysis, or visualization of data in offline, or global mode. For offline analysis and visualization of data, other relevant platforms are discussed. In online execution of BCI, OpenViBE is a potential tool for the control of wearable lower-limb devices, robotic vehicles and rehabilitation equipment. Other applications include remote control of mechatronic devices, or driving of passenger cars by human thoughts.
© 2018 The Authors. Published by Elsevier Ltd.
This is an open access article under the CC BY-NC-ND license (https://creativecommons.org/licenses/by-nc-nd/4.0/) Selection and peer-review under responsibility of KES International.
Keywords: EEG; BCI; OpenViBE; kinaesthetic motor imagery (KMI)
* Corresponding author. Tel.: +61 421 136 356; fax: +0-000-000-0000 . E-mail address: [email protected]
Available online at www.sciencedirect.com
ScienceDirect
Procedia Computer Science 00 (2018) 000–000
www.elsevier.com/locate/procedia
1877-0509 © 2018 The Authors. Published by Elsevier Ltd.
This is an open access article under the CC BY-NC-ND license (https://creativecommons.org/licenses/by-nc-nd/4.0/) Selection and peer-review under responsibility of KES International.
22nd International Conference on Knowledge-Based and Intelligent Information &
Engineering Systems
Motor imagery based EEG features visualization for BCI
applications
Madiha Tariq*, Pavel M. Trivailo, Milan Simic
School of Engineering, RMIT university Bundoora Plenty Road, 3083 Victoria Australia
Abstract
Over recent years, electroencephalography’s (EEG) use in the state-of-the-art brain-computer interface (BCI) technology has broadened to augment the quality of life, both with medical and non-medical applications. For medical applications, the availability of real-time data for processing, which could be used as command signals to control robotic devices, is limited to specific platforms. This paper focuses on the possibility to analyse and visualize EEG signal features using OpenViBE acquisition platform in offline mode apart from its default real-time processing capability, and the options available for processing of data in offline mode. We employed OpenViBE platform to acquire EEG signals, pre-process it and extract features for a BCI system. For testing purposes, we analysed and tried to visualize EEG data offline, by developing scenarios, using method for quantification of event-related (de)synchronization ERD/ERS patterns, as well as, built in signal processing algorithms available in OpenViBE-designer toolbox. Acquired data was based on deployment of standard Graz BCI experimental protocol, used for foot kinaesthetic motor imagery (KMI). Results clearly reflect that the platform OpenViBE is a streaming tool that encourages processing and analysis of EEG data online, contrary to analysis, or visualization of data in offline, or global mode. For offline analysis and visualization of data, other relevant platforms are discussed. In online execution of BCI, OpenViBE is a potential tool for the control of wearable lower-limb devices, robotic vehicles and rehabilitation equipment. Other applications include remote control of mechatronic devices, or driving of passenger cars by human thoughts.
© 2018 The Authors. Published by Elsevier Ltd.
This is an open access article under the CC BY-NC-ND license (https://creativecommons.org/licenses/by-nc-nd/4.0/) Selection and peer-review under responsibility of KES International.
Keywords: EEG; BCI; OpenViBE; kinaesthetic motor imagery (KMI)
* Corresponding author. Tel.: +61 421 136 356; fax: +0-000-000-0000 . E-mail address: [email protected]
Tariq et al./ Procedia Computer Science 00 (2018) 000–000
1.Introduction
In recent years, new attributes to human computer interaction have revolutionized various fields of application, e.g. medicine, entertainment, etc. Predominantly, these technologies are of the key interest to researchers in the areas of health and rehabilitation, e.g. upper or lower-limb wearable robot control such as prosthetic, exoskeleton, or orthosis devices [1]. The state of the art brain-computer interface (BCI) has enabled real-time monitoring of the brain activities, and allows the brain signals to control external devices, like neuroprosthesis, without the involvement of any muscular activity [2-5]. It also functions as a bridge to bring sensory input into the brain, bypassing damages sight, listening or sensing abilities. A BCI system commonly deploys input signals that are elicited upon execution of motor imagery tasks, i.e. kinaesthetic imagination of a limb movement; these could be hand, foot or tongue movements.
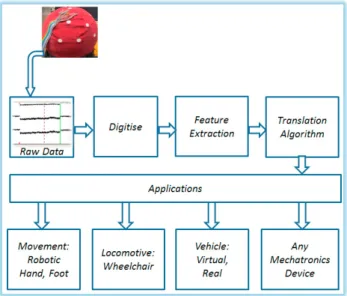
The application areas of BCI range from wheelchair control to security system [6]. BCI has been used to control vehicles in 3D environment recently, as already presented in [7-15]. Various types of BCI system applications are shown in Fig. 1. In the near future, we hope to see a new revolutionary application of the BCI control of human limbs, in the cases when patients have spinal cord injuries. Driving a virtual car in a simulated and in realistic city using EEG is already presented [12]. System is based on P300 wave signal acquisition, which is analysed, recognised and converted into control commands. Virtual car is controlled in 3D environment. The P300 is an event related potential associated to brain activities in decision making. Vehicle control, in a car racing game, which is
based on EEG signals that correspond to the driver’s right hand, left hand and both hands imaginary movements is also investigated and reported here [10].
In order to analyse and visualize acquired EEG signals, the approach could be offline, or online. Offline analysis enables better understanding of brain functions and building the knowledge based on acquired data, it provides options of various processing tools needed to analyse data and visualize it graphically (in form of plots or graphs). However, it does not allow time execution of commands that could be used to control output devices in real-time. On the contrary, online processing is suitable for real-time control of output devices; however, the limitations lie with the data analysis and realization of actions. Online processing of EEG data is apt for experts in the field who can visualize the quality of data. To analyse or process data, various tools are available, both for online and offline mode, and both open source and non-open source, such as, OpenViBE, BioSig, BCI2000, BCI++, MATLAB toolboxes EEGLAB, BCILAB (plug-in of EEGLAB) [16-20]. OpenViBE is open source software, popular and easy to access. It provides a platform for designing, testing and using the BCI in real-time and in virtual-time environments [21].
1938 Madiha Tariq et al. / Procedia Computer Science 126 (2018) 1936–1944Tariq et al./ Procedia Computer Science 00 (2018) 000–000
The OpenViBE platform comprises of a set of software modules dedicated to: Data Acquisition, Data Pre-processing, Data Processing, and Cortical Data Visualization. It also includes the module for interaction with virtual reality (VR) displays. OpenViBE is designed based on the concept of a box, i.e. a fundamental component controlling a fraction of the whole processing pipeline. This enables to develop reusable components, decreases development time and allows for quick extend of functionalities. The platform enables users to add new software modules based on their customized needs [21].
This paper focuses on the testing of OpenViBE platform for the possibility to analyse KMI-based EEG signals in offline or global mode and visualize resulting features in form of output plots. For materializing this, we formulated our band power feature method in the designer window of OpenViBE. To select features of interest, from the recorded mu (8-11 Hz) and beta (12-30 Hz) rhythms, event-related desynchronization (ERD) and event-related synchronization (ERS) were quantified using standard methods [22, 23]. This paper will provide readers an insight of the possibilities to use OpenViBE for visualization of data in offline mode.
2. Methods
2.1. Experimentalparadigm and data collection
We started our investigation by concentrating on the BCI controlled robotic foot movement i.e. one of the rehabilitation applications, as shown in Fig.1. This was based on the detection and decoding of EEG signals that could be used for the control of a robotic foot. Once reliable signal detection and decoding via pre-processing and feature extraction methods is achieved, the next step simply requires conversion, or translation of the feature vector that could be applied to any application. We should highlight here that robotic foots or hands, as well as locomotive equipment, vehicles, or mechatronics devices are intelligent systems. Following that, there is no need for detailed, step by step control of the applications. This approach simplifies the requirements of BCI system, which could use different data acquisition (DAQ) systems. We have concentrated on electrophysiological signals, EEG, as input signals, since it is based on non-invasive methods to record brain activity, and provides reliable output.
The study involved the evaluation of raw EEG data collected from four healthy participants, with no history of neurological disorder and no BCI experience. All were aged between 24-27 years. Ethics approval was granted by the College of Human Ethics Advisory Network (CHEAN) Committee of RMIT University, Melbourne, Australia. EEG neurofeedback (24-channel) BrainMaster Discovery 24E was used to record EEG signals from the brain. The experiment was based on performance of foot kinesthetic motor imagery. In order to set experimental protocol, the Graz motor imagery BCI stimulator box was used from OpenViBE acquisition platform, as shown in Fig. 2. Each trial consisted of a 3 sec reference period for the processing of epochs. An audio beep of 1 sec was incorporated in the beginning of the trial to alert the subject, see Table 1. Each trial was in total 10 sec long. That included 2 sec for cues display and 5 sec for performing motor imagery task, i.e. left or right foot movement. In total, one run consisted of 40 trials, including 20 for left foot and 20 for right foot, displayed randomly to overcome any adaptation. As the task involved kinesthetic motor imagery (KMI), therefore the mu and beta rhythms were analyzed [2, 3].
Madiha Tariq et al. / Procedia Computer Science 126 (2018) 1936–1944 1939
Tariq et al./ Procedia Computer Science 00 (2018) 000–000
The OpenViBE platform comprises of a set of software modules dedicated to: Data Acquisition, Data Pre-processing, Data Processing, and Cortical Data Visualization. It also includes the module for interaction with virtual reality (VR) displays. OpenViBE is designed based on the concept of a box, i.e. a fundamental component controlling a fraction of the whole processing pipeline. This enables to develop reusable components, decreases development time and allows for quick extend of functionalities. The platform enables users to add new software modules based on their customized needs [21].
This paper focuses on the testing of OpenViBE platform for the possibility to analyse KMI-based EEG signals in offline or global mode and visualize resulting features in form of output plots. For materializing this, we formulated our band power feature method in the designer window of OpenViBE. To select features of interest, from the recorded mu (8-11 Hz) and beta (12-30 Hz) rhythms, event-related desynchronization (ERD) and event-related synchronization (ERS) were quantified using standard methods [22, 23]. This paper will provide readers an insight of the possibilities to use OpenViBE for visualization of data in offline mode.
2. Methods
2.1. Experimentalparadigm and data collection
We started our investigation by concentrating on the BCI controlled robotic foot movement i.e. one of the rehabilitation applications, as shown in Fig.1. This was based on the detection and decoding of EEG signals that could be used for the control of a robotic foot. Once reliable signal detection and decoding via pre-processing and feature extraction methods is achieved, the next step simply requires conversion, or translation of the feature vector that could be applied to any application. We should highlight here that robotic foots or hands, as well as locomotive equipment, vehicles, or mechatronics devices are intelligent systems. Following that, there is no need for detailed, step by step control of the applications. This approach simplifies the requirements of BCI system, which could use different data acquisition (DAQ) systems. We have concentrated on electrophysiological signals, EEG, as input signals, since it is based on non-invasive methods to record brain activity, and provides reliable output.
The study involved the evaluation of raw EEG data collected from four healthy participants, with no history of neurological disorder and no BCI experience. All were aged between 24-27 years. Ethics approval was granted by the College of Human Ethics Advisory Network (CHEAN) Committee of RMIT University, Melbourne, Australia. EEG neurofeedback (24-channel) BrainMaster Discovery 24E was used to record EEG signals from the brain. The experiment was based on performance of foot kinesthetic motor imagery. In order to set experimental protocol, the Graz motor imagery BCI stimulator box was used from OpenViBE acquisition platform, as shown in Fig. 2. Each trial consisted of a 3 sec reference period for the processing of epochs. An audio beep of 1 sec was incorporated in the beginning of the trial to alert the subject, see Table 1. Each trial was in total 10 sec long. That included 2 sec for cues display and 5 sec for performing motor imagery task, i.e. left or right foot movement. In total, one run consisted of 40 trials, including 20 for left foot and 20 for right foot, displayed randomly to overcome any adaptation. As the task involved kinesthetic motor imagery (KMI), therefore the mu and beta rhythms were analyzed [2, 3].
Tariq et al./ Procedia Computer Science 00 (2018) 000–000
Relax
Fig. 2. Established hardware-software connection between Discovery 24E amplifier and OpenViBE acquisition software (adapted from [2, 3])
Table 1. Motor imagery protocol for each cue in OpenViBE
Cues Visuals Action
Fixation cross Prepare for experiment to start
Audio beep Get alert to start
Visual cue
Performance task Imagine Moving Foot Left or Right
1940 Madiha Tariq et al. / Procedia Computer Science 126 (2018) 1936–1944Tariq et al./ Procedia Computer Science 00 (2018) 000–000
2.2. Data processing using OpenViBE
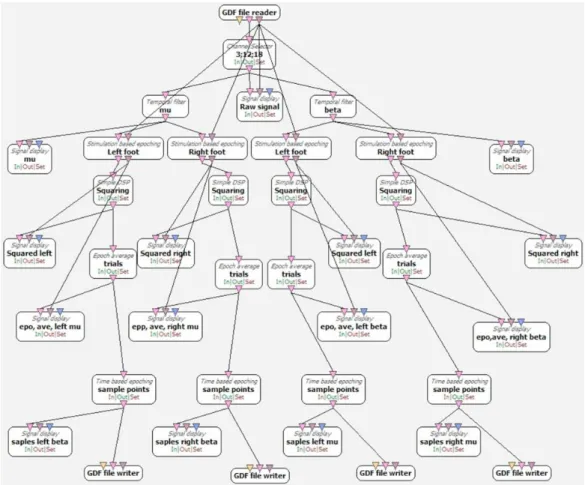
Using the designer tool of OpenViBE, we created a scenario by incorporating modules from the tool panel, see Fig 3. The ERD/ERS quantification was based on method suggested by [22, 23].
𝑦𝑦𝑖𝑖𝑖𝑖= (𝑠𝑠𝑖𝑖𝑖𝑖 − 𝑠𝑠𝑖𝑖)2; 𝐴𝐴𝑖𝑖=𝑁𝑁−11 ∑𝑁𝑁𝑖𝑖=1𝑦𝑦𝑖𝑖𝑖𝑖 (1)
𝑅𝑅 =1𝑘𝑘∑𝑟𝑟𝑟𝑟00+𝑘𝑘𝐴𝐴𝑖𝑖 (2)
In equation 1, 𝑠𝑠𝑖𝑖𝑖𝑖 is the j-thsample of the i-th trial of the bandpass filtered data, 𝑠𝑠̅𝑖𝑖 is the mean of the j-th sample
averaged over all bandpass filtered trials, and 𝐴𝐴𝑖𝑖 is the power of the j-th sample. In equation 2, 𝑅𝑅 is the average
power in the reference interval [𝑟𝑟0, 𝑟𝑟0+ 𝑘𝑘].
In order to quantify ERD and ERS patterns from oscillatory rhythms, the channel selector box was used to specify channels C3, Cz, and C4, i.e. effective electrode positions from the primary motor cortex, for analysis of mu and beta rhythms. Each of the mu and beta rhythms were bandpass filtered using 5th order Butterworth filter with low cut frequency of 8 Hz and high cut frequency of 11 Hz for mu, and a low cut frequency of 12 Hz and high cut frequency of 30 Hz for beta. This was done using the temporal filter box. Next, simulation based epoching was done for each rhythm against each task, i.e. left foot and right foot KMI. Following that, simple Digital Signal Processing (DSP) block was used to square each signal respectively. For each trial (20 for left and 20 for right foot KMI) epoch averaging was done. Averaging over sample points was done using time based epoching feature box.
However, calculating the ERD/ERS using equation 3:
𝐸𝐸𝑅𝑅𝐸𝐸𝑖𝑖 =𝐴𝐴𝑗𝑗𝑅𝑅−𝑅𝑅× 100% (3)
was not possible, as the whole data epoch was not accessible at the same time. Following that, the mean of one epoch could not be subtracted from equation 1. Because only small chunks of the signal were available on time, averaging over sample points resulted in a shorter output signal. Therefore data needed to be loaded into another platform for further processing.
Alternate approach was the utilization of spectral analysis box based on Fast Fourier Transform (FFT), however in that case, pre-processing of data was only possible using a combination of temporal filtering and time based epoching in contrast to stimulation based epoching. In that case, selection of independent epochs related to left and right event markers was not possible and data would have been treated as a complete trial without segmentation displaying the real-time power spectrum for each chunk of data being analysed.
Tariq et al./ Procedia Computer Science 00 (2018) 000–000
Fig. 3. Schematic organisation of boxes used to pre-process acquired data using OpenViBE designer
3. Results
Fundamental procedures to calculate ERD/ERS for analysis of data in one step could not be implemented using OpenViBE platform due to availability of data in small chunks at a time, as already explained. Resulting plots could only be achieved for run time, nor overall analysis. Following equation 1, for signals elicited from foot representation area, i.e. electrode position C3, Cz, and C4, the run-time resulting epochs for filtered mu and beta rhythm are shown in figure 4. Figure 5 and 6 reflect the run-time squared signal epochs followed by averaged epoched signals over trials for mu and beta frequency range, respectively. While epoching the signal based on stimulation for distinguishing between left vs. right task cue, it was observed that stimulation marker did not match the time that was set during experimental protocol, as after epoching the stream does not remain continuous anymore.
Since the proposed study was based on extraction of band power features as suggested in equation 3, alternate sensorimotor features (of interest), elicited upon KMI, such as common spatial patterns (CSP) or time-frequency features, could be used. In OpenViBE designer toolbox there are options as, spectral analysis to display the power spectrum in real-time, and CSP method.
Madiha Tariq et al. / Procedia Computer Science 126 (2018) 1936–1944 1941
Tariq et al./ Procedia Computer Science 00 (2018) 000–000
2.2. Data processing using OpenViBE
Using the designer tool of OpenViBE, we created a scenario by incorporating modules from the tool panel, see Fig 3. The ERD/ERS quantification was based on method suggested by [22, 23].
𝑦𝑦𝑖𝑖𝑖𝑖= (𝑠𝑠𝑖𝑖𝑖𝑖− 𝑠𝑠𝑖𝑖)2; 𝐴𝐴𝑖𝑖=𝑁𝑁−11 ∑𝑁𝑁𝑖𝑖=1𝑦𝑦𝑖𝑖𝑖𝑖 (1)
𝑅𝑅 =𝑘𝑘1∑𝑟𝑟𝑟𝑟00+𝑘𝑘𝐴𝐴𝑖𝑖 (2)
In equation 1, 𝑠𝑠𝑖𝑖𝑖𝑖 is the j-thsample of the i-th trial of the bandpass filtered data, 𝑠𝑠̅𝑖𝑖 is the mean of the j-th sample
averaged over all bandpass filtered trials, and 𝐴𝐴𝑖𝑖 is the power of the j-th sample. In equation 2, 𝑅𝑅 is the average
power in the reference interval [𝑟𝑟0, 𝑟𝑟0+ 𝑘𝑘].
In order to quantify ERD and ERS patterns from oscillatory rhythms, the channel selector box was used to specify channels C3, Cz, and C4, i.e. effective electrode positions from the primary motor cortex, for analysis of mu and beta rhythms. Each of the mu and beta rhythms were bandpass filtered using 5th order Butterworth filter with low cut frequency of 8 Hz and high cut frequency of 11 Hz for mu, and a low cut frequency of 12 Hz and high cut frequency of 30 Hz for beta. This was done using the temporal filter box. Next, simulation based epoching was done for each rhythm against each task, i.e. left foot and right foot KMI. Following that, simple Digital Signal Processing (DSP) block was used to square each signal respectively. For each trial (20 for left and 20 for right foot KMI) epoch averaging was done. Averaging over sample points was done using time based epoching feature box.
However, calculating the ERD/ERS using equation 3:
𝐸𝐸𝑅𝑅𝐸𝐸𝑖𝑖=𝐴𝐴𝑗𝑗𝑅𝑅−𝑅𝑅× 100% (3)
was not possible, as the whole data epoch was not accessible at the same time. Following that, the mean of one epoch could not be subtracted from equation 1. Because only small chunks of the signal were available on time, averaging over sample points resulted in a shorter output signal. Therefore data needed to be loaded into another platform for further processing.
Alternate approach was the utilization of spectral analysis box based on Fast Fourier Transform (FFT), however in that case, pre-processing of data was only possible using a combination of temporal filtering and time based epoching in contrast to stimulation based epoching. In that case, selection of independent epochs related to left and right event markers was not possible and data would have been treated as a complete trial without segmentation displaying the real-time power spectrum for each chunk of data being analysed.
Tariq et al./ Procedia Computer Science 00 (2018) 000–000
Fig. 3. Schematic organisation of boxes used to pre-process acquired data using OpenViBE designer
3. Results
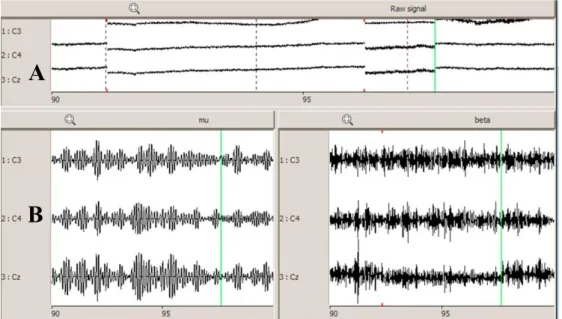
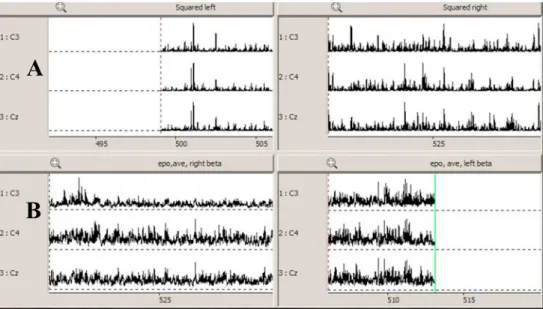
Fundamental procedures to calculate ERD/ERS for analysis of data in one step could not be implemented using OpenViBE platform due to availability of data in small chunks at a time, as already explained. Resulting plots could only be achieved for run time, nor overall analysis. Following equation 1, for signals elicited from foot representation area, i.e. electrode position C3, Cz, and C4, the run-time resulting epochs for filtered mu and beta rhythm are shown in figure 4. Figure 5 and 6 reflect the run-time squared signal epochs followed by averaged epoched signals over trials for mu and beta frequency range, respectively. While epoching the signal based on stimulation for distinguishing between left vs. right task cue, it was observed that stimulation marker did not match the time that was set during experimental protocol, as after epoching the stream does not remain continuous anymore.
Since the proposed study was based on extraction of band power features as suggested in equation 3, alternate sensorimotor features (of interest), elicited upon KMI, such as common spatial patterns (CSP) or time-frequency features, could be used. In OpenViBE designer toolbox there are options as, spectral analysis to display the power spectrum in real-time, and CSP method.
1942 Madiha Tariq et al. / Procedia Computer Science 126 (2018) 1936–1944
Tariq et al./ Procedia Computer Science 00 (2018) 000–000
Fig. 4. Chunk of signal in run-time of OpenViBE designer at electrode positions C3, C4 and Cz (green pointer indicates run-time of each epoch). (A) acquired raw signal display with stimulations; (B) pre-processing part signal display following temporal filtering in the mu frequency range
between 8Hz to 11 Hz and the beta frequency range 12Hz to 30 Hz with stimulations
Fig. 5. Epoched signal in run-time of OpenViBE designer at electrode positions C3, C4 and Cz (green pointer indicates run-time of each epoch). (A) pre-processing part signal display following squaring (simple DSP block) of left and right epoch, respectively in mu range; (B) processing
part signal display following averaging over trials of epoched data in the mu frequency range
A
B
A
B
Tariq et al./ Procedia Computer Science 00 (2018) 000–000
Fig. 6. Epoched signal in run-time of OpenViBE designer at electrode positions C3, C4 and Cz (green pointer indicates run-time of each epoch). (A) pre-processing part signal display following squaring (simple DSP block) of left and right epoch, respectively in mu range; (B) processing
part signal display following averaging over trials of epoched data in the mu frequency range.
4. Discussion and Conclusion
For different applications, such as controlling various local output devices in the real-time, based on BCI, or online control of mechatronic devices, both in real and virtual environments, OpenViBE is probably one of the most viable platform. However, it is not suitable for analysing command signals offline, nor it allows for visualization in form of plots or graphical outputs that could be saved for later use. OpenViBE is originally designed as a streaming tool for 'online' BCI experiments. Its operating philosophy is built on the logic of boxes processing small chunks of streamed signal at a time. It is contrary to MATLAB plugins, such as BCILAB, EEGLAB, or R/scipy etc. that provide access to analysis of data offline, where all the data (or epoch) is available at once in the form of big matrices or tensors. Although that one very large epoch can be formed in OpenViBE with available tool boxes to do the required analysis using a buffer box, clearly the platform is not designed for analysis or exploration of data offline. For analysis and visualization of data offline or in global sense, the data needs to be exported to a classical statistical package, as mentioned above. OpenViBE is best suitable for real-time control of output devices or systems driven by cortical signals in real or virtual environments.
Results from our research presented here suggest that OpenViBE could, potentially be a tool for the control of robotic foot controlled via KMI signals in real-time. The same imaginary actions could be used to control passenger cars through acceleration and brake pedals control, with the right foot and steering with the left foot. It is certain that such vehicles should include high level of automations, known as function specific, as defined in [24], i.e. applications like GPS navigation, collision avoidance, electronic stability control, emergency braking, parking assistance and others. These vehicles are not completely autonomous; therefore the driver could still have a sense of control, using his/her thoughts. Investigation on BCI control of various other applications that include all kind of virtual and real vehicles and mechatronic systems are subject to associated research projects.
The future prospects of this project involve the actuation of robotic foot model via KMI using OpenViBE. Smart robotic foot investigation and model design are subjects of an associated project conducted concurrently to our EEG BCI project. Model design, reliable data acquisition and decoding, using BCI methods, are the key steps in all these
A
Madiha Tariq et al. / Procedia Computer Science 126 (2018) 1936–1944 1943
Tariq et al./ Procedia Computer Science 00 (2018) 000–000
Fig. 4. Chunk of signal in run-time of OpenViBE designer at electrode positions C3, C4 and Cz (green pointer indicates run-time of each epoch). (A) acquired raw signal display with stimulations; (B) pre-processing part signal display following temporal filtering in the mu frequency range
between 8Hz to 11 Hz and the beta frequency range 12Hz to 30 Hz with stimulations
Fig. 5. Epoched signal in run-time of OpenViBE designer at electrode positions C3, C4 and Cz (green pointer indicates run-time of each epoch). (A) pre-processing part signal display following squaring (simple DSP block) of left and right epoch, respectively in mu range; (B) processing
part signal display following averaging over trials of epoched data in the mu frequency range
A
B
A
B
Tariq et al./ Procedia Computer Science 00 (2018) 000–000
Fig. 6. Epoched signal in run-time of OpenViBE designer at electrode positions C3, C4 and Cz (green pointer indicates run-time of each epoch). (A) pre-processing part signal display following squaring (simple DSP block) of left and right epoch, respectively in mu range; (B) processing
part signal display following averaging over trials of epoched data in the mu frequency range.
4. Discussion and Conclusion
For different applications, such as controlling various local output devices in the real-time, based on BCI, or online control of mechatronic devices, both in real and virtual environments, OpenViBE is probably one of the most viable platform. However, it is not suitable for analysing command signals offline, nor it allows for visualization in form of plots or graphical outputs that could be saved for later use. OpenViBE is originally designed as a streaming tool for 'online' BCI experiments. Its operating philosophy is built on the logic of boxes processing small chunks of streamed signal at a time. It is contrary to MATLAB plugins, such as BCILAB, EEGLAB, or R/scipy etc. that provide access to analysis of data offline, where all the data (or epoch) is available at once in the form of big matrices or tensors. Although that one very large epoch can be formed in OpenViBE with available tool boxes to do the required analysis using a buffer box, clearly the platform is not designed for analysis or exploration of data offline. For analysis and visualization of data offline or in global sense, the data needs to be exported to a classical statistical package, as mentioned above. OpenViBE is best suitable for real-time control of output devices or systems driven by cortical signals in real or virtual environments.
Results from our research presented here suggest that OpenViBE could, potentially be a tool for the control of robotic foot controlled via KMI signals in real-time. The same imaginary actions could be used to control passenger cars through acceleration and brake pedals control, with the right foot and steering with the left foot. It is certain that such vehicles should include high level of automations, known as function specific, as defined in [24], i.e. applications like GPS navigation, collision avoidance, electronic stability control, emergency braking, parking assistance and others. These vehicles are not completely autonomous; therefore the driver could still have a sense of control, using his/her thoughts. Investigation on BCI control of various other applications that include all kind of virtual and real vehicles and mechatronic systems are subject to associated research projects.
The future prospects of this project involve the actuation of robotic foot model via KMI using OpenViBE. Smart robotic foot investigation and model design are subjects of an associated project conducted concurrently to our EEG BCI project. Model design, reliable data acquisition and decoding, using BCI methods, are the key steps in all these
A
1944 Madiha Tariq et al. / Procedia Computer Science 126 (2018) 1936–1944Tariq et al./ Procedia Computer Science 00 (2018) 000–000
novel and exciting applications.
References
[1] Tariq, M., Z. Koreshi, and P. Trivailo. Optimal Control of an Active Prosthetic Ankle. in Proceedings of the 3rd International Conference on Mechatronics and Robotics Engineering. 2017. ACM.
[2] Tariq, M., et al. Mu-beta rhythm ERD/ERS quantification for foot motor execution and imagery tasks in BCI applications. in Cognitive Infocommunications (CogInfoCom), 2017 8th IEEE International Conference on. 2017. IEEE.
[3] Tariq, M., P.M. Trivailo, and M. Simic. Detection of knee motor imagery by Mu ERD/ERS quantification for BCI based neurorehabilitation applications. in Control Conference (ASCC), 2017 11th Asian. 2017. IEEE.
[4] Lee, F., et al. A comparative analysis of multi-class EEG classification for brain computer interface. in Proceedings of the 10th Computer Vision Winter Workshop. 2005.
[5] Tariq, M., P.M. Trivailo, and M. Simic, Event-related changes detection in sensorimotor rhythm. International Robotics & Automation Journal, 2018. 4(2): p. 119-120.
[6] Shende, P.M. and V.S. Jabade. Literature review of brain computer interface (BCI) using Electroencephalogram signal. in 2015 International Conference on Pervasive Computing (ICPC). 2015.
[7] González-Mendoza, A., et al. Brain Computer Interface based on SSVEP for controlling a remote control car. in 2015 International Conference on Electronics, Communications and Computers (CONIELECOMP). 2015.
[8] Hongtao, W., L. Ting, and H. Zhenfeng. Remote control of an electrical car with SSVEP-Based BCI. in 2010 IEEE International Conference on Information Theory and Information Security. 2010.
[9] Huh, W.-G. and S.-B. Cho. Optimal partial filters of EEG signals for shared control of vehicle. in Soft Computing and Pattern Recognition (SoCPaR), 2015 7th International Conference of. 2015. IEEE.
[10] Kim, D. and S.B. Cho. A brain-computer interface for shared vehicle control on TORCS car racing game. in 2014 10th International Conference on Natural Computation (ICNC). 2014.
[11] Kreilinger, A., H. Hiebel, and G.R. Müller-Putz, Single Versus Multiple Events Error Potential Detection in a BCI-Controlled Car Game With Continuous and Discrete Feedback. IEEE Transactions on Biomedical Engineering, 2016. 63(3): p. 519-529.
[12] Pan, X., et al. Enjoy driving from thought in a virtual city. in 2017 36th Chinese Control Conference (CCC). 2017.
[13] QingKai, L., et al. Remote Control System of an Electric Car Based on the Alpha Wave in EEG. in 2006 6th World Congress on Intelligent Control and Automation. 2006.
[14] Venuto, D.D., V.F. Annese, and G. Mezzina. An embedded system remotely driving mechanical devices by P300 brain activity. in Design, Automation & Test in Europe Conference & Exhibition (DATE), 2017. 2017.
[15] Wu, G., Z. Xie, and X. Wang. Development of a mind-controlled Android racing game using a brain computer interface (BCI). in 2014 4th IEEE International Conference on Information Science and Technology. 2014.
[16] Dornhege, G., Toward brain-computer interfacing. 2007: MIT press.
[17] Mellinger, J. and G. Schalk, BCI2000: a general-purpose software platform for BCI research. Towards brain-computer interfacing, 2007.
[18] Maggi, L., et al., BCI++: an object-oriented BCI prototyping framework. 2008: Citeseer.
[19] Delorme, A. and S. Makeig, EEGLAB: an open source toolbox for analysis of single-trial EEG dynamics including independent component analysis. Journal of neuroscience methods, 2004. 134(1): p. 9-21.
[20] Delorme, A., et al., EEGLAB, SIFT, NFT, BCILAB, and ERICA: new tools for advanced EEG processing. Computational intelligence and neuroscience, 2011. 2011: p. 10.
[21] Renard, Y., et al., Openvibe: An open-source software platform to design, test, and use brain–computer interfaces in real and virtual environments. Presence: teleoperators and virtual environments, 2010. 19(1): p. 35-53.
[22] Graimann, B., et al., Visualization of significant ERD/ERS patterns in multichannel EEG and ECoG data. Clinical Neurophysiology, 2002. 113(1): p. 43-47.
[23] Graimann, B. and G. Pfurtscheller, Quantification and visualization of event-related changes in oscillatory brain activity in the time–
frequency domain. Progress in brain research, 2006. 159: p. 79-97.
[24] Elbanhawi, M., M. Simic, and R. Jazar, In the Passenger Seat: Investigating Ride Comfort Measures in Autonomous Cars. IEEE Intelligent Transportation Systems Magazine, 2015. 7(3): p. 4-17.
![Fig. 2. Established hardware-software connection between Discovery 24E amplifier and OpenViBE acquisition software (adapted from [2, 3])](https://thumb-us.123doks.com/thumbv2/123dok_us/9000589.2797868/5.816.185.638.107.528/established-hardware-software-connection-discovery-amplifier-openvibe-acquisition.webp)