Predicting and Improving Performance
on Introductory Programming Courses
(CS
1
)
K E I T H Q U I L L E
A thesis submitted for the degree of
Doctor of Philosophy
Department of Computer Science
Maynooth University
December
2019
Supervisor: Dr. Susan Bergin
C O N T E N T S
1
i n t r o d u c t i o n
1
1
.
1
The Introductory Programming Landscape . . . .
1
1
.
2
The Starting Point - PreSS . . . .
3
1
.
2
.
1
Why PreSS? . . . .
3
1
.
2
.
2
Reference Terms . . . .
4
1
.
3
Introduction to this Research . . . .
5
1
.
3
.
1
Research Goals . . . .
5
1
.
3
.
2
Ethical Approval . . . .
5
1
.
3
.
3
Thesis Contributions . . . .
6
1
.
3
.
4
Thesis Visual Overview . . . .
10
1
.
4
Publications . . . .
11
2
l i t e r at u r e r e v i e w
13
2
.
1
Introduction . . . .
13
2
.
2
Review of the Literature . . . .
13
2
.
2
.
1
Methodology . . . .
13
2
.
2
.
2
Multi-Institutional . . . .
14
2
.
2
.
3
Longitudinal . . . .
15
2
.
2
.
4
Generalizable Sample Size . . . .
15
2
.
2
.
5
Prediction Accuracy . . . .
15
2
.
2
.
6
Prediction Timing . . . .
16
2
.
2
.
7
Prediction Sensitivity & Specificity
. . . .
16
2
.
2
.
8
Revalidated Prediction Models . . . .
17
2
.
3
The Original PreSS Study and Model
. . . .
18
2
.
3
.
1
Factor Selection . . . .
18
2
.
3
.
2
Data Preprocessing . . . .
19
2
.
3
.
4
Performance Measures . . . .
20
2
.
3
.
5
Results and Performance . . . .
20
2
.
4
Summary . . . .
21
2
.
4
.
1
Additional Finding: Date of Studies . . . .
22
3
r e va l i d at i n g t h e p r e s s m o d e l
26
3
.
1
Justification Study . . . .
27
3
.
1
.
1
Introduction . . . .
27
3
.
1
.
2
Factors Explored . . . .
27
3
.
1
.
3
Results . . . .
29
3
.
1
.
4
Summary . . . .
29
3
.
2
Main Large Scale Study . . . .
30
3
.
2
.
1
Introduction . . . .
30
3
.
2
.
2
Data Collection . . . .
30
3
.
2
.
3
The Main Study: The Core of this Research . . . . .
31
3
.
2
.
4
Results . . . .
32
3
.
2
.
5
Summary . . . .
33
4
p r e s s
#
34
4
.
1
Introduction . . . .
34
4
.
2
System Requirements . . . .
34
4
.
3
Platform Selection . . . .
38
4
.
3
.
1
Server Selection . . . .
38
4
.
3
.
2
Security and Vulnerabilities . . . .
38
4
.
3
.
3
Database Management System (DBMS) . . . .
39
4
.
3
.
4
Language Selection . . . .
39
4
.
3
.
5
Platform Selection Summary . . . .
40
4
.
4
Design . . . .
41
4
.
5
Development of PreSS# . . . .
41
4
.
5
.
1
PCA and naïve Bayes Development . . . .
41
4
.
5
.
2
PCA and naïve Bayes Integration into PreSS# . . . .
46
4
.
6
Testing . . . .
50
4
.
6
.
1
Alpha Testing . . . .
51
4
.
6
.
2
Beta Testing . . . .
53
4
.
7
Replication of PreSS . . . .
53
4
.
7
.
1
Overview . . . .
53
4
.
7
.
2
PCA Replication of Results . . . .
54
4
.
7
.
3
Naïve Bayes Replication of Results . . . .
55
4
.
8
Summary . . . .
56
5
a d d i t i o na l f a c t o r s
57
5
.
1
Introduction . . . .
57
5
.
2
Factors from the Original PreSS Study . . . .
58
5
.
3
Factors from the Justification Study
. . . .
60
5
.
3
.
1
Resulting Models from the Justification Study . . .
61
5
.
4
Investigating the new Factors Using The Main Study . . .
62
5
.
4
.
1
Introduction . . . .
62
5
.
4
.
2
Factor Selection . . . .
63
5
.
4
.
3
Updated Models . . . .
63
5
.
5
Summary . . . .
64
6
m a c h i n e l e a r n i n g t e c h n i q u e s
65
6
.
1
Introduction . . . .
65
6
.
2
Method . . . .
65
6
.
2
.
1
Machine Learning Algorithms . . . .
65
6
.
2
.
2
Artificial Neural Networks . . . .
66
6
.
3
Machine Learning Algorithms . . . .
66
6
.
3
.
1
Logistic Regression . . . .
66
6
.
3
.
2
K-Nearest Neighbour . . . .
67
6
.
3
.
3
Backpropagation . . . .
68
6
.
3
.
4
naïve Bayes . . . .
69
6
.
3
.
5
Decision Trees . . . .
70
6
.
4
Comparing Machine Learning Algorithms . . . .
71
6
.
4
.
1
Original Press Study . . . .
71
6
.
4
.
2
Updated PreSS Models . . . .
72
6
.
5
Artificial Neural Networks . . . .
74
6
.
5
.
1
Environment . . . .
74
6
.
5
.
2
Hyper-Parameter Tuning . . . .
75
6
.
5
.
3
Network Topologies . . . .
76
6
.
5
.
4
Results . . . .
78
6
.
6
Summary . . . .
79
7
i n s i g h t s i n t o g e n d e r d i f f e r e n c e s i n c s 1
80
7
.
1
Introduction . . . .
80
7
.
1
.
1
Motivation . . . .
80
7
.
1
.
2
Literature . . . .
81
7
.
2
Data Collection . . . .
82
7
.
3
Analysis . . . .
84
7
.
3
.
1
Approach . . . .
84
7
.
4
Results . . . .
85
7
.
4
.
1
Instrument
1
: Background Factors . . . .
85
7
.
4
.
2
Instrument
2
: Psychological Factors . . . .
86
7
.
4
.
3
Instrument
3
: Programming Test . . . .
89
7
.
4
.
4
Additional Analysis . . . .
90
7
.
5
Summary . . . .
92
8
i n t e r v e n t i o n s
93
8
.
1
Scratch to Improve Self-Efficacy and Performance in CS
1
.
94
8
.
1
.
1
Introduction . . . .
94
8
.
1
.
2
Data Collection . . . .
96
8
.
1
.
3
Methodology . . . .
96
8
.
1
.
4
Results . . . .
97
8
.
1
.
5
Additional Findings . . . .
99
8
.
2
.
1
Introduction . . . .
101
8
.
2
.
2
Literature
. . . .
101
8
.
2
.
3
Data Collection . . . .
102
8
.
2
.
4
Methodology . . . .
103
8
.
2
.
5
Student Cohort Analysis . . . .
104
8
.
2
.
6
Results . . . .
105
8
.
2
.
7
Additional Analysis . . . .
106
8
.
2
.
8
Summary . . . .
108
9
c o n c l u s i o n a n d f u t u r e d i r e c t i o n
109
9
.
1
Conclusion . . . .
109
9
.
2
Thesis Contributions . . . .
109
9
.
2
.
1
Longitudinal Revalidation of PreSS . . . .
109
9
.
2
.
2
A web-based real time implementation of PreSS . .
110
9
.
2
.
3
Development of the PreSS Model . . . .
110
9
.
2
.
4
Analysis of Gender Differences in CS
1
. . . .
111
9
.
2
.
5
Interventions to improve performance in CS
1
. . .
112
9
.
3
Future Direction . . . .
113
9
.
3
.
1
Roll Out of PreSS# . . . .
113
9
.
3
.
2
Improving PreSS Further . . . .
113
9
.
3
.
3
Learning Analytics . . . .
113
9
.
3
.
4
Gender Research . . . .
114
9
.
3
.
5
Promoting A Growth Mindset in CS
1
. . . .
114
9
.
3
.
6
Migrating PreSS# to Second level . . . .
115
9
.
4
Final Thoughts . . . .
116
a
a p p e n d i x a
118
a
.
1
Data Processing Techniques . . . .
118
a
.
1
.
1
Internal Consistency . . . .
118
a
.
1
.
2
Principal Component Analysis . . . .
118
a
.
2
Cross Validation . . . .
119
b
a p p e n d i x b
123
c
a p p e n d i x c
124
c
.
1
Mathematical Normalization Table . . . .
124
c
.
1
.
1
Normalization . . . .
125
d
a p p e n d i x d
127
d
.
1
Pre Justification Study Survey . . . .
127
e
a p p e n d i x e
128
e
.
1
Programming Self-Efficacy Questionnaire . . . .
128
f
a p p e n d i x f
129
f
.
1
Mindset Survey . . . .
129
L I S T O F F I G U R E S
Figure
1
.
1
Visual Overview of Research . . . .
10
Figure
4
.
1
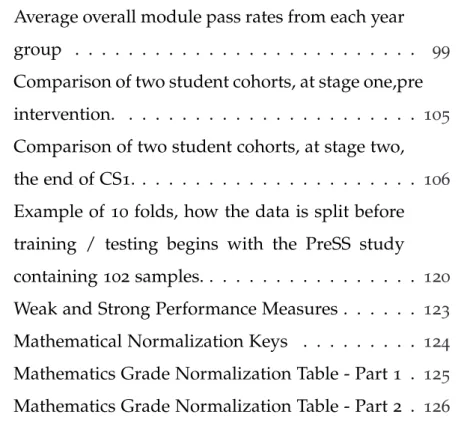
MVC architecture diagram . . . .
40
Figure
4
.
2
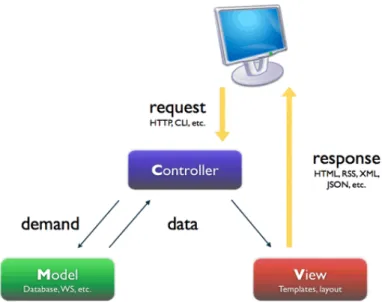
UML use case diagram for the three types of users.
42
Figure
4
.
3
UML architecture diagram of PreSS# . . . .
43
Figure
4
.
4
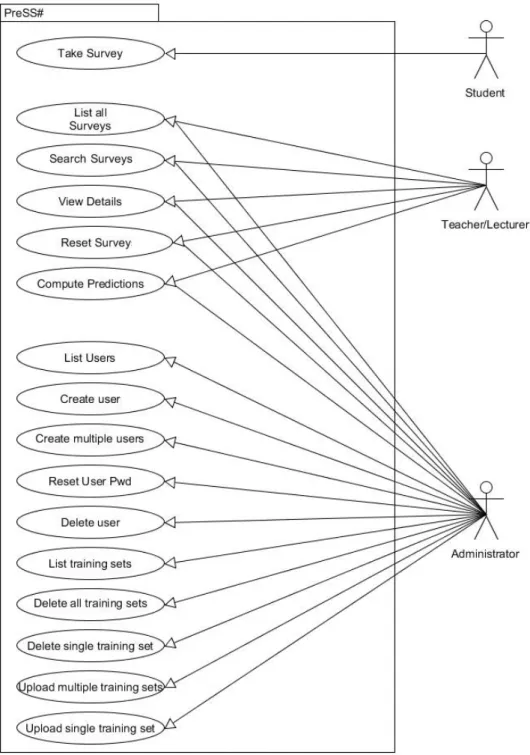
A screen shot of the naïve Bayes application
de-veloped running on the PreSS study, showing the
probability break down of each classification. . . .
45
Figure
4
.
5
A screen shot of the naïve Bayes application
de-veloped running on the PreSS study, showing the
confusion matrix. . . .
45
Figure
4
.
6
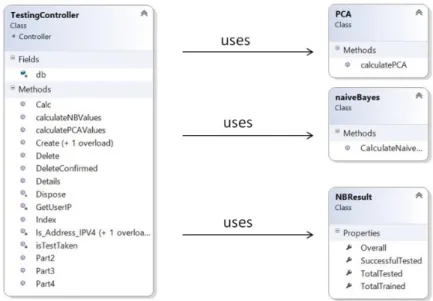
UML class diagram showing the PCA and naïve
Bayes classes interacting with the Testing Controller.
46
Figure
4
.
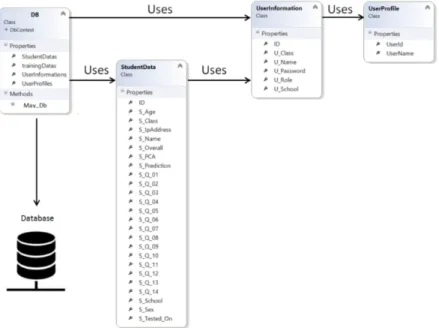
7
Illustration of Entity class and the Models
(prop-erties) used. . . .
48
Figure
6
.
1
Logistic regression formula and visual
represen-tation of the algorithm. . . .
67
Figure
6
.
2
KNN formula and visual representation of the
al-gorithm. . . .
68
Figure
6
.
3
Single perceptron in ANN . . . .
69
Figure
6
.
4
A visual example of a decision tree . . . .
70
Figure
6
.
5
SVM example hyperplanes (linear and non-linear)
71
Figure
6
.
6
Network topology: Single Layer ANN . . . .
77
Figure
6
.
7
Network topology: Deep Learning ANN . . . .
77
Figure
6
.
8
Network topology: Convolutional ANN . . . .
78
Figure
8
.
1
Programming self-efficacy and mindset values
Figure
8
.
2
Changes in programming self-efficacy and
mind-set over CS
1
, grouped by performance . . . .
107
Figure A.
1
Principal Component Analysis showing an
exam-ple of covariance eigenvectors with the largest
eigenvalues illustrated by the additional arrows. .
119
Figure A.
2
A screen shot of an application developed
run-ning on the PreSS study, showing the confusion
matrix. . . .
121
L I S T O F TA B L E S
Table
1
.
1
Reference guide for mapping RG’s to chapters. . .
10
Table
2
.
1
Summary of Literature Review References . . . . .
23
Table
2
.
1
Summary of Literature Review References . . . . .
24
Table
2
.
1
Summary of Literature Review References . . . . .
25
Table
3
.
1
Justification study, additional survey questions . .
28
Table
3
.
2
The original PreSS study compared to the main
study, using the original PreSS Model. . . .
32
Table
4
.
1
Software requirements for the development of PreSS#
- Part
1
. . . .
36
Table
4
.
2
Software requirements for the development of PreSS#
- Part
2
. . . .
37
Table
4
.
3
Results from alpha testing test cases - Part
1
. . . .
51
Table
4
.
4
Results from alpha testing test cases - Part
2
. . . .
52
Table
4
.
5
Results from beta testing test cases . . . .
53
Table
4
.
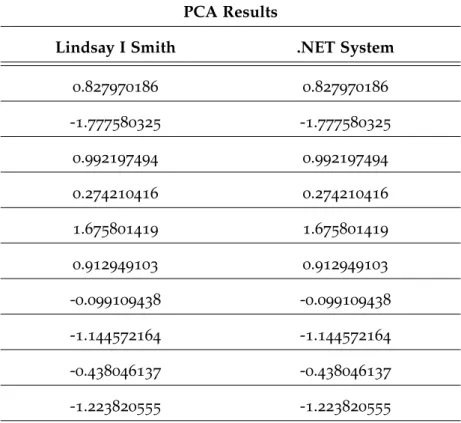
6
The Results from Smith’s study and from the .NET
Table
4
.
7
Results from naïve Bayes and WEKA applications
using
10
FCV on the PreSS study. . . .
55
Table
5
.
1
The
8
models that resulted in a significant gain in
accuracy with the PreSS model. . . .
59
Table
5
.
2
Justification study additional survey factors that
may have shown to have value . . . .
61
Table
5
.
3
The
17
factors included in the main study (after
data reduction) . . . .
62
Table
5
.
4
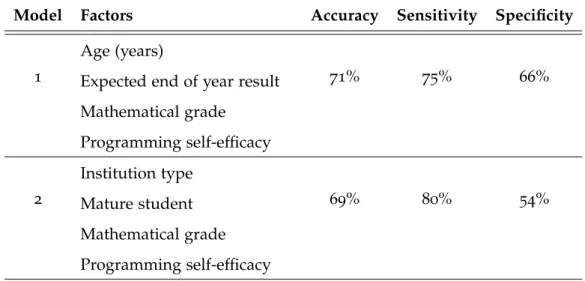
Recommended PreSS updated models, based on
factors developed from recent research . . . .
64
Table
6
.
1
Performance of machine learning algorithms from
the original PreSS study . . . .
72
Table
6
.
2
Performance of machine learning algorithms for
Model
1
. . . .
73
Table
6
.
3
Performance of machine learning algorithms for
Model
2
. . . .
74
Table
6
.
4
ANN Grid Search Parameters . . . .
76
Table
6
.
5
Performance of deep learning ANN’s. . . .
78
Table
7
.
1
A recap of the
17
factors included in the main study
84
Table
7
.
2
Background results with Welch’s t-test p values. .
86
Table
7
.
3
Psychological results with Welch’s t-test p values.
88
Table
7
.
4
Programming Test results with Welch’s t-test p
values. . . .
90
Table
8
.
1
Cohort data for the four years of the Scratch study
96
Table
8
.
2
ANOVA analysis of student’s self-efficacy from
all three year groups . . . .
98
Table
8
.
3
Student programming performance data
. . . . .
98
Table
8
.
4
ANOVA analysis of student’s performance from
Table
8
.
5
Average overall module pass rates from each year
group . . . .
99
Table
8
.
6
Comparison of two student cohorts, at stage one,pre
intervention. . . .
105
Table
8
.
7
Comparison of two student cohorts, at stage two,
the end of CS
1
. . . .
106
Table A.
1
Example of
10
folds, how the data is split before
training / testing begins with the PreSS study
containing
102
samples. . . .
120
Table B.
1
Weak and Strong Performance Measures . . . .
123
Table C.
1
Mathematical Normalization Keys . . . .
124
Table C.
2
Mathematics Grade Normalization Table - Part
1
.
125
A B S T R A C T
This thesis describes a longitudinal study on factors which predict
aca-demic success in introductory programming at undergraduate level,
in-cluding the development of these factors into a fully automated
web-based system (which predicts students who are at risk of not
succeed-ing early in the introductory programmsucceed-ing module) and interventions
to address attrition rates on introductory programming courses (CS
1
).
Numerous studies have developed models for predicting success in CS
1
,
however there is little evidence on their ability to generalise or on their
use beyond early investigations. In addition, they are seldom followed
up with interventions, after struggling students have been identified.
The approach overcomes this by providing a web-based real time
sys-tem, with a prediction model at its core that has been longitudinally
developed and revalidated, with recommendations for interventions
which educators could implement to support struggling students that
have been identified.
This thesis makes five fundamental contributions. The first is a
reval-idation of a prediction model named PreSS. The second contribution
is the development of a web-based, real time implementation of the
PreSS model, named PreSS#. The third contribution is a large
longi-tudinal, multi-variate, multi-institutional study identifying predictors
of performance and analysing machine learning techniques (including
deep learning and convolutional neural networks) to further develop
the PreSS model. This resulted in a prediction model with
approxi-mately
71
% accuracy, and over
80
% sensitivity, using data from
11
in-stitutions with a sample size of
692
students. The fourth contribution
psycho-logical, background, and performance differences between male and
female students to better inform the prediction model and the
tions. The final, fifth contribution, is the development of two
interven-tions that can be implemented early in CS
1
, once identified by PreSS#
to potentially improve student outcomes.
The work described in this thesis builds substantially on earlier work,
providing valid and reliable insights on gender differences, potential
in-terventions to improve performance and an unsurpassed, generalizable
prediction model, developed into a real time web-based system.
A C K N O W L E D G M E N T S
First and foremost, I would like to thank my amazing wife, Faith. A
sup-portive word from Faith in the car one day, started me on this amazing
journey, which I never imagined that I was able to do. To that, Faith’s
patience, support, encouragement and love was never ending
through-out this life changing endeavour, and I honestly would never have got
to this point without her. I can never thank you enough Faith... I am
finally here because of you.
I would really like to extend my sincere gratitude to my supervisor
Dr. Susan Bergin. I can not put into words, how professional and
amazing Dr. Bergin was. Her support and encouragement, has been
inspirational. If in ten years time, I could be a fraction of the supervisor
that Dr. Bergin was, I would be happy. I feel humbled and honoured
to have had such a great mentor, and I really hope that we get to work
together in the future. I have learned and experienced so much in these
past five years, I really sincerely thank you for that. I would also like
to thank Dr. Aidan Mooney, who has helped me so much over the five
years, with support and advice. I met Susan and Aidan for the first
time, as my undergraduate lab demonstrators in
2003
and it has been
an amazing journey!
I would also like to thank my family, especially my Mam and Dad,
Bernie and Austin. For my entire life they have both supported me
(and Faith) so much, always been there to help us out when needed,
and afforded me so much, I do not know how I could ever fully thank
you, I really do not. You have been amazing, and I will never forget that.
I also can not forget my brother, Darren, and my family in law, thank
you for all your support and encouragement.
D E C L A R AT I O N
I confirm that this is my own work and the use of all material from
other sources has been properly cited and fully acknowledged.
Keith Quille
1
I N T R O D U C T I O N
1
.
1
t h e i n t r o d u c t o r y p r o g r a m m i n g l a n d s c a p e
Computer Science (CS) non-progression (from year one into year two)
rates in Ireland are alarming, with a large number of students failing
to progress each year. Currently non-progression rates are
25
% in CS,
which is significantly higher than the national average of
16
% (across
all higher education disciplines). In two recent reports (
2010
and
2016
respectively), CS was found to have one of the largest rates of
non-progression across all National Framework of Qualification (NFQ) levels
in Ireland, from level
6
to level
8
[
77
,
82
]. In addition, CS is one of only
two fields of study, where the non-progression rate has increased since
the first report in
2010
. It is well acknowledged that a main contributor,
is that students struggle to succeed in their initial programming module
(CS
1
), a staple in most first year CS courses. Several studies have
investi-gated CS
1
failure rates in particular, reporting
33
% [
14
] and
32
.
3
% [
140
]
failure rates. While these are higher than the overall CS attrition rates
in Ireland, Watson noted that pass rates may not be trivial to measure,
for example some institutions in their study required a C grade to pass,
thus perhaps accounting for the difference.
Early identification of students who are at risk of non-progression is
often hindered by the very high student-lecturer ratio (
100
:
1
or greater).
Lecturers may not be aware that students are struggling until a
consid-erable time has passed and early problematic threshold concepts have
been encountered. Numerous approaches have been trialled with
vary-1
.
1
t h e i n t r o d u c t o r y p r o g r a m m i n g l a n d s c a p e
ing degrees of success to improve learning and assessment outcomes.
At our institution, numerous initiatives have been implemented to
im-prove outcomes, including the development of automated adaptive
as-sessment systems [
133
], novel teaching approaches such as problem
based learning [
64
] and more recently a Programming Support Centre
run by peer tutors [
89
]. As computer programming is not currently a
traditional Leaving Certificate subject, there are no formal indicators of
a student’s previous performance available at an early stage to enable
the introduction of appropriate interventions. This often renders
inter-ventions inadequate, as their introduction may be too late in the course
to make a significant difference.
Computer Science Education (CSEd) research is a relatively young
field of study (
≈
50
years). A number of models exist to identify
stu-dents at risk of dropping out or failing, however, most models are only
used for a brief period of time and are not developed further. This
was highlighted by a call from the ITiCSE ’
15
working group, which
identifies several grand challenges. One of the challenges asserts, that
while there are several studies in the literature that predict performance
or identify students at risk of not progressing, the studies are seldom
revalidated. In addition the models have not been employed in actual
interventions where if the findings were positive or of value, they could
then be put into practice. The working group also highlighted as a
sep-arate grand challenge, the critical need for re-validation of educational
data mining models. [
62
].
The development of a complete system that can predict struggling
students in a timely manner and act accordingly (using one or
multi-ple interventions), would make a significant contribution to the CSEd
community.
1
.
2
t h e s ta r t i n g p o i n t
-
p r e s s
1
.
2
t h e s ta r t i n g p o i n t
-
p r e s s
1
.
2
.
1
w h y p r e s s
?
Over twelve years ago, a detailed study on factors that influence success
in CS
1
was presented by Bergin at SIGCSE
05
, in St. Louis, Missouri,
USA [
17
]. Subsequently this led on to the development of a
compu-tational model that could predict student success with
77
.
5
% accuracy
(at a very early stage) in a CS
1
module, named PreSS (Predict Student
Success) [
16
,
18
].
PreSS was developed between
2003
and
2006
. It was composed of
three studies, one in each year. Multiple institutions at various tertiary
levels took part. Several investigations on factors that influence
suc-cess and on the development of machine learning models to predict
performance, were carried out with best practice techniques to improve
generalisation, (for example: data stratification,
10
fold cross validation
and performance measures). The PreSS model is described in detail in
Chapter
2
. This body of work is well regarded, having the
43
rd highest
cited publication in any of the ACM SIGCSE sponsored proceedings or
publications, from a total of
13
,
389
[
17
].
PreSS has since been successfully used locally, but the model required
paper-based data collection with manual processing and computation.
This time consuming process inhibited the uptake and usage of the
model on a large scale. A detailed review of other comparable models
and related literature on factors that influence success when learning to
program, is provided in chapter
2
. Given the high performance of PreSS
over several studies (with different student cohorts at different tertiary
levels) this model was selected for use in this thesis.
Bergin concluded her PhD thesis, with several suggested
recommen-dations for future work. The first recommendation was further research
1
.
2
t h e s ta r t i n g p o i n t
-
p r e s s
on programming predictors to try to improve the performance of the
PreSS model. The second recommendation was to refine the measure
of mathematical performance to make it more generalizable to
differ-ent studdiffer-ent cohorts. The third call was for the developmdiffer-ent of suitable
interventions so that once struggling students are identified, timely
in-terventions can be applied. Finally, gender was a strong point of
dis-cussion throughout the thesis, and although the dichotomous factor of
gender did not make it into the final model, it was believed that it was
of significant value. Bergin recommended that further investigation into
gender related factors, may lead to a deeper insight and value when
de-veloping PreSS further. Between
2006
and the start of this thesis, little
progress on these recommendations was made. This thesis describes a
substantial body of work to address each recommendation. The goals
are described in detail in Section
1
.
3
.
1
.
1
.
2
.
2
r e f e r e n c e t e r m s
As this work will be referenced throughout this thesis, to avoid any
confusion as to what work is being discussed, the following terms will
be applied:
Original PreSS Study
: This refers to the PhD thesis of Bergin, and the
development of the PreSS model within.
Original PreSS Model
: This refers to the final prediction model as
discussed in Bergin’s PhD thesis.
1
.
3
i n t r o d u c t i o n t o t h i s r e s e a r c h
1
.
3
i n t r o d u c t i o n t o t h i s r e s e a r c h
1
.
3
.
1
r e s e a r c h g oa l s
The research goals (RG) of this thesis are to:
1
.
Investigate if the original PreSS model, is still a valid prediction model a
decade after it was initially developed
2
.
Develop a web-based real time implementation of the original PreSS
model
3
.
Investigate if the original PreSS model can be improved upon using:
a)
New factors for the model
b)
Alternative machine learning algorithms for the model
4
.
Investigate insights on gender differences in CS
1
to further inform the
PreSS model and interventions
5
.
Develop and investigate interventions that could reduce attrition rates
in CS
1
1
.
3
.
2
e t h i c a l a p p r ova l
For all studies conducted in this thesis, ethical approval was sought
and granted by Maynooth University. Due to the nature of the data
collected (grades, psychometric, demographic), student and institution
anonymity was essential. For both ethical and participation reasons (as
many institutions cited this as a concern), the study was not a
compar-ison of specific institutions. All data was stored securely, anonymised,
using keys and only the person’s named on the ethical approval were
allowed access to the data.
1
.
3
i n t r o d u c t i o n t o t h i s r e s e a r c h
1
.
3
.
3
t h e s i s c o n t r i b u t i o n s
This thesis makes several fundamental contributions to these objectives
outlined in the research goals, as follows:
1
. The revalidation of the original PreSS model using a large multi-institutional
data set.
2
. The development of a web based real time system with PreSS at its core.
3
. The further development of PreSS with the identification of several new
factors and machine learning algorithms.
4
. The identification of several insights into gender differences in CS.
5
. The development of two interventions for reducing attrition rates in CS
1
.
Each of these contributions are discussed in the following section:
RG
1
: Revalidation of PreSS
The revalidation of PreSS was conducted by an initial justification study
(and following its positive findings), followed by a large study, referred
to in this thesis as the main study. Both are summarized in this section.
Justification Study:
Initially a small justification study was carried out
to examine if PreSS was still an accurate predictor of programming
suc-cess [
97
]. The study used two small independent data sets, collected
in the academic years
2013
-
14
and
2014
-
15
. The justification study
re-ported that PreSS was able to predict with a statistically similar accuracy
the original Press work that took place over a decade previously. [
97
].
Although these results were very promising, given the small sample
size and the fact that it only represented a single institution, a large
study was required to re-validate the model and to examine its
general-izability. The justification study is discussed in detail in Chapter
3
.
1
.
1
.
3
i n t r o d u c t i o n t o t h i s r e s e a r c h
Main Study:
A large scale multi-institutional revalidation study was
conducted in the academic year
2015
-
2016
. The study and its purpose
was multi faceted and in essence it was the core body of work in this
the-sis. In total,
692
complete student data sets were collected and used in
the main large scale study. This contribution provides evidence that the
PreSS model was still a valid model several years after it was developed
and is detailed in Chapter
3
.
2
.
RG
2
: Web Application: PreSS#
In
2015
the PreSS model was developed into a web-based educational
system named PreSS# [
102
]. PreSS# is able to predict student success
in real time. The system is fully automated allowing institutions to
create users, run the prediction and examine outputs. To ensure PreSS#
was producing comparable results to that of PreSS, the original data
set was used for validation. Both PreSS and PreSS# produced the same
results, with no significant differences found [
102
], thus validating the
developed on-line system. PreSS# is discussed in detail in Chapter
4
.
RG
3
: Model Development
Investigating Additional Factors:
Research conducted in
2016
investi-gated additional factors that may increase the accuracy of PreSS. Two
data sources were examined: the first consisted of factors gathered
dur-ing the original PreSS study that were not used in the final model. The
second consisted of additional factors collected in the justification study.
The research successfully identified
16
factors that when used in
com-bination or substitution with the original PreSS factors either produced
significant increases in model performance or were otherwise worthy
1
.
3
i n t r o d u c t i o n t o t h i s r e s e a r c h
of note. The newly identified factors were then included as part of the
main study and investigated examining if the PreSS model could be
further improved using the multi-institutional large scale data set. This
piece of work found several factors that improved the PreSS model. This
research is presented in Chapter
5
.
Machine Learning Algorithms:
Using the main study data set, an
in-vestigation was conducted of multiple machine learning techniques to
predict performance to further improve the PreSS. A multitude of
al-gorithms were compared that include: naïve Bayes, logistic regression,
support vector machines, decision tree, k-nearest neighbour, single layer
artificial neural network, deep learning artificial neural network, and a
convolutional artificial neural network. This contribution reports an
increase in performance when using artificial neural networks, and in
particular deep learning, over the original PreSS algorithm, and is
dis-cussed in detail in Chapter
6
.
RG
4
: Insights on Gender Differences
In the original PreSS study, gender was found to have significance when
developing the model and it was noted that future work and a deeper
investigation may add prediction value to the model. Thus, using the
main data set, a comparative study was carried out in
2017
, comparing
the profile of male and female students enrolled on CS
1
, to determine if
any significant differences could be identified by gender. The findings
contributed to both the development of the PreSS model (RG
3
) and the
development of two interventions (RG
5
). This study is presented in
1
.
3
i n t r o d u c t i o n t o t h i s r e s e a r c h
RG
5
: Interventions
This section describes the development of two interventions. With the
PreSS model revalidated and further developed, the goal then shifted to
interventions to help improve student success in CS
1
. The main focus of
both interventions was to positively influence the main predictor of
suc-cess, programming self-efficacy, in the hope of improving programming
performance.
Scratch to improve self-efficacy and performance in CS
1
:
This study
investigated when students were exposed to Scratch, a block type
pro-gramming language, at the same time as their CS
1
module, which was
delivered using C#, would their programming self-efficacy increase (a
prominent factor identified in the original PreSS study and in this
the-sis). This study is presented in Chapter
8
.
1
.
Promoting a Growth Mindset, as an Intervention in CS
1
:
This study
was based on the work of Dweck [
46
], to promote a growth mindset
in an effort to increase performance in CS
1
. This intervention reported
a significant increase in performance over the previous control group
where no intervention was deployed and is presented in Chapter
8
.
2
.
1
.
3
i n t r o d u c t i o n t o t h i s r e s e a r c h
1
.
3
.
4
t h e s i s v i s ua l ov e r v i e w
This research is broken into five main sections as presented in Figure
1
.
1
.
This figure maps the research goals (RG) to the sections and chapters
in this thesis and provides a time-line of the research. It also illustrates
where the prior research finishes (vertical division).
Figure
1
.
1
: Visual Overview of Research
As a reference guide, the mappings of RG’s to chapters is provided in
Table
1
.
1
:
Table
1
.
1
: Reference guide for mapping RG’s to chapters.
Section
Research Goal
Chapter(s)
Revalidating the PreSS model
1
3
PreSS Web Application (PreSS#)
2
4
Improving the PreSS Model
3
5
,
6
Insights on Gender Differences
4
7
1
.
4
p u b l i c at i o n s
1
.
4
p u b l i c at i o n s
The publications that arose as a result of the research contained in this
thesis (which are freely accessible at
http://keithquille.com/Publications)
are as follows (peer-reviewed):
[1 0 1] Keith Quille and Susan Bergin. “CS1: how will they do? How can we help? A decade of research and practice”. In: Computer Science Education29.2-3 (2019), pp.254–282.doi:10.1080/08993408.2019.1612679. url:https://doi.org/10. 1080/08993408.2019.1612679
[1 0 4] Keith Quille et al. “Second Level Computer Science : The Irish K-12 Jour-ney Begins .” In: Proceedings of the18th Koli Calling International Conference on Computing Education Research (Koli Calling ’18). Koli, Finland ACM, 2018. doi: 10.1145/3279720.3279742
[1 0 0] Keith Quille and Susan Bergin. “Programming: Predicting Student Success Early in CS1. A Re-validation and Replication Study”. In: Proceedings of the
23rd Annual ACM Conference on Innovation and Technology in Computer Science Education. ITiCSE2018. Larnaca, Cyprus: ACM, 2018, pp. 15–20. isbn: 978-1 -4503-5707-4. doi: 10.1145/3197091.3197101. url: http://doi.acm.org/10. 1145/3197091.3197101
[1 0 3] Keith Quille, Natalie Culligan, and Susan Bergin. “Insights on Gender Differ-ences in CS1: A Multi-institutional, Multi-variate Study.” In: Proceedings of the
2017ACM Conference on Innovation and Technology in Computer Science Education. ITiCSE ’17. Bologna, Italy: ACM,2017, pp. 263–268. isbn: 978-1-4503-4704-4. doi: 10.1145/3059009.3059048. url: http://doi.acm.org/10.1145/3059009. 3059048
[9 8] Keith Quille and Susan Bergin. “Does Scratch improve self-efficacy and perfor-mance when learning to program in C#? An empirical study.” In: Proceedings of the International Conference on Enguaging Pedagogy (ICEP), Maynooth University, Maynooth, Ireland. 2016. url:http://www.keithquille.com/PublicationData/ ICEP2016.pdf
1
.
4
p u b l i c at i o n s
[9 9] Keith Quille and Susan Bergin. “Programming: Further Factors that Influence Success”. In: Proceedings of the Psychology of Programming Interest Group (PPIG),
7th to 10th Spetember, University of Cambridge. 2016. url: keithquille . com / PublicationData/ppig2016.pdf
[9 7] K Quille and S Bergin. “Programming: Factors that Influence Success Revisited and Expanded”. In:Proceedings of the International Conference on Enguaging Peda-gogy (ICEP),3rd and4th December, College of Computing Technology, Dublin, Ireland. 2015.url:http://www.keithquille.com/PublicationData/ICEP\_2015.pdf
[1 0 2] Keith Quille, Susan Bergin, and Aidan Mooney. “PreSS#, A Web-Based Educa-tional System to Predict Programming Performance”. In:International Journal of Computer Science and Software Engineering (IJCSSE)4.7(2015), pp.178–189. url: http://www.keithquille.com/PublicationData/PreSS.pdf
Contributed:
[1 1] Brett Becker and Keith Quille. “50 Years of CS1 at SIGCSE: A Review of the Evolution of Introductory Programming Education Research”. In: Proceedings of the 50th ACM Technical Symposium on Computer Science Education. SIGCSE ’19. New York, NY, USA: ACM,2019. doi: 10.1145/3287324.3287432. url:
http://doi.acm.org/10.1145/3287324.3287432
[3 5] Natalie Culligan, Keith Quille, and Susan Bergin. “VEAP: A Visualisation En-gine and Analyzer for PreSS#”. In: Proceedings of the16th Koli Calling Interna-tional Conference on Computing Education Research. Koli Calling ’16. Koli, Fin-land: ACM,2016, pp.130–134. isbn:978-1-4503-4770-9. doi:10.1145/2999541. 2999553. url: http://doi.acm.org/10.1145/2999541.2999553
[1 9] Susan Bergin et al. “Using Machine Learning Techniques to Predict Introduc-tory Programming Performance”. In: International Journal of Computer Science and Software Engineering4.12(2015), pp.323–328. issn: 2409-4285. url: http: //mural.maynoothuniversity.ie/8682/
2
L I T E R AT U R E R E V I E W
2
.
1
i n t r o d u c t i o nOver the years there has been a significant amount of research related to CS1and pre-dicting student success using varying techniques. The literature review only focuses on models/literature for predicting success on introductory programming modules (CS1), where this approach served three purposes. The first was to identify if a more suitable model to PreSS was developed since the original PreSS study in2006. Second was to investigate how models have been developed further/revalidated after their ini-tial work. Third was to detail the original PreSS model, to make familiar and describe the foundations for this thesis, and to compare PreSS to the findings of the literature review. For the literature review itself, PreSS is omitted, but is described in detail in Section2.3. The main findings of the literature review are presented in Table2.1. For this body of research including Research Goal4 and 5, a multitude of additional lit-erature was considered/reviewed, where these are presented in the relevant sections. Thus allowing the literature review to focus on the core of this thesis, investigating the current landscape of predicting success in CS1and the prediction model PreSS.
2
.
2
r e v i e w o f t h e l i t e r at u r e2
.
2
.
1
m e t h o d o l o g yAn approach that would ensure the identification of relevant research, given the large quantity available was required (some searches returned hits in excess of70,000 re-sults). Search terms were identified that included one or more of: predicting, predict, CS1, introductory programming, factors, ability, performance, success, failure and student. Combinations of these terms where then searched in the ACM and IEEE databases with some additional searching in Google Scholar. The search terms were examined in title, abstract and the body of publications.
2
.
2
r e v i e w o f t h e l i t e r at u r e
In the case of large search returns, the first200results were reviewed, where results were filtered on relevance to the search term. Where the search returned less than200 results, all the results were reviewed. In total1,884 articles were reviewed based on search terms appearing in the title, abstract and/or body. From there, articles were short listed, based on their relevance to CS, factors and/or prediction models. This resulted in 93articles (when repeating articles were removed due to being returned in multiple searches). After this a detailed analysis of each article and its relevance was conducted. Each of the 93articles were reviewed in full and were summarized under headings as defined later in this section. This process ensured that the articles were predicting and/or examining factors for CS1or other introductory programming courses (and not for example a business course). This final selection process resulted in49articles that were included in this literature review.
Ideally models to predict student’s performance in CS1would broadly display as many of the following criteria as possible: multi-institutional, longitudinal, large sam-ple size, high prediction accuracy, high sensitivity and early prediction. Many of these criteria were also highlighted in the ITiCSE working group report [62]. Almost all of the49articles examined, exhibited one or many (but not all) of these criteria and have been grouped and presented under these headings to give a sense of how the research available spans various criteria. Three of the articles did not satisfy any of the criteria [49,94,95]. Table2.1 presents the criteria per study, and in doing so helps visualize what studies have met more than one criteria, and how the criteria overlap.
2
.
2
.
2
m u lt i-i n s t i t u t i o na lTo create a generalizable prediction model, it would need to be tested over several institutions, preferably in diverse districts or even countries. From the 49 articles examined, only two studies were conducted in more than a single institution [23, 122]. A study by Bornat, Dehnadi and Simon [23] revisited a predictor of CS1success, developed by Dehnadi in 2006[40]. Bornat et al., conducted this revalidation study of Dehnadi’s predictor of programming success across six institutions. The study reported that the predictor failed to produce a strong prediction when validated across six institutions. Simon et al. [122] conducted a study across11institutions (n =177), exploring issues that influence success in learning to program, using four diagnostic tasks. The study reported findings and general correlations (without reporting the actual values). The study pointed out the challenges and costs associated with a multi-institutional study, and perhaps this is the reason for an average participation
2
.
2
r e v i e w o f t h e l i t e r at u r e
2
.
2
.
3
l o n g i t u d i na lStudies are often conducted once, on a single cohort. Given that CS is a constantly evolving area, studies should be repeated over several years, to examine if they stand the test of time. The literature review found that only eight studies were conducted over more than one year or semester [3,26,48,57, 74, 135,143]. This is concerning, if several prediction models exhibit a strong prediction accuracy and value to the CSEd community, why were they never revalidated? No study that was longitudinal involved more than one institution.
2
.
2
.
4
g e n e r a l i z a b l e s a m p l e s i z eTo test a prediction model, a reasonable sample size is required. A small sample size can be acceptable if it represents the entire population. As the goal of this model is to generalize across institutions and countries (large populations > 5000 [33]), a 10% acceptable margin of error was selected as the boundary value for the minimum generalizable sample size [33, 86]. This resulted in a minimum sample size of 96 students. Several studies involved relatively small samples sizes, (n< 96) where some did not include the sample size at all. This may pose problems with over-fitting. Some models in an effort to combat the small sample size, while trying to minimise over-fitting (a common problem with small data sets), used methods like bootstrapping. In several studies that had a large sample size, there was no model, just correlations reported. These have value, but unless they are developed into a final model, may not serve practitioners in a useful immediate way. A positive finding was that 35of the articles reported a sample size greater than96students [3,4,8,9,12,13,15,23,26,28, 30,34,42,48,57,60,67,71,73–76,88,109,110,118,122,131,135,136,141–144,147]. A positive note from this was that all studies that were longitudinal also included a generalizable sample size.
2
.
2
.
5
p r e d i c t i o n a c c u r a c ySeveral of the articles, reported no significant prediction accuracies or correlations. This was also concerning, as this whittled the list down considerably. A prediction slightly higher than that of chance was selected as a search criteria. A similar corre-lation coefficient was selected so not to rule out this research. Ten articles reported
2
.
2
r e v i e w o f t h e l i t e r at u r e
significant prediction accuracies, although some did not predict early in CS1 [3, 22, 40,57,72,74,136,138,143,146]. All articles irrespective of time of prediction, were included in the literature review as they may give insight, into factors not considered in this research. Only four studies that were both longitudinal and included generaliz-able sample sizes, produced a significant prediction accuracy, which included: [3,57, 74,143].
2
.
2
.
6
p r e d i c t i o n t i m i n gIn addition to prediction accuracy, prediction timing examined the point in the course the prediction could be made. The ideal timing is the earliest possible point into CS1, thus allowing educators to implement interventions in a timely manor.
Early in CS1
The limit for this sub group of articles was less than approximately25% of the module completion, with20articles meeting this criteria [3,4,9,23,28–30,40,42,57,58,60, 74–76,96,109,110,118,122].
Throughout CS1
Some models made predictions at multiple stages throughout CS1, with varying levels of prediction accuracy at each stage [12,45,48,63,71,106,131,135,138,141,143] Prior to CS1
A very positive finding in the literature is that some models were able to predict before the commencement of CS1. [26,52,57,67]
The four studies that met all of the criteria (excluding multi-institutional) that could predict in a timely manner are: Ahadi, Glorfeld, Liao and Wiig [3,57,74,143].
2
.
2
.
7
p r e d i c t i o n s e n s i t i v i t y & s p e c i f i c i t yPrediction models are often presented with a high accuracy, but that alone does not always reveal the entire story of the model. If sensitivity and specificity are not pre-sented and identified, two concerns can be raised. First, a biased model could have been constructed. For example, if90% of the students in a study were strong (high per-forming), the model could predict every student as strong and report an accuracy of 90%. This model presents as very successful, but its ability to identify weak students (the model’s main goal) would in-fact be0% as it predicted every student as strong, thus the10% of students that are weak, were incorrectly identified. Second, the
accu-2
.
2
r e v i e w o f t h e l i t e r at u r e
racy does not present outcomes for a particular class, therefore making appraisals of models that aim to predict students who are struggling, masked when the study only presents accuracy. This measurement of sensitivity and specificity, was only reported in three studies (in some cases indirectly, but it could be calculated) [22,57,74]. Only two studies remained that met all of the criteria (excluding multi-institutional) that also reported sensitivity and specificity: Glorfeld and Liao [57,74].
2
.
2
.
8
r e va l i d at e d p r e d i c t i o n m o d e l sFrom the literature it appears that models are rarely revisited. In all of the literature re-viewed, only two instances where the work was revisited presented themselves (some of the authors were even emailed directly to confirm if this was the case, if the article stated a possible follow up study).
Dehnadi
In2006, Dehnadi developed a prediction model, that reported a100% accuracy (100% sensitivity and specificity) [40]. This work seemed to have made a breakthrough. It was disclosed at the the PPIG (Psychology of Programming Interest Group) workshop in2006. Dehnadi built a "mental model" that could predict success with100% accuracy (n = 60students). Based on this reported accuracy, two follow up studies were com-pleted. In2007, Caspersen repeated the study using approximately142students [30]. It should be noted at this point that Dehnadi completed the study in the UK, whereas Caspersen conducted the study in Denmark. The findings of Caspersen’s work is best described in the abstract: "We have repeated their test in our local context in order to verify and perhaps generalise their findings, but we could not show that the test predicts students success in our introductory programming course". Subsequently, a study by Bornat in the following year (2008, co-authored by Dehnadi) examined six experiments, with more than500students, across six institutions and three countries [23]. Bornat reported that "the predictive effect of our test has failed to live up to that early promise" with performance, just higher than chance.
Glorfeld & Fowler
In1981, Glorfeld and Fowler, developed a predictive model using a sample size of151 students in a CS1 course [52]. The model was developed using three pools of data: personal, academic and aptitude. From this data a classification model was developed using the logistic discrimination model. The model produced an accuracy of80.8% and not only was the accuracy presented but also the sensitivity and specificity. For
2
.
3
t h e o r i g i na l p r e s s s t u d y a n d m o d e l
identifying weaker students the model was76.6% accurate. A year later Fowler and Glorfeld, revisited the study with a new cohort [57]. From the1040students enrolled in the CS1 course, 150 were randomly selected. The model still performed well, al-though the accuracy decreased (∼ 6%). This is perhaps to be expected when models are exposed to new data sets and being tested for generalizability. Glorfeld and Fowler reported that: "The validation study showed that the model would have a predictive accuracy of approximately75% in actual application".
The most significant model following the Literature review was developed by Glo-rfeld and Fowler [52], but as outlined in the following section PreSS performs at a comparably high or higher level and is therefore a good choice of model for further development.
2
.
3
t h e o r i g i na l p r e s s s t u d y a n d m o d e lPreSS was developed between2002and 2006based on three studies (a pilot study, a main study and an epilogue study) with four participating institutions, n= 184 [16– 18]. These institutions consisted of a University, two Institutes of Technology, and a Community College, thus spanning all levels of Higher Education, from the National Framework of Qualifications (NFQ) level5 to level8. The pilot study recorded data using a questionnaire, which in turn lead to the development of the instruments that were used in the main study. The main study recorded a substantial amount of data from 102 students during the academic year of2004-2005. Four paper-based instru-ments were used to collect the data in the main study: a background questionnaire, a programming self-esteem questionnaire, a self-efficacy questionnaire and a motivation and learning strategies questionnaire [16,17]. An epilogue study with21participating students was also conducted after the main study and was used in further analysis and validation of findings from the main study.
2
.
3
.
1
f a c t o r s e l e c t i o nIn the original PreSS study 25factors were examined, using four instruments. The original PreSS study used multiple statistical techniques in the development of the prediction model. Stratification was used as the initial step to ensure that all the data was in a homogeneous state. Initially, the original PreSS study examined over 40 logistic regression models using combinations of the25 factors on the data from the
2
.
3
t h e o r i g i na l p r e s s s t u d y a n d m o d e l
main study1
. This prediction model used three factors: programming self-esteem 2 , mathematical ability (based on a high school mathematics exit examination) and the number of hours per week that a student plays computer games. The programming self-esteem and mathematical performance were found to have a positive relationship with performance while the number of hours a student plays computer games was found to have a negative effect.
2
.
3
.
2
d ata p r e p r o c e s s i n gThe pre-processed programming self-esteem data consisted of ten questions and was based on the Rosenberg self-esteem questionnaire but modified to reflect a student’s perception of their programming ability [107]. Cronbach alpha values were calculated to compare the internal consistency of the self-esteem questionnaire and were found to be comparable with the Rosenberg self-esteem questionnaire (AppendixA.1). Prin-ciple Component Analysis (PCA) was used to reduce the programming self-esteem questionnaire that consisted of multiple data points to one value which accounted for as much of the variance in the multiple data points as possible (AppendixA.1).
2
.
3
.
3
m a c h i n e l e a r n i n g a l g o r i t h mSix machine learning algorithms were examined in the development of PreSS: logistic regression, k-nearest neighbour, backpropagation (single layer artificial neural net-work), C4.5 (decision tree), SVMs (support vector machine) and naïve Bayes. Naïve Bayes was selected as it was found to have the highest prediction accuracy. As naïve Bayes is used extensively throughout this paper a detailed description of the machine learning algorithm can be found in Section6.3.4.
1 This resulted in a single prediction model that produces the highest measurement of programming performance.
2 With respect to programming self-esteem, it should be noted that there are several related terms used within this space and their boundaries are sometimes unclear. These terms have included (from the literature): programming self-esteem, CS con-fidence, programming self-efficacy, and programming self-confidence. At the time of Bergin’s work this physiological phenomena was referred to as programming esteem, whereas nowadays its more often than not referred to as programming self-efficacy, with both terms referring to the same physiological phenomena. As the original PreSS study published it as programming self-esteem it will be referenced as this, if referring to the original PreSS study, while in all other cases the term will be referred to as programming self-efficacy.
2
.
3
t h e o r i g i na l p r e s s s t u d y a n d m o d e l
2
.
3
.
4
p e r f o r m a n c e m e a s u r e sFor the development of the PreSS model, ten-fold cross validation was implemented to obtain a prediction accuracy. This is a best practice method to avoid over fitting [148] with machine learning algorithms. This method is far superior to a hold-out method as it uses every sample in a data set for both testing and training. A detailed description of this technique is presented in AppendixA.2.
Accuracy, sensitivity and specificity were recorded for each prediction. These recordings were calculated based on the following variables: true positive rate (TP - the correct identification of a weak student), true negative rate (TN - the correct identification of a strong student), false positive rate (FP - type I error) and the false negative rate (FN - type II error). As the overall priority of PreSS is to identify weak students, sensitivity was the main focus. Thus sensitivity in this thesis, was the mea-sure of performance of the model to predict students at risk of failing or dropping out, and specificity was the measure of performance of the model to predict students who would pass or be successful. All three measurements were recorded and presented for every prediction in this study. A detailed description and the formula for each measure is presented in AppendixA.3.
2
.
3
.
5
r e s u lt s a n d p e r f o r m a n c ePreSS was able to achieve an accuracy of77.5% [16] in the main study, with n =102. In fact using a variation of factors, higher performance could be achieved for a specific sample set, for example, by gender or per institution, however Bergin’s goal was to produce the most generic model possible to maximise generalizability. The sensitivity achieved by PreSS (predicting students whom are at risk of failing or dropping out) was78%.