1 Current Bioinformatics, 2012, 7, 00-00
1574-8936/12 $58.00+.00 © 2012 Bentham Science Publishers
A Filter Based Feature Selection Algorithm Using Null Space of
Covariance Matrix for DNA Microarray Gene Expression Data
Alok Sharma*
,1,2, Seiya Imoto
1and Satoru Miyano
1 1Laboratory of DNA Information Analysis, Human Genome Center, University of Tokyo, Japan; 2School of Engineering & Physics, University of the South Pacific
Abstract: We propose a new filter based feature selection algorithm for classification based on DNA microarray gene expression data. It utilizes null space of covariance matrix for feature selection. The algorithm can perform bulk reduction of features (genes) while maintaining the quality information in the reduced subset of features for discriminative purpose. Thus, it can be used as a pre-processing step for other feature selection algorithms. The algorithm does not assume statistical independency among the features. The algorithm shows promising classification accuracy when compared with other existing techniques on several DNA microarray gene expression datasets.
Keywords: Filter based method, feature or gene selection, cancer classification, null space, covariance matrix, DNA microarray gene expression data.
INTRODUCTION
The advent of microarray technology has enabled the researchers to rapidly measure the expression levels of thousands of genes in a biological tissue sample in a single experiment [1]. One important application of this microarray technology is to classify the tissue samples, especially cancer cells, using their gene expression profiles as one of the several classes (or subclasses). Compared with the standard histopathological tests in cancer diagnosis, the gene expression profiles measured through microarray technology provide accurate, reliable and objective cancer classification; it is possible to uncover cancer subclasses that are related with the efficacy of anti-cancer drugs that are hard to be predicted by pathological tests. The study of identification of genes characterizing heterogeneity of human cancers plays crucial role in modern day bio-medical sciences.
The microarray gene expression data for cancer classification consists of large number of genes (dimensions) compared to the number of samples to be classified. Not all the features contribute affirmatively to a given task. In fact in some cases it degrades the generalization performance of the classifier and increases its computational complexity. If the dimensionality of feature vectors is very large then the selection of features is not reachable in a reasonable amount of time even using high performance computers. Therefore, it is essential to discard non informative features for a given task in a reasonable amount of time. In order to identify informative genes, several feature selection algorithms have been proposed in the literature [2]-[12]. These algorithms can be broadly classified in to two main categories namely filter based methods and wrapper based methods[13]. The filter based methods are computationally faster and are
*Address correspondence to this author at the Laboratory of DNA Information Analysis, Human Genome Center, University of Tokyo, Japan; Tel: +81-3-5449-5615; Fax:+81-3-5449-5442;
E-mail: [email protected]
independent of the classifiers. On the other hand, the wrapper based methods are computationally intensive and are dependent on classifiers. Most of these feature selection algorithms investigate the importance of individual features in conjunction with the information attained from the combination of other features. The principal component analysis (PCA) technique which is a popular dimensionality reduction technique is also used for feature selection of gene expression data [14], [15]. In the PCA technique, the range space information of covariance matrix is utilized for feature selection. The null space of covariance matrix is discarded. Although, the null space of covariance matrix (or total scatter matrix) contains no discriminative information and has been discarded in the discriminant techniques [16] and PCA technique [14], [15], we utilize the null space of covariance matrix for gene selection and show that it can help in discarding non-informative features. The objective is to develop a filter based feature selection algorithm that can provide high classification performance on DNA microarray gene expression datasets. The proposed feature selection algorithm associates some scoring to the individual genes. The genes with the lowest scores are to be discarded. The algorithm is computationally efficient; i.e., its computational complexity is (where is the dimension of feature vectors and is the number of samples). The algorithm identifies weak or low important genes and therefore it can be used as a pre-processing step for other feature selection algorithms. The algorithm does not assume statistical independencies among the features as assumed in naïve Bayes’ classifiers [17].
PROPOSED GENE SELECTION ALGORITHM
In this work we utilize the null space of covariance matrix to select genes which is discarded in discriminant techniques [16] and PCA technique [14], [15]. In this section, we show that it can still be utilized to discard
non-informative genes which would help in the classification task. In order to define the algorithm, we first denote the notations used. Let be a set of n training vectors in a d-dimensional feature space. Let μ be the centroid ofand A be the rectangular matrix defined as
(1) The covariance of can be given by
(2) Let the rank of or be . The singular value decomposition (SVD) procedure on matrix can be used to compute eigenvalues and eigenvectors of , this will give
(3) Let , where orthogonal matrix
corresponds to the range space of and orthogonal matrix corresponds to the null space of . Let be any vector in then
(4) In practice the vector can be economically obtained by performing Gram-Schmidt orthogonalization procedure on the column vectors of to get the th basis vector. It can be observed from equation 4 that the variance of feature vectors in the null space is zero. Therefore, the projected feature vectors on the null space can be given by
, where (5)
If we define , and as features of , and respectively then we can write equation 5 as
(6) Let and if is arranged in descending order such that
then -th feature can be discarded for which as it is not providing any significant contribution in making the summation zero (in equation 6). The value of which is close to zero, imply that th gene is non-informative or has little information and shall be discarded. An illustration is given in Figure 1, which shows the curve of as a function of .
In the figure the bottom features are discarded for which their values are small. The optimum value of can be determined by applying cross-validation procedure. We can also roughly determine the value of by taking the argument of median of , this will retain approximately 50% of the features. In the experiment section we will show that the reduction of more than 50% of features can be achieved without any degradation in the performance (in terms of classification accuracy) on a number of gene expression datasets. The algorithm is summarized in Table 1. Since the algorithm requires an ortho normal vector in the null space of covariance matrix, the computation of range space ortho normal vectors is required. Therefore, the computational complexity of the algorithm is .
Table 1. Feature selection algorithm.
Step 1. Compute matrix from equation 1.
Step 2. Find orthogonormal vector that corresponds to the null space of .
Step 3. Compute and arrange in descending order.
Step 4. Select the top features.
EXPERIMENTATION
In order to verify the performance of the proposed feature selection algorithm, we use four DNA microarray gene expression datasets. The description of these datasets is given as follows:
1 10 20 ... ... ... d
0
k
A Filter Based Feature Selection Algorithm Using Null Space Current Bioinformatics, 2012, Vol. 7, No. 3 3
Acute Leukemia dataset [18]: this dataset consists of DNA microarray gene expression data of human acute leukemias for cancer classification. Two types of acute leukemias data are provided for classification namely acute lymphoblastic leukemia (ALL) and acute myeloid leukemia (AML). The dataset is subdivided into 38 training samples and 34 test samples. The training set consists of 38 bone marrow samples (27 ALL and 11 AML) over 7129 probes. The test set consists of 34 samples with 20 ALL and 14 AML, prepared under different experimental conditions. All the samples have 7129 dimensions and all are numeric.
SRBCT dataset [19]: the small round blue-cell tumor dataset consists of 83 samples with each having 2308 genes. This is a four class classification problem. The tumors are
Burkitt lymphoma (BL), the Ewing family of tumors (EWS),
neuroblastoma (NB) and rhabdomyosarcoma (RMS). There are 63 samples for training and 20 samples for testing. The training set consists of 8, 23, 12 and 20 samples of BL, EWS, NB and RMS respectively. The test set consists of 3, 6, 6 and 5 samples of BL, EWS, NB and RMS respectively.
MLL Leukemia dataset [20]: this dataset has 3 classes namely ALL, MLL and AML leukemia. The training set contains 57 leukemia samples (20 ALL, 17 MLL and 20 AML) whereas the test set contains 15 samples (4 ALL, 3 MLL and 8 AML). The dimension of MLL dataset is 12582.
Lung Dataset [21]: this dataset contains gene expression levels of malignantmesothelioma (MPM) and adenocarcinoma (ADCA) of the lung. There are 181 tissue samples (31 MPM and 150 ADCA). The training set contains 32 of them, 16 MPM and 16 ADCA. The rest of 149 samples are used for testing. Each sample is described by 12533 genes.
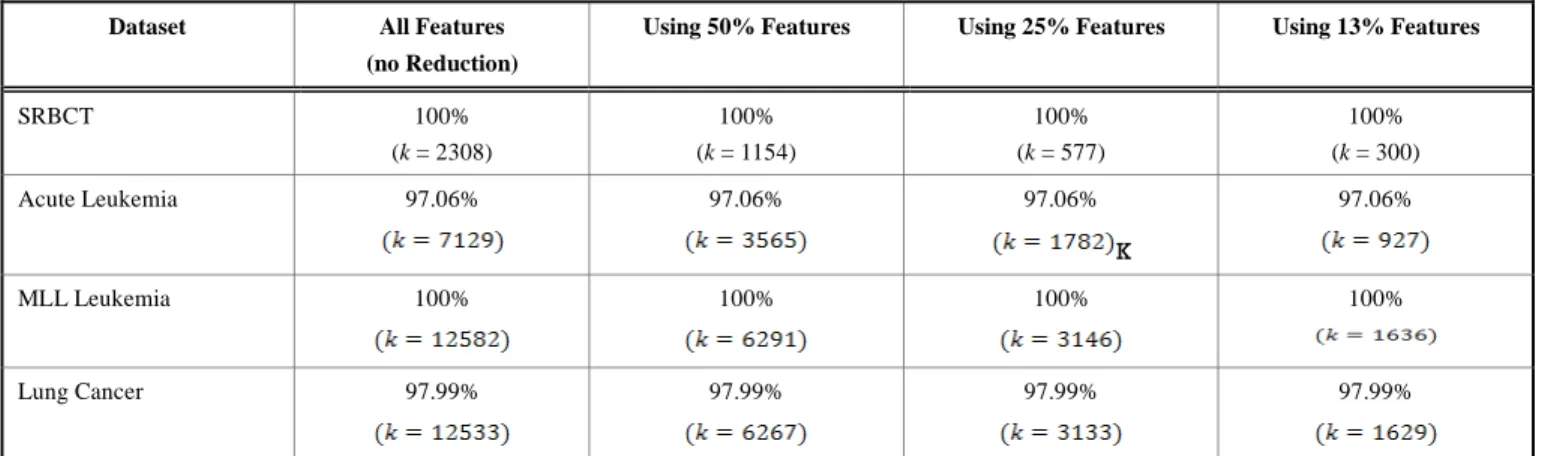
In this experiment, first we measure the performance (in terms of classification accuracy) without reducing the features. Then we reduce the feature numbers using the proposed feature selection algorithm. In the three set of experiments we retain 50%, 25% and 13% of features and evaluate their performance. The null LDA algorithm[22]with nearest neighbor classifier is used as a classifier. Table 2 shows the performance of the proposed algorithm.
It can be observed from Table 2 that the classification accuracy obtained by the classifier on original featuresize and the selected feature set is the same. This shows that the proposed algorithm is capable of removing a major portion of unimportant features. Once the feature size is reduced then other feature selection algorithms can be used to obtain important features further. In order to demonstrate this, we utilize support vector machine (SVM) for feature selection and Random Forest (RF) for classification from Weka environment [23]. First we select 100 features using SVM from the original feature space and then apply RF classifier to evaluate the classification accuracy on each of the datasets. Next, we apply the filter based methods to reduce features to 13% of the original feature size. From this subset we select 100 features by applying SVM and then RF is used to measure the classification accuracy. The following filter based methods are used for comparison: Chi-Squared, Gain Ratio, Info Gain, t-Statistics and OneR. The comparison is depicted in Table 3.
It can be observed from Table 3 that the classification accuracy obtained by the proposed algorithm is competent with other algorithms. In comparison with SVM algorithm (which was conducted on the original feature space) it can be seen that the classification accuracy of the proposed algorithm was either same (for SRBCT and MLL Leukemia) or improved (for Acute Leukemia and Lung Cancer); i.e., it discards the unimportant genes which are deteriorating or not helping in the classification task.
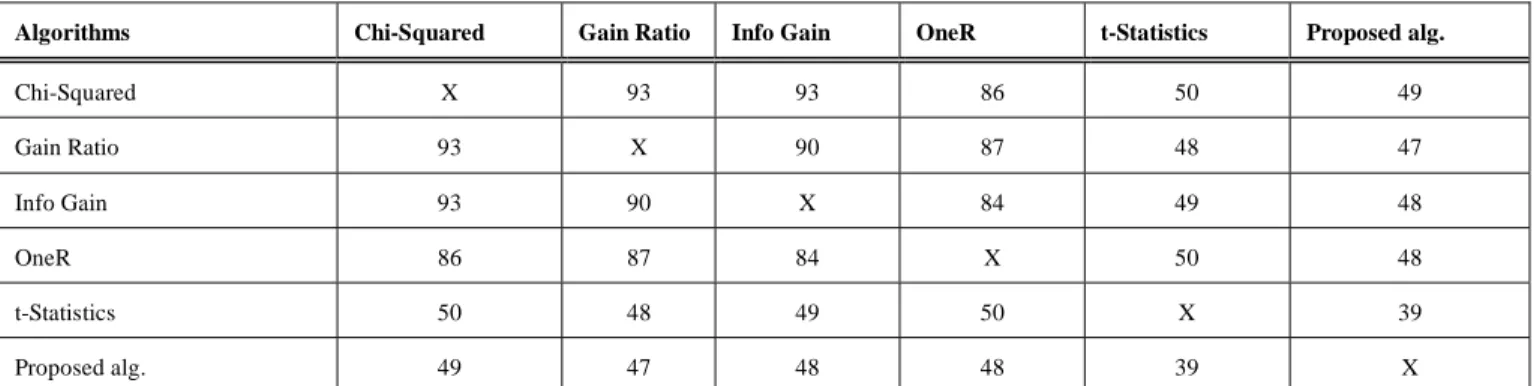
To analyze the difference of filter based methods (used in Table 3) in terms of the number of common genes, we utilize Lung Cancer dataset as a prototype and apply the selected 100 genes (which were used to obtain the classification accuracy of Lung Cancer data in Table 3). The number of common genes among the filter based methods is depicted in Table 4. The higher value of common genes in Table 4 implies similarity between the compared two algorithms. For an instance, the number of genes selected by Chi-Squared is very much similar to Gain Ratio and Info Gain algorithms. It can also be seen that t-Statistics and the proposed algorithm produce quite different genes. Therefore, they are dissimilar compared to other filter based methods used. This shows that
Table 2. Performance in terms of classification accuracy on the original feature set and on the selected feature set using the proposed algorithm. Classification accuracies are depicted in percentage and the number of features selected is shown in parenthesis.
Dataset All Features
(no Reduction)
Using 50% Features Using 25% Features Using 13% Features
SRBCT 100% (k = 2308) 100% (k = 1154) 100% (k = 577) 100% (k = 300) Acute Leukemia 97.06% 97.06% 97.06% K 97.06% MLL Leukemia 100% 100% 100% 100% Lung Cancer 97.99% 97.99% 97.99% 97.99%
the proposed algorithm can be applied with other feature selection methods to extract more information.
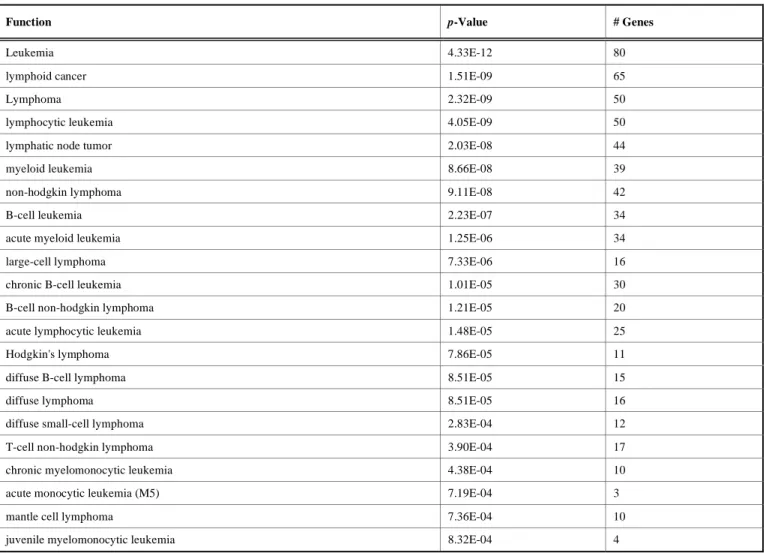
In the next part of the experiment, we explore the biological significance of the selected features from the proposed algorithm. In order to find the biological significance, we analyze the functional properties of the selected features using Ingenuity Pathway Analysis (IPA, http://www.Ingenuity.com). We use MLL Leukemia data as a prototype for this purpose. In this case, first 13% features are selected using the proposed algorithm and then IPA system is used to find its functional properties. Several significant high-level biological functions are obtained using the selected features. The top 5 high-level functions are depicted in Figure 2. The y-axis shows the negative logarithm of -values and x-axis shows the biological functions. The biological function of interest is cancer; under this function 120 significant cancer functions are obtained. Some of the selected cancer functions with their corresponding -values are summarized in Table 5. It can be seen from Table 5 that significant biological functions can be identified using the selected features from the proposed algorithm.
It can be concluded from the experiments that the proposed algorithm discards several unimportant features and retains useful features.
Fig. (2). Top 5 high-level biological functions using the selected features by the proposed algorithm on MLL Leukemia dataset.
CONCLUSION
A new filter based feature selection algorithm for DNA microarray gene expression data has been proposed which discards unimportant features from the large set of features. The proposed algorithm utilizes null space of covariance matrix to discard unimportant features. It does not assume the independency among the features. It is observed in the experiments that the algorithm efficiently reduces major portion of features without degrading the classification performance for several DNA microarray gene expression datasets. The comparison with other filter based methods shows promising results.
Table 3. Comparison using classification accuracy on various algorithms.
Algorithm Acute LEUKEMIA
(Classification Accuracy) SRBCT (Classification Accuracy) MLL Leukemia (Classification Accuracy) Lung Cancer (Classification Accuracy) SVM + RF 88.24% 95.00% 100.00% 95.97% Chi-Squared + SVM + RF 76.47% 80.00% 100.00% 96.64% GainRatio + SVM + RF 76.47% 95.00% 100.00% 98.66% InfoGain + SVM + RF 94.12% 90.00% 100.00% 94.63% t-Statistics + SVM + RF 85.29% 70.00% 100.00% 95.30% OneR + SVM + RF 88.24% 95.00% 86.67% 93.96% Proposed algorithm + SVM+RF 97.06% 95.00% 100.00% 97.32%
Table 4: Common genes in different algorithms
Algorithms Chi-Squared Gain Ratio Info Gain OneR t-Statistics Proposed alg.
Chi-Squared X 93 93 86 50 49 Gain Ratio 93 X 90 87 48 47 Info Gain 93 90 X 84 49 48 OneR 86 87 84 X 50 48 t-Statistics 50 48 49 50 X 39 Proposed alg. 49 47 48 48 39 X
A Filter Based Feature Selection Algorithm Using Null Space Current Bioinformatics, 2012, Vol. 7, No. 3 5
CONFLICT OF INTEREST
None declared.
ACKNOWLEDGMENT
This work was partly supported by Grant-in-Aid for JSPS Fellows (22-00364).
REFERENCE
[1] Schena M, Shalon D, Davis RW, Brown PO. Quantitative monitoring of gene expression patterns with a complementary DNA microarray. Science 1995; 270: 467-470.
[2] Kittler J.Feature Set Search Algorithms.In: Chen CH, Ed., Pattern Recognition and Signal Processing, Sijthoff and Noordhoff, Alphen aan den Rijn, Netherlands, 1978; pp. 41-60.
[3] Ben-Bassat M. Pattern recognition and reduction of dimensionality. In Krishnaiah P, Kanal L, Eds., Handbook of Statistics II, Vol. 1. North-Holland, Amsterdam.1982; pp. 773-791.
[4] Skalak D. Prototype and feature selection by sampling and random mutation hill climbing algorithms. In Proceedings of the Eleventh Int. Conf. on Mach. Learn. 1994; 293-301.
[5] Koller D, Sahami M. Toward optimal feature selection. In Proceedings of the Thirteenth Int. Conf. on Mach. Learn., Bari, Italy 1996; pp. 284-292.
[6] Guyon I, Weston J, Barnhill S, Vapnik V. Gene selection for cancer classification using support vector machines. Mach Learn 2002; 46: 389-422.
[7] Yu L, Liu H. Efficient feature selection via analysis of relevance and redundancy. J Mach Learn Res 2004; 5: 1205-1224.
[8] Jafari P, Azuaje F. An assessment of recently published gene expression data analyses: reporting experimental design and statistical factors. BMC Med Inform Decision Making 2006; 6: 27. [9] Mamitsuka H. Selecting features in microarray classification using
ROC curves. Patt Recog 2006; 39: 2393-2404.
[10] SharmaA, Koh CH, Imoto S, Miyano S. Strategy of finding optimal number of features on gene expression data. Electro Lett IEE 2011; 47(8): 480-482.
[11] Sharma A, Imoto S, Miyano S, Sharma V. Null space based feature selection method for gene expression data. Int J Mach Learn & Cyber 2011; DOI 10.1007/s13042-011-0061-9.
[12] Sharma A, Imoto S, Miyano S. A top-r feature selection algorithm for microarray gene expression data. IEEE/ACM Trans Comput Biol Bioinform 2012; 9 (3): 754-764.
[13] Saeys Y, InzaI, Larranaga P. A review of feature selection techniques in bioinformatics. Bioinformatics 2007; 23(9): 2507-2517.
[14] Alter O, Brown PO, Botstein D. Singular value decomposition for genome-wideexpression data processing and modeling. Proc Natl Acad Sci USA 2000; 97(18): 10101-10106.
[15] Tomfohr J, Lu J, Kepler TB. Pathway level analysis of gene expression using singular valuedecomposition. BMC Bioinformatics 2005; 6( 225).
[16] Huang R, Liu Q, Lu H, Ma S. Solving the Small Sample Size Problem of LDA.. Proc ICPR 2002; 3: 29-32.
[17] Duda RO, Hart PE. Pattern classification and scene analysis, Wiley, New York, 1973.
[18] Golub TR, Slonim DK, Tamayo P, et al. Molecular classification of cancer: class discovery and class prediction by gene expression monitoring. Science 1999; 286: 531-537. [Data Source: http://datam.i2r.a-star.edu.sg/datasets/krbd/]
Table 5. Cancer functions.
Function p-Value # Genes
Leukemia 4.33E-12 80
lymphoid cancer 1.51E-09 65
Lymphoma 2.32E-09 50
lymphocytic leukemia 4.05E-09 50
lymphatic node tumor 2.03E-08 44
myeloid leukemia 8.66E-08 39
non-hodgkin lymphoma 9.11E-08 42
B-cell leukemia 2.23E-07 34
acute myeloid leukemia 1.25E-06 34
large-cell lymphoma 7.33E-06 16
chronic B-cell leukemia 1.01E-05 30
B-cell non-hodgkin lymphoma 1.21E-05 20
acute lymphocytic leukemia 1.48E-05 25
Hodgkin's lymphoma 7.86E-05 11
diffuse B-cell lymphoma 8.51E-05 15
diffuse lymphoma 8.51E-05 16
diffuse small-cell lymphoma 2.83E-04 12
T-cell non-hodgkin lymphoma 3.90E-04 17
chronic myelomonocytic leukemia 4.38E-04 10
acute monocytic leukemia (M5) 7.19E-04 3
mantle cell lymphoma 7.36E-04 10
[19] Khan J, Wei JS, Ringner M, et al. Classification and diagnostic prediction of cancers using gene expression profiling and artificial neural network. Nat Med 2001; 7: 673-679. [Data Source: http://research.nhgri.nih.gov/microarray/Supplement/]
[20] Armstrong SA, Staunton JE, Silverman LB, et al. MLL translocations specify a distinct gene expression profile that distinguishes a unique leukemia. Nat Genet 2002; 30: 41-47. [Data Source1: http://datam.i2r.a-star.edu.sg/datasets/krbd/] [Data Source2: http://www.broad.mit.edu/cgi-bin/cancer/publications/pub_paper.cgi?mode=view&paper_id=63] [21] Gordon GJ, Jensen RV, Hsiao L-L, et al. Translation of
microarray data into clinically relevant cancer diagnostic tests
using gene expression ratios in lung cancer and mesothelioma. Cancer Res 2002; 62: 4963-4967. [Data Source1: http://datam.i2r.a-star.edu.sg/datasets/krbd/] [Data Source 2: http://www.chestsurg.org]
[22] Chen L-F, Liao H-YM, Ko M-T, Lin J-C, Yu G-J. A new LDA-based face recognition system which can solve the small sample size problem. Patt Recog 2000; 33: 1713-1726.
[23] Witten IH, Frank E. Data mining: practical machine learning tools with java implementations, Morgan Kaufmann, San Francisco, CA, 2000.http:/www.cs.waikato.ac.nz/ml/weka/