ABSTRACT
Background: several prognostic systems have been develo-ped and validated in general Intensive Care Units (ICUs). No as-sessment of these scores was performed in specialized Gastroen-terology Intensive Care Units (GICUs).
Aim: to assess the prognostic accuracy of Acute Physiology and Chronic Health Evaluation (APACHE) II, Simplified Acute Physiology Score (SAPS) II and Sequential Organ Failure Assess-ment (SOFA) scores systems to predict mortality in a GICU.
Methods:retrospective study of 300 consecutively admissions in a GICU. Demographics, indication for admission, APACHE II, SAPS II and SOFA scores and survival at GICU discharge were re-corded. Discrimination was evaluated using receiver operations characteristic (ROC) curves and area under a ROC curve (AUC). Calibration was estimated using the Hosmer-Lemeshow good-ness-of-fit test.
Results: overall GICU mortality was 5.3%. APACHE II, SAPS II and SOFA mean scores of nonsurvivors (21.9, 46.2 and 9.3, respectively) were found to be significantly higher than those of survivors (11.9, 26.7 and 2.2, respectively) (p < 0.001). Discri-mination was excellent for all the prognostic systems, with AUC = 0.900, 0.903 and 0.965 for APACHE II, SAPS II and SOFA, res-pectively. Similarly, APACHE II, SAPS II and SOFA scores achie-ved good calibration, with p = 0.671, 0.928 and 0.775,
respecti-vely. Among the three scores, SOFA showed the best
performance, with overall correctness of prediction of 94.0%, while it was 86.2% for APACHE II and 82.7% for SAPS II.
Conclusions:in GICU, APACHE II, SAPS II and SOFA res have excellent prognostic accuracy and, among the three sco-res, SOFA has the greatest overall correctness of prediction.
Key words:Gastroenterology Intensive Care Unit, APACHE II, SAPS II, SOFA, prognostic scores.
INTRODUCTION
Several predictive scoring systems have been deve-loped and validated in general Intensive Care Unit (ICU) populations to evaluate the severity of illness and prognosis (1-6). However, to our knowledge, no re-ports are available on validation of these prognostic models in specialized Gastroenterology Intensive Care Units (GICUs).
Prognostic models can also be used for comparison and quality assessment between different ICUs and wit-hin the same ICU over time (7,8), for audit and clinical research (9), as well for evaluating therapeutic effective-ness and guiding communication between clinicians and families (10-12).
There are two main categories of general prognostic models)first, those evaluating the severity of illness, na-mely Acute Physiology and Chronic Health Evaluation (APACHE) II (13) and Simplified Acute Physiology Sco-re (SAPS) II (14); secondly, models quantifying organ dysfunction and failure, of which the most used is the Se-quential Organ Failure Assessment (SOFA) (6,15). Most prognostic models evaluate survival on discharge from ICU, using data collected within the first 24h in ICU (1-4,16,17).
The aim of this study was to assess the prognostic accuracy of APACHE II, SAPS II and SOFA scores systems in predicting mortality of patients admitted to a GICU.
Prognostic Scores in a Gastroenterology Intensive Care Unit
P. Freire, J. M. Romãozinho, P. Amaro, M. Ferreira and C. Sofia
Department of Gastroenterology, Coimbra University Hospital. Coimbra, Portugal
Received:14-05-10.
Accepted:20-07-10.
Correspondence:Paulo André Vinagreiro Freire. Department of Gastroente-rology, Coimbra University Hospital. Av. Bissaya Barreto - Praceta Prof. Mota Pinto- 3000-075 Coimbra, Portugal. e-mail: [email protected]
Freire P, Romãozinho JM, Amaro P, Ferreira M, Sofia C. Prog-nostic Scores in a Gastroenterology Intensive Care Unit. Rev Esp Enferm Dig 2010; 102: 596-601.
mortality rate was 5.3% (n = 16). Mean APACHE II, SAPS II and SOFA scores were significantly higher in nonsurvivors (Table II).
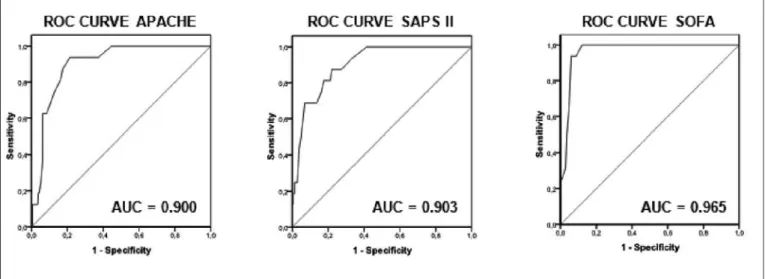
ROC curves and corresponding AUC are illustrated in Figure 1. The results of Hosmer-Lemeshow goodness-o-fit tests (χ2), the best Youden index and the resultant cut-off point are show in table III. The three scores had AUC > 0.90, i.e., they have a good discriminative ability. Addi-tionally, the test of model fit confirmed, for all the scores, that predicted mortality was similar to observed mortality
(good calibration).
To assess the prognostic value of the obtained cut-off points for predicting GICU mortality, the positive predic-tive value, negapredic-tive predicpredic-tive value, sensitivity, specifi-city and overall correctness of prediction were determi-ned (Table IV). GICU mortality rates above and below the cut-off points and the corresponding odds ratio for GICU mortality where detailed in table V.
DISCUSSION
Accurate prognostic indicators for patient survival in ICUs aid clinical decision, assist communication with families of patients and allow comparison between units (7,12,21).
The APACHE II, SAPS II and SOFA are ICU-specific prognostic scores widely used. Several past studies analyze the predictive abilities of these prognostic sys-Table I. Indication for GICU Admission
Primary GICU admission cause n (%)
Bleeding peptic ulcer 123 (41.0)
Variceal bleeding 81 (27.0)
Acute pancreatitis 21 (7.0)
Lower gastrointestinal bleeding 15 (5.0) Hepatic encephalopathy 9 (3.0)
Acute hepatic failure 8 (2.7)
Cholangitis 6 (2.0)
Miscelaneous/other causes 37 (12.3)
GICU, Gastroenterology Intensive Care Unit.
Table II. Average Values of APACHE II, SAPS II and SOFA Scores According to Survival
Scoring system Survivors Nonsurvivors p value APACHE II 11.9 ± 6,3 21.9 ± 5,4 <0.001 SAPS II 26.7 ± 10,1 46.2 ± 12.6 < 0.001 SOFA 2.2 ± 2.3 9.3 ± 3.0 < 0.001
APACHE, Acute Physiology and Chronic Health Evaluation; SAPS, Simplified Acu-te Physiology Score; SOFA, Sequential Organ Failure Assessment.
Table III. Calibration, Youden Index and Cut-off Values of the Scoring Systems
Scoring system Calibration Youden index Cut-off point goodness-of-fit (χ2)
APACHE II 0.671 0.78 16
SAPS II 0.928 0.78 34
SOFA 0.775 0.88 5
APACHE, Acute Physiology and Chronic Health Evaluation; SAPS, Simplified Acu-te Physiology Score; SOFA, Sequential Organ Failure Assessment.
Table IV. Prediction of GICU Mortality
Scoring system PPV (%) NPV (%) Sensitivity (%) Specificity (%) Overall correctness
of prediction (%)
APACHE II 19.7 99.6 93.8 78.5 86.2
SAPS II 18.2 99.1 87.5 77.8 82.7
SOFA 32.0 100 100 88.0 94.0
GICU, Gastroenterology Intensive Care Unit; APACHE, Acute Physiology and Chronic Health Evaluation; SAPS, Simplified Acute Physiology Score; SOFA, Sequential Organ Failure Assessment; PPV, Positive Predictive Value; NPV, Negative Predictive Value.
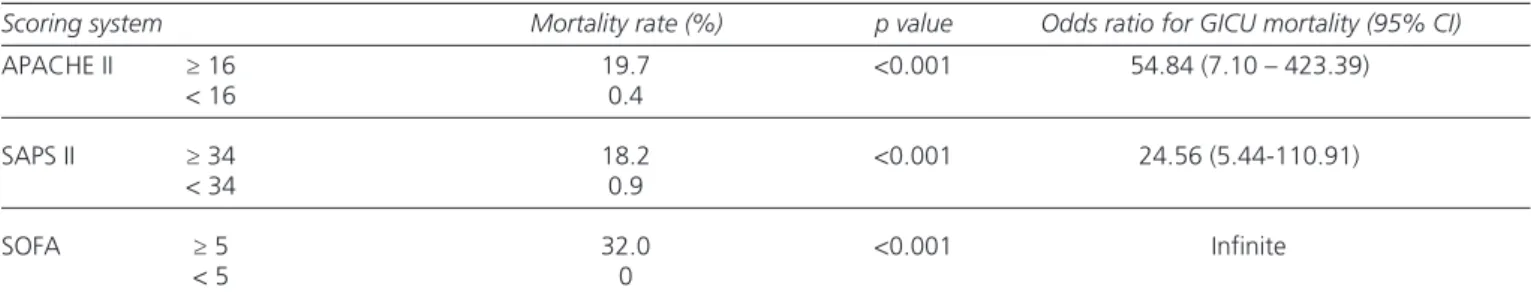
Table V. Cut-off Points)Mortality Rate and Odds Ratio for GICU Mortality
Scoring system Mortality rate (%) p value Odds ratio for GICU mortality (95% CI)
APACHE II ≥ 16 19.7 <0.001 54.84 (7.10 – 423.39) < 16 0.4 SAPS II ≥ 34 18.2 <0.001 24.56 (5.44-110.91) < 34 0.9 SOFA ≥ 5 32.0 <0.001 Infinite < 5 0
GICU, Gastroenterology Intensive Care Unit; APACHE, Acute Physiology and Chronic Health Evaluation; SAPS, Simplified Acute Physiology Score; SOFA, Sequential Organ Failure Assessment; CI, Confidence Interval.
METHODS Patients
This is a retrospective study of 300 consecutively ad-missions (288 patients) in a 4-bed specialized GICU at a 1200-bed university hospital in Portugal, between Fe-bruary 2005 and October 2006. In this unit patients with hepatic and/or gastrointestinal severe medical diseases are admitted. Surgical patients, including post-transplant, are not admitted in this GICU, since there are specific units in our hospital for these patients. Hospitalizations with GICU stay < 24 hours were excluded from the study. For the purposes of this study, each admission was consi-dered a separate patient.
Data collected included demographics, indication for admission, APACHE II, SAPS II and SOFA scores and survival at GICU discharge. The scores were computed for each patient using data collected within the first 24h in GICU, selecting, for each variable, the worst (most ab-normal) value during this period.
The main study outcome was GICU mortality. Ethical approval
Ethical approval for this research was given by the lo-cal Ethics Committee.
Statistical Analysis
Categorical variables were expressed as frequency and percentage, and the corresponding contingency tables were analyzed with Pearson’s chi-square test or Fisher’s exact test, as appropriate. Odds ratios (OR) were determi-ned with 95% confidence intervals (95% CI).
Continuous variables were summarized using means and standard deviation (and range). These variables were tested for normal distributions using Kolmogorov-Smir-nov test. Student’s t test was employed to compare the means of continuous variables and normally distributed data; otherwise, the Mann-Whitney U test was employed. A p value less than 0.05 was considered statistically sig-nificant.
The model performance is usually evaluated statisti-cally by measuring calibration and discriminative ability (1,18).
Calibration (i.e., the degree of correspondence betwe-en predicted and observed mortality over the betwe-entire range of risks) was described by the goodness-of-fit testing using the Hosmer-Lemeshow test. As usually, a p value > 0.2 was considered good (19).
Discrimination (i.e., the model’s ability to differentiate between patients who died and those who survived) was examined with receiver operation characteristic (ROC) curves, using area under the curve (AUC), which is a plot
of true positive rate (sensitivity) vs false positive rate (1-specificity) (19). The AUC ranges from 0 to 1, with 0.5 corresponding to what is expected by chance alone and 1.0 to perfect discrimination. In general, an AUC > 0.7 indicates a useful test (20). AUC between 0.7 and 0.8 were classified as “acceptable” and > 0.8 as “excellent” discrimination (21).
Finally, cut-off points were calculated by obtaining the best Youden index (sensitivity + specificity -1) (22). Po-sitive predictive value, negative predictive value, sensiti-vity, specificity, overall correctness of prediction and odds ratio for GICU mortality were then calculated using the obtained cut-off values.
The data was analyzed with the Statistical Package for Social Sciences-SPSS (SPSS Inc., Chicago, Illinois, USA) computer software for Windows (version 17.0). RESULTS
A total of 288 patients represented 300 cases (admis-sions). Of the 300 cases, 199 were male (66%) and 101 were female (34%). The mean age was 63.9 ± 17.6 (range 17-97 years) and all patients were white. This sample in-cluded 124 (41.3%) admissions of patients with history of liver cirrhosis, mostly (80.6%, n = 100) alcoholic liver cirrhosis.
Upper gastrointestinal bleeding (68%, n = 204) was the most common reason for GICU admission, including 123 (41.0%) patients with bleeding peptic ulcers and 81 (27.0%) with variceal bleeding. The 123 patients admit-ted with bleeding peptic ulcers included 74 (60.2%) duo-denal ulcers, 46 (37.4%) gastric ulcers and 3 (2.4%) anas-tomotic ulcers. The endoscopic stigmata of these ulcers were as following: 7 (5.7%) – Forrest Ia; 32 (26.0%) -Forrest Ib; 49 (39.9%) - -Forrest IIa; 26 (21.1%) - -Forrest IIb; 6 (4.9%) - Forrest IIc; 3 (2.4%) - Forrest III. Of the 81 patients admitted with variceal bleeding, 69 patients had esophageal variceal bleeding and 12 gastric variceal bleeding. The primary treatment for esophageal variceal bleeding was elastic band ligation, sclerosis (with absolu-te alcohol) and Sengstaken Blackmore balloon tampona-de in 30 (43.5%), 21 (30.4%) and 18 (26.1%) patients, respectively. In the 12 patients admitted with gastric vari-ceal bleeding the primary treatment was Histoacryl®+ Li-piodol in 11 (91.7%) patients and Sengstaken Blackmore balloon tamponade in 1 (8.3%) patient. Table I lists the reasons for GICU admission.
Acute renal failure or acute-on-chronic renal failure was found in 62 (20.7%) patients, requiring dialysis in 11 patients (3.7%). Twenty-three patients (7.7%) required endotracheal intubation, including 15 (5.0%) with me-chanical ventilation.
Mean ± standard deviation (and range) of APACHE II, SAPS II and SOFA scores were 12.4 ± 6.7 (0-44), 27.8 ± 11.2 (6-72) and 2.6 ± 2.9 (0-16), respectively. The GICU
tems in ICU populations and sub-populations (1-4,17,23-25). However, to our knowledge, no assessment of these scores was developed in specialized GICU.
APACHE II, a measure of severity of disease (13), has previously been used to risk stratify patients with upper gastrointestinal bleeding (26,27), acute pancreatitis (28-31) and abdominal sepsis (32). Thus, it is expected that APACHE II and, by extrapolation, probably the other scores, may have prognostic ability in GICU.
Our study assessed, to our knowledge for the first time, the accuracy of prognostic scores in patients admit-ted to a GICU. In our series, discrimination and calibra-tion was excellent for all the scores (Fig. 1 and Table III). This means that the scores have very good ability to clas-sify patients correctly as survivors or nonsurvivors and that model predicted mortality was similar to observed mortality. The high sensitivity, specificity, overall co-rrectness of prediction and negative predictive value con-firm the excellent right classification rates of the tested scoring systems in GICU (Table IV). The low positive predictive values are an unsurprising and somewhat ine-vitable consequence of the low mortality rate (Table IV). Nevertheless, these relatively low positive predictive va-lues are strong enough to justify a significantly higher mortality in patients with score values above the cut-off points (Table V).
Among the three scores, SOFA showed the best perfor-mance, with overall correctness of prediction 7.8% and 11.3% greater than that of APACHE II and SAPS II sco-res, respectively (Table IV). Although the SOFA was not developed to predict outcome but to describe the degree of organ dysfunction in critically ill patients, several stu-dies showed its predictive ability in patients admitted to ICUs (16,33-36). Additionally, the variables needed to record the SOFA are derived from standard monitoring of
critically ill patients and calculation at the bedside takes only 3 minutes (36). These elements are important becau-se for any predictive model to be clinically ubecau-seful, it must show ease of use, accuracy and reproducibility (37, 38). However, there are some limitations of the SOFA that should be addressed. Diagnosis, age and co-morbid con-ditions are ignored. Glasgow Coma Scale is the neurolo-gical variable assessed, but its clinical evaluation is sub-jective and it is affected by sedative and analgesic drugs frequently used in critically ill patients. The liver func-tion was evaluated with serum bilirubin although it has li-mited ability to reflect the full spectrum of liver dysfunc-tion in critical illness and it cannot differentiate acute liver dysfunctions from the effects of pre-existing chronic disease. This may be mostly important in GICU where a significant proportion of patients have liver disease.
Established prognostic models are usually estimated after the first 24 h of ICU admission (1-4,16,17). Thus, current models may not be suitable to decide on the ap-propriateness of admission to ICU, as clinical status may improve over the first 24h with therapy or deteriorate due to complications (39). Other limitations are that they were not designed to predict prognosis for long stays or after ICU discharge and do not evaluate end-points other than mortality, such as cost-effectiveness, recovery, phy-sical activity or quality of life (19,40-42).
The evaluated scores were calibrated to predict the outcome in the original development samples, that were extracted from general ICUs where the mortality rate is significantly higher than in our unit (13,14,16). In addi-tion, it is well known fact that mortality prediction model performance usually deteriorates when models are ap-plied to different population samples, i.e. less sick pa-tients. Indeed, although APACHE II works well for seve-rely ill cirrhotic patients admitted to ICUs (17,43-47), Fig. 1. Receiver operation characteristic (ROC) curves and corresponding area under the curve (AUC) for Acute Physiology and Chronic Health Evalua-tion (APACHE) II, Simplified Acute Physiology Score (SAPS) II and Sequential Organ Failure Assessment (SOFA) in 300 consecutive admissions to a Gas-troenterology Intensive Care Unit.
this is not the case when its predictive value is assessed in a population of cirrhotic patients with mortality rate of only 11.5% (48). Thus, our results are somewhat surpri-sing, because the mortality rate in our sample was only 5.3% and nevertheless the scores showed an excellent performance.
Potential limitations of our study should be mentioned. Firstly, it is a retrospective study. Secondly, this work was performed in an academic referral hospital; therefore our results may not be applicable to institutions with dif-ferent populations. Finally, patients with GICU stay < 24 hours were excluded, resulting in a mortality rate of only 5.3%. It could be stated that the rational of excluding the-se patients weakens our study, becauthe-se the most likely is that these patients have died. However, this problem is shared by all the other works in this area, as the tested scores, by definition, must be calculated with the worst value for each variable obtained during the first 24h of admission.
Despite the excellent performance of the tested scores in our study, its structure has some limitations in the prognostic assessment of patients admitted in a GICU. Indeed, prothrombin time and blood units transfused are not measured by the scores, and they are presumably im-portant prognostic variables in a population with high in-cidence of cirrhosis and in which the principal reason for admission was upper gastrointestinal bleeding. Therefo-re, in the futuTherefo-re, it would be interesting to develop studies to identify independent risk factors in patients admitted to a GICU and, based on them, develop a specific score for this context.
Objective prognostic estimates can be useful as an im-portant tool in the decision making process. However, probability models can never predict whether a patient will live or die with 100% accuracy (49-51). Thus, these probabilities should be used to complement and enhance, not as a substitute for clinical judgment.
In conclusion, our data showed that APACHEII, SAPS II and SOFA scores have excellent discrimination and ca-libration in GICU and, therefore, are clinically useful in this context. Furthermore, our results indicate that among the three scores, SOFA has the greatest overall correct-ness of prediction. Nevertheless, a validation of our re-sults is required in others GICU, preferably prospecti-vely. Prognostic scoring systems cannot replace the clinical evaluation of the patients. However, we believe that these scores may improve the physician’s estimate of prognosis and, hence, be useful in clinical decision ma-king.
REFERENCES
1. Strand K, Flaatten H. Severity scoring in the ICU: a review. Acta Anaesthesiol Scand 2008; 52: 467-78.
2. Herridge MS. Prognostication and intensive care unit outcome: the evolving role of scoring systems. Clin Chest Med 2003; 24: 751-62. 3. Afessa B, Gajic O, Keegan MT. Severity of illness and organ failure
assessment in adult intensive care units. Crit Care Clin. 2007; 23: 639-58.
4. Higgins TL. Quantifying risk and benchmarking performance in the adult intensive care unit. J Intensive Care Med. 2007; 22: 141-56. 5. Rafkin HS, Hoyt JW. Objective data and quality assurance programs.
Current and future trends. Crit Care Clin. 1994; 10: 157-77. 6. Vincent JL, Ferreira F, Moreno R. Scoring systems for assessing
or-gan dysfunction and survival. Crit Care Clin. 2000; 16: 353-66. 7. Becker RB, Zimmerman JE. ICU scoring systems allow prediction of
patient outcomes and comparison of ICU performance. Crit Care Clin 1996; 12: 503-14.
8. Glance LG, Osler TM, Dick A. Rating the quality of intensive care units: is it a function of the intensive care unit scoring system? Crit Care Med 2002; 30: 1976-82.
9. Pronovost PJ, Nolan T, Zeger S, Miller M, Rubin H. How can clini-cians measure safety and quality in acute care? Lancet 2004; 363: 1061-7.
10. Friedman Y. Ethical issues in the critically ill patient. Curr Opin Crit Care. 2001; 7: 475-9.
11. Gropper MA. Evidence-based management of critically ill patients: analysis and implementation. Anesth Analg 2004; 99: 566-72. 12. Azoulay E, Sprung CL. Family-physician interactions in the
intensi-ve care unit. Crit Care Med 2004; 32: 2323-8.
13. Knaus WA, Draper EA, Wagner DP, Zimmerman JE. APACHE II: a severity of disease classification system. Crit Care Med 1985; 13: 818-29.
14. Le Gall JR, Lemeshow S, Saulnier F. A new Simplified Acute Phy-siology Score (SAPS II) based on a European/North American multi-center study. JAMA. 1993; 270: 2957-63.
15. Vincent JL, Moreno R, Takala J, et al. The SOFA (Sepsis-related Or-gan Failure Assessment) score to describe orOr-gan dysfunction/failure. On behalf of the Working Group on Sepsis-Related Problems of the European Society of Intensive Care Medicine. Intensive Care Med. 1996; 22: 707-10.
16. Minne L, Abu-Hanna A, de Jonge E. Evaluation of SOFA-based mo-dels for predicting mortality in the ICU: A systematic review. Crit Care 2008; 12: R161.
17. Cholongitas E, Senzolo M, Patch D, Shaw S, Hui C, Burroughs AK. Review article: scoring systems for assessing prognosis in critically ill adult cirrhotics. Aliment Pharmacol Ther 2006; 24: 453-64. 18. Ruttimann UE. Statistical approaches to development and validation
of predictive instruments. Crit Care Clin 1994; 10: 19-35.
19. Rosenberg AL. Recent innovations in intensive care unit risk-predic-tion models. Curr Opin Crit Care 2002; 8: 321-30.
20. Hanley JA, McNeil BJ. A method of comparing the areas under re-ceiver operating characteristic curves derived from the same cases. Radiology 1983; 148: 839-43.
21. Cholongitas E, Senzolo M, Patch D, et al. Risk factors, sequential or-gan failure assessment and model for end-stage liver disease scores for predicting short term mortality in cirrhotic patients admitted to in-tensive care unit. Aliment Pharmacol Ther 2006; 23: 883-93. 22. Youden WJ. Index for rating diagnosis tests. Cancer 1950; 3: 32-5. 23. den Boer S, de Keizer NF, de Jonge E. Performance of prognostic
models in critically ill cancer patients - a review. Crit Care 2005; 9: R458-63.
24. Nava S. Scoring of severity in patients admitted to a respiratory in-tensive care unit. Monaldi Arch Chest Dis 1997; 52: 71-2.
25. Murthy JM, Meena AK, Kumar SR. Severity-of-illness scoring sys-tems and models: neurological and neurosurgical intensive care units. Neurol India 2001; 49: S91-4.
26. Lee H, Hawker FH, Selby W, McWilliam DB, Herkes RG. Intensive care treatment of patients with bleeding esophageal varices: results, predictors of mortality, and predictors of the adult respiratory distress syndrome. Crit Care Med 1992; 20: 1555-63.
27. Schein M,Gecelter M. APACHE II score in massive upper gastroin-testinal haemorrhage from peptic ulcer: prognostic value and poten-tial clinical applications. Br J Surg 1989; 76: 733-6.
28. Larvin M, McMahon MJ.APACHE-II score for assessment and mo-nitoring of acute pancreatitis. Lancet 1989; 2: 201-5.
29. Paredes Cotoré JP, Bustamante Montalvo M, Fernández Rodríguez E, Valeiras Domínguez E, Potel Lesquereux J. Prognosis of acute pancreatitis: Ranson or APACHE II? Rev Esp Enferm Dig 1995; 87: 121-6.
30. Padillo FJ, Rufián S, Briceño J, et al. Prognostic factors in severe acute pancreatitis. Univariate and multivariate study. Rev Esp En-ferm Dig 1995; 87: 32-7.
31. Poves Prim I, Fabregat Pous J, García Borobia FJ, Jorba Martí R, Fi-gueras Felip J, Jaurrieta Mas E. Early onset of organ failure is the best predictor of mortality in acute pancreatitis. Rev Esp Enferm Dig 2004; 96: 705-9.
32. Bohnen JM, Mustard RA, Oxholm SE, Schouten BD. APACHE II score and abdominal sepsis. A prospective study. Arch Surg. 1988; 123: 225-9.
33. Vincent JL, de Mendonça A, Cantraine F, et al. Use of the SOFA score to assess the incidence of organ dysfunction/failure in intensive care units: results of a multicenter, prospective study. Working group on "sepsis-related problems" of the European Society of Intensive Care Medicine. Crit Care Med 1998; 26: 1793-800.
34. Moreno R, Vincent JL, Matos R, et al. The use of maximum SOFA score to quantify organ dysfunction/failure in intensive care. Results of a prospective, multicentre study. Working Group on Sepsis related Problems of the ESICM. Intensive Care Med 1999; 25: 686-696. 35. Antonelli M, Moreno R, Vincent JL, et al. Application of SOFA
sco-re to trauma patients. Sequential Organ Failusco-re Assessment. Intensi-ve Care Med 1999; 25: 389-94.
36. Janssens U, Graf C, Graf J, et al. Evaluation of the SOFA score: a single-center experience of a medical intensive care unit in 303 con-secutive patients with predominantly cardiovascular disorders. Se-quential Organ Failure Assessment. Intensive Care Med 2000; 26: 1037-45.
37. Holt AW, Bury LK, Bersten AD, Skowronski GA, Vedig AE. Pros-pective evaluation of residents and nurses as severity score data co-llectors. Crit Care Med 1992; 20: 1688-91.
38. Domínguez L, Enríquez P, Alvarez P, et al. Evaluation of the repro-ducibility of the data collection for the APACHE II, APACHE III adapted for Spain and the SAPS II in nine intensive care units in Spain. Med Intensiva 2008; 32: 15-22.
39. Foreman MG, Mannino DM, Moss M. Cirrhosis as a risk factor for sepsis and death: analysis of the National Hospital Discharge Survey. Chest 2003; 124: 1016-20.
40. Kollef MH, Schuster DP. Predicting intensive care unit outcome with scoring systems. Underlying concepts and principles. Crit Care Clin 1994; 10: 1-18.
41. Abraham E, Andrews P, Antonelli M, et al. Year in review in intensi-ve care medicine-2003. Part 3: intensiintensi-ve care unit organization, sco-ring, quality of life, ethics, neonatal and pediatrics, and experimental. Intensive Care Med 2004; 30: 1514-25.
42. Konopad E, Noseworthy TW, Johnston R, Shustack A, Grace M. Quality of life measures before and one year after admission to an in-tensive care unit. Crit Care Med 1995; 23: 1653-9.
43. Zauner CA, Apsner RC, Kranz A, et al. Outcome prediction for pa-tients with cirrhosis of the liver in a medical ICU: a comparison of the APACHE scores and liver-specific scoring systems. Intensive Care Med 1996; 22: 559-63.
44. Zauner C, Schneeweiss B, Schneider B, et al. Short-term progno-sis in critically ill patients with liver cirrhoprogno-sis: an evaluation of a new scoring system. Eur J Gastroenterol Hepatol 2000; 12: 517-22.
45. Zimmerman JE, Wagner DP, Seneff MG, Becker RB, Sun X, Knaus WA. Intensive care unit admissions with cirrhosis: risk-stratifying patient groups and predicting individual survival. Hepatology 1996; 23: 1393-401.
46. Wehler M, Kokoska J, Reulbach U, Hahn EG, Strauss R. Short-term prognosis in critically ill patients with cirrhosis assessed by prognos-tic scoring systems. Hepatology 2001; 34: 255-61.
47. Aggarwal A, Ong JP, Younossi ZM, Nelson DR, Hoffman-Hogg L, Arroliga AC. Predictors of mortality and resource utilization in cirr-hotic patients admitted to the medical ICU. Chest 2001; 119: 1489-97.
48. Chatzicostas C, Roussomoustakaki M, Notas G, et al. A comparison of Child-Pugh, APACHE II and APACHE III scoring systems in pre-dicting hospital mortality of patients with liver cirrhosis. BMC Gas-troenterol 2003; 3: 7.
49. Seneff MG, Zimmerman JE, Knaus WA. Outcome prediction for specfic conditions. In: Ayers SM, GrenvikA, Holbrook PR, Shoema-ker WC, eds. Textbook of critical care. Ed 3. Philadelphia: Saunders; 1995: 1808-17.
50. Luce JM, Wachter RM. The ethical appropriateness of using prog-nostic scoring systems in clinical management. Crit Care Clin 1994; 10: 229-41.
51. Seneff M, Knaus WA. Predicting patient outcome from intensive care:a guide to APACHE, MPM, SAPS, PRISM, and other prognos-tic scoring systems. J Intensive Care Med 1990; 5: 33-52.