Improved Recommendations via (More) Collaboration
∗Rubi Boim
Haim Kaplan
Tova Milo
Ronitt Rubinfeld
School of Computer Science Tel-Aviv University
{boim,haimk,milo,ronitt}@post.tau.ac.il
ABSTRACT
We consider in this paper a popular class of recommender systems that are based on Collaborative Filtering (CF for short). CF is the process of predicting customer ratings to items based on previous ratings of (similar) users to (similar) items, and is typically used by asingle organization, using itsowncustomer ratings.
We argue here that amulti-organizationcollaboration, even for organizations operating in different subject domains, can greatly improve the quality of the recommendations that the individual or-ganizations provide to their users. To substantiate this claim, we presentC2F (Collaborative CF), a recommender system that re-tains the simplicity and efficiency of classical CF, while allowing distinct organizations to collaborate and boost their recommenda-tions.C2Femploys CF in a distributed fashion that improves the quality of the generated recommendations, while minimizing the amount of data exchanged between the collaborating parties. Key ingredient of the solution are succinct signatures that can be com-puted locally for items (users) in a given organization and suffice for identifying similar items (users) in the collaborating organiza-tions. We show that the use of such compact signatures not only reduces data exchange but also allows to speed up, by over 50%, the recommendations computation time.
1. INTRODUCTION
Recommender systems are programs that attempt to present to the user a small subset of items (out of a much larger items set), which she is likely to find interesting. With the growing popularity of e-commerce, and the huge variety of items offered by on-line stores, assisting users in identifying relevant items is crucial. In-deed, much research has been devoted recently to developing effec-tive recommendation algorithms, as even very small improvements directly translate into higher income.
In this paper we focus on a popular class of such recommender systems, where recommendations are computed via Collaborative Filtering (CF for short) [3]. CF is the process of predicting users ∗The research has been partially supported by the European Project Mancoosi, the Israel Science Foundation and the US-Israel Bina-tional Science Foundation.
Permission to make digital or hard copies of all or part of this work for personal or classroom use is granted without fee provided that copies are not made or distributed for profit or commercial advantage and that copies bear this notice and the full citation on the first page. To copy otherwise, to republish, to post on servers or to redistribute to lists, requires prior specific permission and/or a fee.
WebDB’10 Indianapolis, IN USA
Copyright 2010 ACM 978-1-4503-0186-2/10/06 ...$10.00.
rating to items based on previous ratings of (similar) users to (sim-ilar) items. Unlike semantic-based methods [3], CF does not use semantic properties of the items (e.g, manufacturer, color, etc). In-stead, it is based on the assumption that users who agreed in the past on item ratings are likely to agree again in the future. Com-mon CF algorithms thus consist of two main steps: (1) choosing the right neighborhood of users (resp. items), and (2) calculating the prediction using some aggregation function on actual ratings provided by the chosen neighborhood.
Previous works on such recommender systems focused mostly on CF performed by asingleorganization over its owncustomer ratings. We argue here that amulti-organizationcollaboration, even for organizations operating in different subject domains, can greatly improve the quality of the recommendations that the individual or-ganizations provide to their users. Assume for instance thatNetflix - an online movie rental service,Blockbuster- a chain of movie rental stores, andToys“R”Us- a toy store chain, wish to collab-orate in order to improve the service to their customers. Naturally, each organization has its own database of user ratings and can use it to generate recommendations. But the quality of recommenda-tions may be greatly improved by taking into account information available in the other collaborating organizations. This seems ob-vious forNetflixandBlockbusterwhere the domain items are similar: Correlations between users interest in one movie store may naturally be used to refine recommendations in the other. But correlations between inter-domain items may also exist and can be leveraged: We may discover, e.g., that a large portion of the users who viewed (and liked) “Star Wars” onNetflixalso bought (and liked) a space-ship model atToys“R”Us, and thus recommend this toy to similar viewers that have not purchased it yet.
To support such collaboration, we present in this paperC2F (Col-laborative, Collaborative Filtering), a recommender system that re-tains the simplicity and efficiency of classical CF, while allowing distinct organizations to collaborate and boost their recommenda-tions. Note that a naive solution that accumulates all data sets into one centralized location (then applies classical CF) is typically not feasible due to the excessive amounts of (constantly updated) data and the independence of the organizations. Instead,C2Femploys CF in a distributed fashion that maximizes the quality of the gen-erated recommendations, while minimizing the amount of data ex-changed between the collaborating parties. Key ingredient of the solution are succinct signatures that can be computed locally for items (users) in a given organization and suffice for identifying sim-ilar items (users) in the collaborating organizations.
We describe here the operation ofC2Fand present an experi-ential analysis, performed on real-life data, demonstrating the im-provement in recommendations quality that it achieves, relative to those computed when only the local organization data is
consid-ered. We also show that the use of compact signatures not only reduces data exchange but also allows to speed up, by over 50%, the recommendations computation time.
We note that the aggregating of rating predictions from multiple sites has been previously proposed in the literature in a different context: Forsemantically-similarsites, where a given [user,item] pair belongs to multiple sites, it was suggested to compute its rate prediction by aggregating the predictions of the individual sites for this pair [7]. A main difference with our work is their focus on sim-ilar domains with common (user,item) pairs. In contrast, our solu-tion allows forinter-domaincollaboration, exchanging only a small amount of data between the collaborating parties, yet sufficient for effectively identifying and exploiting the relevant information.
It should be stressed that our aim here isnot to invent yet another CF algorithm, but rather to present a generic novel technique that allows one to better exploit existing CF algorithms in a distributed, multi-organization setting. Indeed, while our implementation uses specific neighborhood metric/rate aggregation functions to gener-ate recommendations, the technique that we propose can similarly be used for other functions.
The paper is organized as follows. Section 2 provides the nec-essary background on classical CF and presents the adjustments required to support a distributed setting. Section 3 presents our al-gorithms and Section 4 describes the system implementation and experiments. Finally, Section 5 concludes with related work.
2. PRELIMINARIES
We start with some background on classical CF, then explain the adjustments required to support a distributed setting and present our algorithms.
2.1 Classical CF
Given a setUof users and a setIof items, we useu, vto denote users inUandi, jto denote items inI. A ratingru,iis a numeric
value given by a useruto an itemi. The ratings are given in the form of a matrixRof size|U| × |I|. Note that this matrix is typ-ically very sparse (usually less than 1% of the possible ratings are known) and the goal is to predict the unknownru,iratings as
accu-rately as possible. We consider two popular types of CF prediction algorithms, referred to asItem-BasedandUser-BasedCF.
Item-BasedCF is based on the intuition that an unknown rating
ru,ican be estimated using the actual ratings thatugave to itemsj
similar toi. Formally, ru,i= P j∈N(i;u)si,jru,j P j∈N(i;u)si,j (1) whereN(i;u)is the set (neighborhood) of items similar toithat were rated byu(i.e.ru,jis known for eachj∈N(i;u)), andsi,j
is a measure of the similarity between itemsiandj. Note that the similarity between different items is used not only to weight the ratings, but also to choose the neighborhoodN(i;u). For example, we could chooseN(i;u)as the set of items whose similarity value toiis above some given threshold.
User-BasedCF is analogous to item-based, but instead of look-ing at similar items we look at usersvsimilar tou, which have ratedi. The prediction ofru,iis then symmetrically obtained by
aggregating their ratings fori.
In both approaches, similarity between two items (users) plays a key role in determining the neighborhoods and for weighting the existing ratings. In principle, any similarity measure can be used here (e.g. Cosine orLidistance) but Pearson’s Correlation
Coeffi-cient [13] seems to be the preferred choice in most major systems. The basic intuition behind Pearson’s measure is to give a high
sim-ilarity score for two items (users) that tend to be rated the same by many users (resp., tend to rate the same many items). Formally, for two itemsiandj, it is computed as follows.
si,j =
P
u∈U(i,j)(ru,i−r¯u)(ru,j−¯ru)
qP
u∈U(i,j)(ru,i−r¯u)2
qP
u∈U(i,j)(ru,j−r¯u)2
(2) whereU(i,j)is the set of all usersuwho rated both itemsiandj (i.e.ru,iandru,jare both known), and¯ruis the average rating of
useru. r¯uis subtracted here fromru,i to “normalize" the rating
values for those users that tend to always give high (or low) grades. WhenU(i,j)=∅, namely there are no users that rated bothiandj, we definesi,j= 0.
Pearson similarity of two usersu, vis computed symmetrically.
2.2 Collaborative CF
Consider an organizationothat wishes to improve its rating pre-dictions using information available in another organizationo0. For
oando0to collaborate, they should have some common denomi-nator w.r.t. which they can share information. We focus on two scenarios here: The first, calledshared users, assumes thatoand
o0share a (relatively large) set of common users. The examples we have seen earlier ofNetflix,BlockbusterandToys“R”Us comply to this scenario, since many customers shop in several of these stores. The second scenario, calledshared items, is the case where oand o0 share a (relatively large) set of common items. For example, assume that Blockbusterbranches in different countries maintain individual local information repositories. Two brancheso, o0here serve different customers (users) but may carry many common movies (items), e.g. American films.
We next explain how shared users (resp. items) can be used to boost Item-based (User-based) CF. We start with some intuition, then explain the optimizations required to make things practical.
We denote below byOthe set of collaborating organizations and useo, o0to denote individual organizations inO. A rating of user
uto itemiin organizationois denotedro
u,i. Finally, the similarity
between two items iin o,j ino0 (where omay be the same or different thano0) is denoteds(o,o0)
i,j ; similarly,s
(o,o0)
u,v denotes the
similarity between two usersuino,vino0.
Item-based CF with shared usersis a generalization of the
cen-tralized version: Instead of considering only the local neighbor-hood of items, we improve the prediction by considering also the corresponding neighborhoods in the collaborating organizations. Namely, equation (1) is refined as follows
ru,io = P o0∈O P j∈No0(i;u)s (o,o0) i,j ro 0 u,j P o0∈O P j∈No0(i;u)s(o,o 0) i,j (3) whereNo0(i;u)is the set (neighborhood) of items similar toiin
organizationo0that have been rated byu. As before, the similarity between items is used not only to weight the final prediction, but also to choose the neighborhood.
The similarity to an itemjthat resides locally inocan be com-puted as before. Things are more complex for itemsjthat reside in some remote organizationso0. Observe that every item can essen-tially be viewed as a vector of ratings, in a multi-dimensional space, where each dimension corresponds to a specific user, and holds her rating. Similarity between two itemsiandjthus amounts to com-puting the similarity of the two corresponding vectors (w.r.t. the similarity measure of interest.) A straightforward solution is thus to sendi’s vector to every siteo0∈O, and have each such site com-pute and return itsPj∈No0(i;u)s(o,o
0) i,j ro 0 u,jand P j∈No0(i;u)s(o,o 0) i,j
i, thereby determining both the neighborhood setNo0(i;u)and the
similarity valuess(i,jo,o0)for the neighborhood members).
It is important to note however is that these vectors are very large (their size equals the number or users that rated a given item, which can be hundreds of thousands [6]). To minimize communication, C2Fsends, instead, a concise, much smaller vector (which we call a signature) that suffices for identifying similar items in the collab-orating organizations. We will see that a further positive result of use of concise signatures is a speed up of over 50% in the recom-mendations computation time.
The construction of signatures is explained in the next section. But before we explain this, let us first briefly consider the symmet-ric User-based scenario.
User-based CF with shared items works analogously. Each
user is viewed as a vector of ratings, where the dimensions cor-respond to items and hold the user’s ratings for the items. Here again, rather than sending the full vector of the user,C2Fsends a smaller signature that suffices for identifying similar users in the collaborating organizations.
3. COMPUTING SIGNATURES
C2Femploys two main algorithms for computing users (items) signature, inspired, resp., by works on Dimension Reduction [4] and Features Selection [11]. We explain them below.
3.1 Dimension Reduction
Dimension reductionis a common technique where a set of points (represented by vectors) in a given multi-dimensional space is mapped to a lower-dimensional space, by multiplication with a special ma-trixM[10].Mis chosen so that the distance (similarity) between the input vectors (measured, e.g., by Cosine orLi) is preserved up
to a small constant.
Recall that, in our setting, every item (resp. user) can be viewed as a vector of ratings, in a multi-dimensional space, where each dimension corresponds to a specific user (item), and holds her (its) rating. Specifically, consider a setOof collaborating organizations. Let us consider first a shared-users scenario (the shared-items case is handled symmetrically, see below). For simplicity, assume that they have exactly the same setU of users. 1 Each organization
o∈Ohandles a setIoof items and its ranking matrixRois thus
of arity|Io| × |U|. In other words, we have|Io|item vectors, in a
|U|dimensional space. If all organizations use the same matrixM
of arityk× |U|(for some smallk <|U|) to reduce the dimensions of their data, the reduced k-ary vectors could then be exchanged between the sites, instead of the original ones, and used to identify similar items/users.
More formally, consider the reduced matricesRˆo =Ro×M,
o∈O(of arity|Io| × |k|). Suppose that siteowants to estimate
what rank useruwould give to itemi(denote abovero
u,i). Rather
than sending the originalU-ary vectorRo[i]to the collaborating
or-ganizations,osends the reduced k-ary vectorRˆo[i](=Ro[i]×M).
Now, a collaborating organizationo0 may compute the similarity values(i,jo,o0)betweeniand the itemsjino0by measuring the the distance betweenRˆo[i]andRˆ0o[j]. The remaining of the
computa-tions continues as before.
Similarly, in a shared-items scenario, each organizationo∈O
handles a setUo of users and the ranking matrix Ro is of arity
|Uo| × |I|(rows now corresponds to users). M here is of arity
k× |I|. The rest stays as above.
1Otherwise, letUdenote the union of the users sets.
Difficulties and (partial) solution..
Standard Dimension Re-duction algorithms, like SVD [9], need to analyzeallthe input vec-tors for constructing the distance-preserving matrix M. Namely, the vectors in all theRo,o ∈ O, matrices, have to be examined.This is impossible here given the distributed setting and the exces-sive amount of data. To overcome this,C2F employs a recently developed algorithm called the Fast Johnson-Lindenstrauss Trans-form (FJLT) [4] that randomly generates a matrixMthat is guaran-teed, with high probability, to have the desired properties. The crux is that the matrix is generatedindependently of the input vectors and no access to the actual data is required. It can thus be created by an arbitrary site and disseminated to all others. Moreover, the FJLT matrix is extremely sparse (hence highly compressible), so the transmission incurs only little communication overhead.
Some difficulties nevertheless still exist. First, it is important to note that FJLT requires the number of original dimensions to be smaller than the number of vectors. In actual systems, however, the number of users always exceeds the number of items, thus FJLT is applicable to the case of shared items but not to shared users.
Second, observe that, when multiplying matrices, the value of all entries must be defined. Since the rating matrices are sparse, some default value (i.e. the average user/item rating) is used for the missing entries [10]. This is common practice when employing similarity measures such as Cosine orLidistance, but is precisely
what Pearson’s Correlation Coefficient tries to avoid. (Recall that formula 2 ignores users for which one of theru,iorru,jvalue is
missing.). Thus the technique is applicable to the case of Cosine-orLi-based similarity measures but not for Pearson.
3.2 Dimension Selection
The second algorithm employed byC2Fis applicable for both shared items and shared users scenarios and can also handle Pear-son. This however comes at the expense of the theoretical worse-case guaranties on the distance error. But we will see that in prac-tice the error turns out nevertheless to be very marginal.
Given an item (user) vector, rather than mapping it to another lower-dimension domain, the algorithm chooses a subset of the original dimensions that best describe the given item (user). Namely, given an itemi(useru), the algorithm chooses a small subset of the users (items) such that the similarity ofi(u) to other items (users), based solely on this subset of users (items), is close to the “real” similarity value when considering the full users (items) set. We can now send to the collaborating sites a small vector consisting only of the ratings of this reduced set of users (items). The key chal-lenge here is to choose the best set of users/items (one that makes the similarity values as close as possible to the original ones).
To illustrate the idea, let us consider the shared-user scenario. (The shared-items scenario is symmetric). To make things formal, we use the following notation: Recall that in standard (and dis-tributed) CF, the similaritysi,jbetween two itemsi, j∈Ireflects
the correlation between the ratings for these items, given by the full set of usersU. LetUk⊆Udenote a set of users, of sizek,
belong-ing to all the collaboratbelong-ing organizations. We usesUk
i,j to denote
the similarity of itemsiandjwhen computed based solely on the ratings of users inUk.
Given an itemiand some number k, our goal is to choose a setUkof users, such that the similarity valuessUi,jk, for the items
j ∈ I, are as similar as possible to the real similarity valuessi,j
(computed with the full users setU). As before, we may use Pear-son’s correlation coefficient to measure the similarity between the two sets of similarity values. We overload notation and, given an itemi, usesU,Uk(i)to denote this value.
sU,Uk(i) = P j∈I(si,j)(sUi,jk) qP j∈I(si,j)2 qP j∈I(s Uk i,j)2 (4) Note that, unlike in the Pearson equation 2, where the rating had to be normalized (by subtracting the average users rating), the val-ues compared here are unbiased (reflecting the calculated similarity values), hence the simpler shape of the present formula.
Given itemiand a numberk, we call a set of usersUk, of sizek,
that has a maximalsU,Uk(i)value, anoptimal k-set. Unfortunately,
an optimal k-set is expensive to find. Clearly, a naive algorithm may simply test all possiblek-size sets, namelyO(|U|k)such sets,
and choose one with the highest score. Since the number of users may be extremely large, this is too time consuming. Unfortunately we can show that unless P=NP, the exponential dependency inkis unavoidable. Indeed, we can show (by reduction to Set-Cover [2]), THEOREM 3.1. The problem of testing, given numberkand a boundb, whether there exists a set ofkusersUks.t.sU,Uk(i)> b,
is NP-complete ink.
While there are known PTIME approximation algorithms for Set-Cover which could in principle be considered here, our experi-ments showed that even algorithms that considered just a quadratic (in|U|) number of sets were too expensive to be applicable. We have thus chosen to use the following simpler, greedy heuristic: In-stead of calculating the similarity value of each possible k-sized subset toU, we considersingletonsets, consisting each of a single user. We calculate their similarity toU, then choose forUkthosek
users having sets with highest similarity score.2.
Difficulties and solutions.
Some difficulties nevertheless still exist. First, to evaluate equation 4 fork= 1(i.e. a setU1={u}, consisting of a single useru), the corresponding items similarity scores,s{i,ju}, need to be computed. Note however that not allsimi-larity measures behave well when only one user is considered. For instance, given a set of users consisting only of one useru, Co-sine and Pearson both yield a constant similarity value of1, for all item pairsi, jrated byu, regardless of the actual rating values (see equation 2) We must thus use a more adequate similarity measure for the single-user sets, e.g. Li. Note however that if a different
measure, e.g. Cosine or Pearson, was employed for full set of users
U, we have to make the two similarly values comparable before we can evaluate formula 4. For example, to compare anL1similarity with a Pearson one, we need to map the similarity values of the former to the range[−1,1]of the later (with1being the best score and−1worse). Namely,
s{i,ju}= 1− 2L
1(i, j)
M axRating−M inRating (5)
whereL1(i, j) =|r
u,i−ru,j|.
A second difficulty isoverfitting[15]. Intuitively, we would like the selected set of usersUk to “cover" as many items as possible
(so that we can use their ranking for the items to determine simi-larity). However, according to formula 4, a setUkthat ranked only
very few items may still get high score if the similarity between these few items, as reflected by these ratings, happens to be the same as their overall similarity value. Following common practice, we solve this problem by applying acompensation functionto the computed similarity measure, that reflects how many items, out of the relevant ones, are covered byUk. Namely,
2This set may not be unique in the case of multiple users with
iden-tical scores, in which case we chose one such set arbitrarily
s0
U,Uk(i) =sU,Uk(i)◦
|Items(Uk, i)|
|Items(U, i)| (6)
whereItems(Uk, i)(resp. Items(U, i)) is the set of itemsjs.t.
Uk(resp.U) contains some useruthat rated bothiandj. (Recall
from Equation 2 that only such items are useful for the similarity computation).
3.3 Signatures Update
We conclude this section by considering updates. The rating ma-trix gets updated, e.g. when new user ratings are added/updated or when a new user/item is added or deleted. To stay in sync, the relevant signatures need to be correspondingly updated.
For signatures computed via Dimension Selection, updates have alocaleffect, in the sense that the only signatures affected by the update are those of thesite where the update had occurred. Things are more complex for Dimension Reduction. Some updates here also have local affect. For instance, when a new user is added, or when the ratings of an existing user are updated, the new signa-ture of the user is computed by simply multiplying its new/updated vector by the reduction matrixM. In contrast, the addition of new items have a moreglobalaffect. Note that the addition of a new item here changes the dimension of the user vectors. To account for this, a new reduction matrix has to be generated (with corre-sponding dimensions) and disseminated to the collaborating sites (to recompute their signatures accordingly).
The re-computation and dissemination of signatures/reduction matrix with each update, may naturally cause a significant over-hand. To avoid this we take lazy approach and update/diseminate the signatures/matrix only periodically, when sufficiently large num-ber of updates had been accumulate. (In between, the old signatures may still be used for estimating the similarity between the corre-sponding vectors.) For that, we periodically prob locally some of the updated users/items. We compute their accurate new signa-tures and compare the respective distance that they entails to that obtained using the old signatures. Only when the error exceeds a given threshold, a full re-computation and dissemination is trig-gered.
4. EXPERIMENTAL EVALUATION
TheC2Fsystem allows distinct organizations to collaborate for improving the quality of the recommendations that they provide to users. The system is implemented in Java and designed to be de-ployed on any CF system implementing its local interface. The ex-periments were performed on an Intel quad-core machine (Q9400) with 2.66 GHz CPUs, 4GB memory and Windows XP x64 edition. Acquiring adequate real-life data for the experiments was non trivial. Although several public data sets are available online (e.g. Netflix, Delicious, etc.), which in principle could be ideal for sim-ulating an inter-domain collaboration, the user ids in these data sets are masked, thus common users cannot be identified. We have thus decided to use instead a single data set, and split it into sev-eral seemingly uncorrelated subsets. We used the Netflix public data set [6] which provides over 100 millions different ratings of movies by 500,000 users, to 18,000 different movies. To simulate a multi-domain scenario we split the data (using information gath-ered from the IMDB database [1]) into five seemingly uncorrelated sub-domains (kids movies, documentary, thrillers, etc.) each repre-senting the database of one organization “specializing” in the given area. To compare this to a setting where organization in similar do-mains are collaborating, we had also considered alterative random splits of the data, once by user and once by movie.
The Netflix data has two parts, a public data set (called the train-ing set) and a private set (calledquiz set) of unreviewed ratings.
Figure 1: Dimension Selection (multi-domain)
The quality of a recommender system is measured by comparing its predictions, for the unrevealed ratings in the quiz set, to their true value. The Root Mean Squared Error (RMSE) metric is used to measure accuracy. A lower RMSE value means better results. We note that even a small improvement in the RMSE value (e.g.,
∼0.01) translates to a significant improvement in the quality of the top-k recommended products [12].
Recall, from the Introduction, that our aim here is not to invent yet another CF algorithm, but rather to present a generic technique that allows one to better exploit existing CF algorithms in a dis-tributed, multi-organization setting. Specifically, we experimented with the basic CF algorithm from section 2.1 as well as with more sophisticated variants such as [12]. Our algorithms provided, in all cases, similar relative improvement. We show below a representa-tive sample of the results for the CF algorithm of Section 2.1.
We first consider the Item-based shared-users setting, then User-based shared-items one.
4.1 Item-based CF with shared-users
Recall from section 3 that dimension reduction is not applicable here and may only apply dimension selection. We start with the multi-domain case where movies are split into seemingly uncorre-lated organizations.
Figure 1 depicts the RMSE values for increasing signature sizes (number of selected users), in logarithmic scale. The left-most end, when the signature size is0, represents the classical case where each organization computes its predictionslocally, withno infor-mation sharing. At the right-most size, the full item vectors are exchanged. It is evident that collaboration here yields better rat-ing prediction (a drop from RMSE of1.0207to0.9548). We can furthermore see that even the exchange of very small signatures, of size just 50, yields already a significant reduction to0.97(a further improvement would requires signatures of size over50,000).
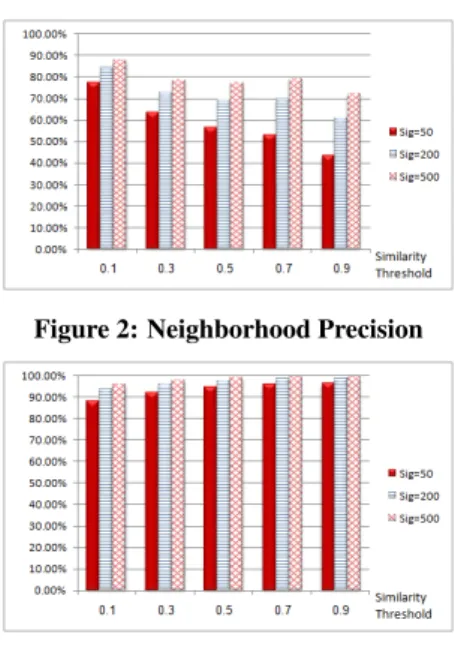
To better understand how the size of the signature affects the computation, we examined the item neighborhoods determined by the signatures. As the base for comparison, we consider the neigh-borhoods determined by the full item vectors. Figures 2 and 3 show the precision (the number of common items divided by the size of the neighborhood determined by the signature) and recall (the num-ber of common items divided by the size of the neighborhood deter-mined by the full item vectors), for increasing threshold values (i.e. smaller neighborhoods) and signatures of size50,200and500.
Larger signatures naturally yield better precision, as they provide more information about the item whose neighborhood is computed. We can also observe some decrease of precision as the threshold value increases. This is because high threshold implies a smaller neighborhood, which is effected more by even small differences of the similarity values. Note however that that the recall is gener-ally very high, (i.e. the neighborhood contains a large percent of the “real" neighbors) and even increases as the threshold increases (as less “noise" is included in the neighborhood). We note that the results depicted in Figure 1 were obtained with neighborhood threshold of0.9. But our experiments with smaller neighborhood
Figure 2: Neighborhood Precision
Figure 3: Neighborhood Recall
thresholds yielded similar results: This is because the effect of the noise introduced by smaller thresholds is practically eliminated as it is weighted (see Equation 1) according to its (low) similarity value. Finally, let us consider performance. Recall that rank prediction in classical centralized CF consists of three main tasks: (1) Com-puting the similarity between items pairs, (2) determining the items neighborhood based of these values, and (3) consequently comput-ing the rank predictions. In the case ofC2F , tasks (2) and (3) remain exactly the same, while task (1) splits into two sub-tasks: (1’) signature computation and (1”) computing similarity using the (significantly smaller) signatures. Interestingly, our experiments show that the overhead of signature computation (task 1’) is com-pensated by the reduction in the similarity computation time, due to the small size of the compared signatures. This yields an im-provement of the overall performance. Figure 4 shows the overall computation time for step 1 (for all item pairsi,j), for varying sig-nature sizes, (compared to the time task 1 takes with the full item vectors). We note that once the similarity values are computed, steps 2 and 3 take just5seconds (for the whole data set - 1.4M predictions). So the overall saving, e.g. when using signatures of size50, is over50%.
To consider a setting where organizations insimilardomains are collaborating, we re-run the above experiments with an alterative random splits of the movies into five subsets. The results were similar to what have seen above, showing that our techniques are applicable to both inter- and intra-domain collaboration.
4.2 User-based CF with Shared items
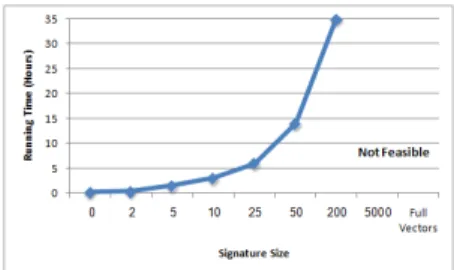
Here one can use both dimension reduction and dimension selec-tion. Before describing our results, recall that in user-based CF, one needs to compute similarities between pairs of users. We first note that due to the huge number of users in the Netflix database,
Figure 5: Running times for Dimension reduction
puting similarity values for all user pairs is a very intensive task. Specifically, the number of pairs is too big to store all similarity values in memory, and requires storing them on disk (yielding sig-nificant I/O overhead). The use of small signatures, (and the shorter time it takes to computed similarity based on such signatures), be-comes essential here. In fact, all our attempts to compute simi-larities with the full user vectors failed, as the computation never terminated. In contrast, things become feasible with small signa-tures, even when taking into consideration the extra time it takes to generate them. To illustrate, Figure 5 shows the over all compu-tation time with signatures computed using dimension reduction. (Users are randomly split here into five organizations). The results for dimension selection were similar.
In terms of recommendations quality, we observed improvements similar to what we have seen in Figure 1, for the Item-based case, (up to signatures of size 200, after which the computation was no longer feasible here). Interestingly, the improvement for signatures generated via dimension selection was slightly better than that of dimension reduction(0.97 vs. 0.98). This is because dimension se-lection allows using the more accurate Pearson similarity measure (see previous section).
To conclude, recall that the dimension reduction algorithm pro-vides a worse case bound on the error in neighborhood values, whereas dimension reduction does not. In practice however the precision and recall values (for the computed neighborhoods) that both algorithm exhibit are similar, and behave as what we have seen above for the Item-based setting.
4.3 Updates
To evaluate the sensitivity of signatures to updates, we started with partial ranking matrix consisting overall of 100K users (20% of the full data set). Then, we gradually added the remaining rank-ings. At each point we compared the quality of the predictions obtained with the signatures computed based on the initial data set, to the one obtained with current signatures. We repeated the exper-iment for signatures computed via dimension selection and reduc-tion and of varying sizes. Our experiments consistently showed that the increase in RMSE value was fairly small - just 0.001 for 100K added users. This demonstrate the adequacy of our lazy update propagation policy, and follows from the typical fairly consistent distribution of user opinions w.r.t. the large number items.
5. RELATED WORK AND CONCLUSION
We considered in this paper a popular class of recommender sys-tems, based on Collaborative Filtering. We argued that a multi-organizationcollaboration, even for organizations operating in dif-ferent subject domains, can greatly improve the quality of the rec-ommendations that the individual organizations provide to their users. To substantiate this claim, we presentedC2F , a system that employs CF in a distributed fashion and improves the quality of the generated recommendations, while reducing the amount of data exchanged between the collaborating parties.
Extending our approach tocontent-basedsystems that also use information about item semantics is a challenging future research.
Previous work on CF in a distributed setting focused on P2P ar-chitecture, typically aiming to speed up the computation. A com-mon solution is to decentralize the P2P network w.r.t the users (items), maintaining a “buddies” table at each pier, pointing to the closest users (items) which are believed to share the same taste (be similar) [8, 17, 16]. Another architecture is presented [5] where the authors describe the recommendation mechanism of the popu-lar TiVo: The network here consists of a centralized server which first accumulates the ratings from all the devices periodically, and then evaluated the similarity between all items (shows). In all these works the network architecture differs fundamentally from our set-ting: they consider network of thousands computers, each holding an assigned small part of the data, (useless by itself), whereas we target a much smaller set of collaborating organizations (servers), each holding an entire data set from its corresponding domain.
Closest to our work is [7] that considers the aggregation of rate predictions from multiple sites. The focus however on similar do-mains with common (user,item) pairs, whereas our solution allows forinter-domaincollaboration, exchanging only a small amount of information between the collaborating parties, yet sufficient for ef-fectively identifying and exploiting the relevant information.
A complementary line of research considers privacy. For in-stance, [14] the authors show how to preserve the privacy of the users by aggregating the data (ratings) among several users, thus eliminating the identification of the ratings, and then uploading the combined information to the server. We note that our dimension reduction algorithm also aggregates user ratings (the multiplication with the matrixMtransform the individual user ratings into linear combination of such ratings) and we intend to study its implication to privacy in future research.
6. REFERENCES
[1] Imdb interface.http://www.imdb.com/interfaces/.
[2] Set-cover problem.http://en.wikipedia.org/wiki/Set_cover_problem. [3] G. Adomavicius and A. Tuzhilin. Towards the next generation of
recommender systems.IEEE TKDE, 2005.
[4] N. Ailon and B. Chazelle. Faster dimension reduction.
Communications of the ACM, 2010.
[5] K. Ali and W. van Stam. Tivo: Making show recommendations using a distributed collaborative filtering architecture.KDD, 2004. [6] J. Bennet and S. Lanning. The netflix prize.KDD Cup, 2007. [7] S. Berkvosky, T. Kuflik, and F. Ricci. Distributed collaborative
filtering with domain specialization.RecSys, 2007.
[8] A. E. H. Byeong Man Kim, Qing Li. A decentralized cf approach based on cooperative agents.WWW, 2006.
[9] S. Deerwester, S. T. Dumais, G. W. Furnas, T. K. Landauer, and R. Harshman. Indexing by latent semantic analysis.JASIST, 1990. [10] I. Fodor. A survey of dimension reduction techniques.
Communications of the ACM, 2002.
[11] I. Guyon and A. Elisseeff. An introduction to variable and feature selection.JMLR, 2003.
[12] Y. Koren. Factorization meets the neighborhood: a multifaceted collaborative filtering model.KDD, 2008.
[13] J. L. Rodgers and W. A. Nicewander. Thirteen ways to look at the correlation coefficient.The American Statistician, 1988. [14] R. Shokri, P. Pedarsani, G. Theodorakopoulos, and J.-P. Hubaux.
Preserving privacy in collaborative filtering through distributed aggregation of offline profiles.RecSys, 2009.
[15] T. I. V., L. D. J, and A. I. Luik. Comparison of overfitting and overtraining.American Chemical Society, 1995.
[16] J. Wang, J. Pouwelse, R. L. Lagendijk, and M. J. Reinders. Distributed collaborative filtering for peer-to-peer file sharing systems.SIGIR, 2005.
[17] J. Wang, M. J. Reinders, R. L. Lagendijk, and J. Pouwelse. Self-organizing distributed collaborative filtering.SIGIR, 2005.