We
met
Mr.
Rajeev
Nanapaneni
of
Natco
Pharma.
With
its
superb
R&D
capabilities,
we
see
Natco
way
ahead
of
peers
in
the
midcap
space.
Though
adverse
ruling
in
Copaxone
will
limit
the
upside,
management
considers
it
an
attractive
opportunity.
At
17.6x
FY12
EPS
of
INR19
Natco’s
base
business
is
fairly
valued.
Successful
monetization
of
FTF
assets
will
create
long
‐
term
value
for
shareholders,
in
our
view.
Sustained
momentum
in
base
business
Natco’s base business earnings have posted 10% CAGR over FY09‐12, driven by strong
momentum in domestic business (38% of sales). Within the domestic, Natco has built a
strong presence in oncology. The company expects its PAT to grow 50% over FY12‐14E
to INR900mn (EPS of INR29 in FY14), driven by Lansoprasole launch in the US.
Copaxone
remains
an
attractive
opportunity
despite
adverse
ruling
Adverse ruling in Copaxone (USD3bn revenues) will limit the upside for Natco from g
Copaxone launch, even as management considers it an attractive opportunity. Natco
believes that even if it gets 6‐12 months window prior to Sep’15, it can still make
USD30‐50mn profit from this opportunity. Moreover, post Sep’15, g Copaxone can
contribute USD15‐20mn recurring profit (EPS of INR2.4) for the company.
Formidable
portfolio
through
strong
R&D
Natco has built a formidable portfolio of ANDA filings in the US (23 filed), driven by
strong analytical and characterizations capabilities. The portfolio includes two most
complex blockbuster drugs Revlimid and Copaxone. We expect significant value
creation over the 3‐5 years as the FTFs/niche products begin to get commercialized.
Outlook
and
valuations:
Monetization
of
US
pipeline
key
While, at 17.6x FY12 EPS of INR19, Natco’s base business is fairly valued, successful
monetization of FTF assets in the US will create long‐term value for shareholders, in
our view. Led by Lansoprazole launch in FY13, we will witness at least one limited
competition product launch in the US over the next couple of years.
NATCO
PHARMA
R&D
@
core
EDELWEISS RATINGS
Absolute Rating NOT RATED
MARKET DATA (R: NATP.BO, B: NTCPH IN)
CMP : INR 340 52‐week range (INR) : 437 / 197 Share in issue (mn) : 31.1 M cap (INR bn/USD mn) : 10.5 / 187.8 Avg. Daily Vol.BSE/NSE(‘000) : 83.5
SHARE HOLDING PATTERN (%)
* Promoters pledged shares (% of share in issue)
: NIL
PRICE PERFORMANCE (%)
Sensex Stock Stock over Sensex 1 month 6.9 (15.0) (21.8) 3 months 0.1 (3.9) (4.0) 12 months (7.5) 28.3 35.9 Manoj Garg +91 22 6623 3302 [email protected] Perin Ali +91 22 6620 3032 [email protected] India Equity Research| Pharmaceuticals
Promoters* 57.1% MFs, FIs & Banks 11.5% FIIs 5.9% Others 25.6% Financials
Year to March FY09 FY10 FY11 FY12
Revenues (INR mn) 4,384 4,361 4,494 5,185 Rev. growth (%) 32.0 (0.5) 3.0 15.4 EBITDA (INR mn) 567 839 944 1,190 Net profit (INR mn) 440 430 535 596 EPS (INR) 15.7 15.3 19.0 19.1 EPS growth (%) 22.2 (2.7) 24.4 0.7 Diluted P/E (x) 21.7 22.3 17.9 17.8
Sustained
momentum
in
base
business
Natco’s base business earnings have posted 10% CAGR over FY09‐12, driven by strong
growth momentum in domestic formulation business (38% of business). Within the
domestic formulation business, Natco has built strong presence in oncology (80% of
domestic formulation business; 18% CAGR over FY09‐12). With over a dozen key products in
the portfolio, the company claims to be a top oncology player in India. Management expects its base business to continue to grow at the current pace, aided by niche launches in the US.
The company expects its PAT to grow 50% over FY12‐14E, to INR900mn (EPS of INR29 in
FY14), driven by Lansoprazole launch in the US.
Chart 1: Revenue mix (FY12)
Source: Company, Edelweiss research
Leader
in
Indian
oncology
segment
despite
late
entry
Natco has emerged as the leader in the niche segment of oncology in India. With more than
a dozen key products in the portfolio, the company has built a formidable presence in
oncology. Also, it has launched some of the difficult‐to‐manufacture products in the
domestic market like Gleevac, which has resulted in 17% CAGR over FY08‐12 to INR1.55bn
in FY12. The Indian oncology segment has been growing at 17‐19% CAGR, driven by: a) Rise
in cancer incidence, b) improved diagnosis and treatment, c) access to cancer therapies, d)
better insurance coverage and e) higher healthcare spending. With landmark judgement for
Nexavar in its favor, where Indian patent officer has granted compulsory license (first of its
kind), we expect growth momentum to sustain going forward.
Domestic formulation 39% Export formulation 12% APIs 27% US Pharmacy 15% Others 7%
Chart 2: Revenue progress in oncology
Source: Company, Edelweiss research
Growing
through
alliances
To establish its presence in the regulated market, Natco follows the strategy of entering into
alliances with pharma majors. It has tied‐up with Mylan (for generic Capoxane; USD3bn
drug), Watson for Revlimid (USD2.3bn drug), Lupin (for Lanthanum Carbonate and Tykerb);
and Dr. Reddy’s Labs (for five oncology products for US and other markets). It is also
planning to launch delayed release Lansoprazole with limited competition (USD3bn
opportunity; possible launch in Sep’12). We are of the view that these products provide
huge upside potential, if launched successfully.
Niche
launches
to
drive
growth
in
US
Amidst lower base (12% of revenue), we expect export formulation business to drive growth
driven by niche launches in the US market. Natco’s export formulation business has
registered 28% CAGR over FY09‐12. Also, the company has built a formidable portfolio of
ANDA filings in the US (23 filed, including 3 FTFs and 2 limited competition products), driven
by strong analytical and characterization capabilities.
Monetization of niche pipeline provides significant upside
Compared to its size, Natco has built a formidable portfolio, which demonstrates its R&D
capabilities. The portfolio in the US includes two most complex blockbuster drugs (FTF,
Revlimid; USD2.3bn opportunity and Copaxone‐ USD3bn revenue in the US). Apart from
this, the company has also filed niche products such as Lansaprazole (USD350‐400mn
generic market; 4 players market; expected launch in Sep’12), Lanthanum Carbonate
(USD110mn opportunity; shared exclusivity; FY14 launch), Tamiflu (FTF, USD240mn, Jun’17
launch) and Tykerb (FTF, USD110mn, Sep’20 launch). Moreover, it is looking to enhance this
pipeline by 2‐3 more niche filings every year, going forward. Currently, it is developing two
complex products in partnership with Dr Reddy’s such as Liposomal Doxorubicin (Doxil) and
Nana‐ particle Paclitaxel (Abraxane). We expect significant value creation from the US ANDA
pipeline over the next 3‐5 years as the FTFs / niche products begin to get commercialized. 0 360 720 1,080 1,440 1,800
FY08 FY09 FY10 FY11 FY12
(I N R mn ) CAGR 19%
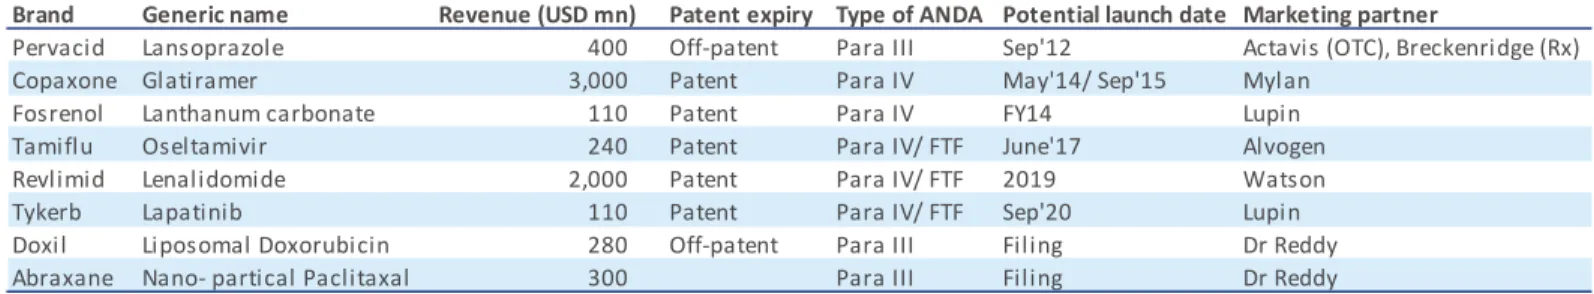
Table 1: Key launches build in the pipeline for US generics
Source: Company, Edelweiss research
Copaxone
remains
an
attractive
opportunity
despite
adverse
ruling
Adverse ruling in Copaxone (USD3bn revenues) will limit the upside for Natco from g
Copaxone launch, even as management believes it to be an attractive opportunity. Earlier,
Mylan (Natco’s partner for Copaxone) had indicated g Copaxone launch in 2HCY12.
However, with this judgment (subject to appeal), Teva (innovator) expects no generic
competition until Sep’15. We highlight that Copaxone is an USD3bn product and compound
patent is going to expire by May’14, while process patent is valid until Sep’15. Management is of the view that though it is difficult to launch the product before May’14, there is probability of it happening before Sep’15 patent expiry. Natco believes that even if it gets 6‐
12 months window prior to Sep’15 (2 generic players as other players will launch post
Sep’15), subject to approval), it can still make USD30‐50mn profit from this opportunity.
Moreover, post Sep’15, g Copaxone can contribute USD15‐20mn recurring profit (EPS of
INR2.4) for the company (90% price erosion, 20% market share for Mylan; 30% revenue
sharing for Natco; 90% profit).
Outlook
and
valuations:
Monetization
of
US
pipeline
key
With its superb R&D capabilities, Natco is way ahead of comparable peers in the midcap space. While, at 11x FY14 EPS of INR29, Natco’s base business is fairly valued, successful monetization of FTF assets in the US will create long‐term value for shareholders. Led by
Lansoprazole launch in FY13, we will witness at least one limited competition product
launch in the US over the next couple of years, which, in our view, will create significant value for its shareholders.
Brand Generic name Revenue (USD mn) Patent expiry Type of ANDA Potential launch date Marketing partner
Pervacid Lansoprazole 400 Off‐patent Para III Sep'12 Actavis (OTC), Breckenridge (Rx) Copaxone Glatiramer 3,000 Patent Para IV May'14/ Sep'15 Mylan
Fosrenol Lanthanum carbonate 110 Patent Para IV FY14 Lupin Tamiflu Oseltamivir 240 Patent Para IV/ FTF June'17 Alvogen Revlimid Lenalidomide 2,000 Patent Para IV/ FTF 2019 Watson Tykerb Lapatinib 110 Patent Para IV/ FTF Sep'20 Lupin Doxil Liposomal Doxorubicin 280 Off‐patent Para III Filing Dr Reddy Abraxane Nano‐ partical Paclitaxal 300 Para III Filing Dr Reddy
Company
Description
NATCO Pharma Limited is an Indian enterprise molded by global aspirations. NATCO
PHARMA is a large integrated company backed by strong R&D capabilities. It has four
finished dosage facility along with two APIs plants. Formulation constitutes around 62% of
revenues followed by 32% from API and 3% from CRAMS. With‐in formulation, Oncology
constitutes around 55% of revenue and it is one of the largest players in Oncology segment in India. NATCO has the credit of having pioneered Time Release Technology in India.
Financial
Statements
Income statement (INR mn)
Year to March FY08 FY09 FY10 FY11 FY12
Income from operations 3,327 4,384 4,567 4,831 5,556
Direct costs 1,698 2,290 2,174 1,880 2,029
Employee costs 416 542 573 641 778
Other expenses 773 986 909 1,366 1,594
Total operating expenses 2,887 3,817 3,656 3,886 4,401
EBITDA 440 567 912 944 1,155
Depreciation and amortisation 90 111 197 147 158
EBIT 350 455 714 797 997
Interest expenses 98 157 147 158 236
Other income 312 268 49 14 35
Profit before tax 564 566 616 653 795
Provision for tax 148 113 137 132 211
Core profit 416 453 479 521 585
Extraordinary items 45 0 0 0 0
Profit after tax 371 453 479 521 585
Less: Minority interests 11 14 (8) (14) (11)
PAT after minority interest 360 440 487 535 596
Adjusted net profit 360 440 487 535 596
EPS (INR) basic 12.8 15.7 17.3 19.0 19.1
Weighted avg Dil equity shares (mn) 28.0 28.0 28.2 28.2 31.2
Dividend payout (%) 11.3 8.7 12.0 10.0 0.0
Tax rate (%) 26.2 19.9 22.2 20.2 26.5
Common size metrics‐ as % of net revenues
Year to March FY08 FY09 FY10 FY11 FY12
Operating expenses 86.8 87.1 80.0 80.5 79.2
Depreciation and Amortization 2.7 2.5 4.3 3.1 2.8
Interest expenditure 2.9 3.6 3.2 3.3 4.3
EBITDA margins 13.2 12.9 20.0 19.5 20.8
Net profit margins 10.8 10.0 10.7 11.1 10.7
Growth metrics (%)
Year to March FY08 FY09 FY10 FY11 FY12
Revenues 35.0 32.0 4.2 5.8 15.0
EBITDA 104.0 28.8 60.9 3.6 22.3
PBT 52.0 0.4 8.8 6.0 21.8
Net profit 51.0 22.0 10.8 9.9 11.4
Balance sheet (INR mn)
As on 31st March FY08 FY09 FY10 FY11 FY12
Equity capital 280 280 282 282 312
Reserves & surplus 1,902 2,311 2,776 3,243 4,409
Shareholders funds 2,183 2,591 3,057 3,524 4,720
Secured loans 886 1,207 1,140 1,963 2,208
Long term provisions 56 55 55 100 98
Minority Intrest & other current liabilities 68 70 49 23 22
Sources of funds 3,192 3,923 4,302 5,611 7,048
Total fixed assets 2,286 2,813 3,014 3,569 4,903
Investments and other assets 1 342 606 1,074 1,092
Inventories 684 803 774 1,022 1,104
Sundry debtors 380 618 572 710 947
Cash and equivalents 260 291 81 324 329
Other current assets 582 393 495 506 808
Total current assets 1,905 2,105 1,923 2,562 3,187
Sundry creditors and others 745 986 915 1,342 1,839
Provisions 50 147 58 1 7
Total CL & provisions 795 1,133 973 1,344 1,845
Net current assets 1,110 972 950 1,218 1,342
Net deferred tax (204) (205) (268) (251) (289)
Uses of funds 3,192 3,923 4,302 5,611 7,048
Adjusted BV per share (INR) 114 140 153 199 226
Note: FY11‐12 are not comparable to FY08‐10 due to changes in the schedules format as per new guidelines
Free cash flow (INR mn)
Year to March FY08 FY09 FY10 FY11 FY12
Net profit 360 440 487 535 596
Depreciation 90 111 197 147 158
Gross cash flow 462 607 804 772 754
Less:Changes in WC 22 6 (58) (98) (119)
Operating cash flow 484 613 746 675 635
Less: Capex (677) (544) (375) (959) (1,175)
Free cash flow (193) 69 371 (285) (540)
Profitability & liquidity ratios
Year to March FY08 FY09 FY10 FY11 FY12
ROAE (%) (on adjusted profits) 11.3 11.2 11.3 9.5 8.5
ROACE (%) 11.9 12.5 16.9 15.1 14.8
Inventory days 75.0 66.8 61.9 77.2 72.5
Debtors days 41.7 51.4 45.7 53.6 62.2
Payable days 81.7 82.1 73.1 101.4 120.8
Cash conversion cycle 35.0 36.2 34.5 29.4 13.9
Current ratio 2.4 1.9 2.0 1.9 1.7
Debt/EBITDA 2.1 2.2 1.3 2.2 2.0
Interest coverage 0.2 0.3 0.2 0.2 0.2
Fixed assets t/o (x) 1.5 1.6 1.5 1.4 1.1
Valuations parameters
Year to March FY08 FY09 FY10 FY11 FY12
Diluted EPS (INR) 12.8 15.7 17.3 19.0 19.1
Y‐o‐Y growth (%) 48.0 22.2 (2.7) 24.4 0.7 CEPS 16.1 19.6 24.3 24.2 24.2 Diluted P/E (x) 26.5 21.7 22.3 17.9 17.8 Price/BV (x) 3.0 2.4 2.2 1.7 1.5 EV/Sales (x) 3.7 2.8 2.7 2.6 2.2 EV/EBITDA (X) 28.3 22.0 14.9 13.2 10.5
Company Absolute reco Relative reco Relative risk Company Absolute reco Relative reco Relative Risk
Apollo Hospitals Enterprise HOLD None None Aurobindo Pharma HOLD SU H
Cadila Healthcare HOLD SP L Cipla HOLD SP L
Dr.Reddys Laboratories HOLD SP M Glenmark Pharmaceuticals BUY SO H
Lupin BUY SO M Ranbaxy Laboratories REDUCE SU H
Sun Pharmaceuticals Industries HOLD SO L Torrent Pharmaceuticals BUY SO H
ABSOLUTE RATING
Ratings Expected absolute returns over 12 months
Buy More than 15%
Hold Between 15% and - 5%
Reduce Less than -5%
RELATIVE RETURNS RATING
Ratings Criteria
Sector Outperformer (SO) Stock return > 1.25 x Sector return Sector Performer (SP) Stock return > 0.75 x Sector return Stock return < 1.25 x Sector return Sector Underperformer (SU) Stock return < 0.75 x Sector return
Sector return is market cap weighted average return for the coverage universe within the sector
RELATIVE RISK RATING
Ratings Criteria
Low (L) Bottom 1/3rd percentile in the sector
Medium (M) Middle 1/3rd percentile in the sector
High (H) Top 1/3rd percentile in the sector
Risk ratings are based on Edelweiss risk model
SECTOR RATING
Ratings Criteria
Overweight (OW) Sector return > 1.25 x Nifty return
Edelweiss Securities Limited, Edelweiss House, off C.S.T. Road, Kalina, Mumbai – 400 098.
Board: (91‐22) 4009 4400, Email: [email protected]
Vikas Khemani Head Institutional Equities [email protected] +91 22 2286 4206
Nischal Maheshwari Co‐Head Institutional Equities & Head Research [email protected] +91 22 4063 5476
Nirav Sheth Head Sales [email protected] +91 22 4040 7499
Coverage group(s) of stocks by primary analyst(s): Pharmaceuticals
Apollo Hospitals Enterprise, Aurobindo Pharma, Cadila Healthcare, Cipla, Dr.Reddys Laboratories, Glenmark Pharmaceuticals, Lupin, Ranbaxy
Laboratories, Sun Pharmaceuticals Industries, Torrent Pharmaceuticals
Distribution of Ratings / Market Cap
Edelweiss Research Coverage Universe
Rating Distribution* 104 60 18 183
* 1 stocks under review
Market Cap (INR) 114 58 11
Date Company Title Price (INR) Recos
Recent Research
01‐Jul‐12 Pharma US Supreme Court upheld
healthcare reform; positive for
Indian pharma; Sector Update
21‐Jun‐12 Pharma Domestic Pharma Monthly
Review; Monthly Review 20‐Jun‐12 Cadila Helathcare Positives on Horizon; Visit Note 721 Buy > 50bn Between 10bn and 50 bn < 10bn
Buy Hold Reduce Total
Rating Interpretation
Buy appreciate more than 15% over a 12‐month period Hold appreciate up to 15% over a 12‐month period Reduce depreciate more than 5% over a 12‐month period
DISCLAIMER General Disclaimer:
This document has been prepared by Edelweiss Securities Limited (Edelweiss). Edelweiss, its holding company and associate companies are a full service, integrated
investment banking, portfolio management and brokerage group. Our research analysts and sales persons provide important input into our investment banking
activities. This document does not constitute an offer or solicitation for the purchase or sale of any financial instrument or as an official confirmation of any
transaction. The information contained herein is from publicly available data or other sources believed to be reliable, but we do not represent that it is accurate or
complete and it should not be relied on as such. Edelweiss or any of its affiliates/ group companies shall not be in any way responsible for any loss or damage that
may arise to any person from any inadvertent error in the information contained in this report. This document is provided for assistance only and is not intended to
be and must not alone be taken as the basis for an investment decision. The user assumes the entire risk of any use made of this information. Each recipient of this
document should make such investigation as it deems necessary to arrive at an independent evaluation of an investment in the securities of companies referred to
in this document (including the merits and risks involved), and should consult his own advisors to determine the merits and risks of such investment. The investment
discussed or views expressed may not be suitable for all investors. We and our affiliates, group companies, officers, directors, and employees may: (a) from time to
time, have long or short positions in, and buy or sell the securities thereof, of company (ies) mentioned herein or (b) be engaged in any other transaction involving
such securities and earn brokerage or other compensation or act as advisor or lender/borrower to such company (ies) or have other potential conflict of interest
with respect to any recommendation and related information and opinions. This information is strictly confidential and is being furnished to you solely for your
information. This information should not be reproduced or redistributed or passed on directly or indirectly in any form to any other person or published, copied, in
whole or in part, for any purpose. This report is not directed or intended for distribution to, or use by, any person or entity who is a citizen or resident of or located
in any locality, state, country or other jurisdiction, where such distribution, publication, availability or use would be contrary to law, regulation or which would
subject Edelweiss and affiliates/ group companies to any registration or licensing requirements within such jurisdiction. The distribution of this document in certain
jurisdictions may be restricted by law, and persons in whose possession this document comes, should inform themselves about and observe, any such restrictions.
The information given in this document is as of the date of this report and there can be no assurance that future results or events will be consistent with this
information. This information is subject to change without any prior notice. Edelweiss reserves the right to make modifications and alterations to this statement as
may be required from time to time. However, Edelweiss is under no obligation to update or keep the information current. Nevertheless, Edelweiss is committed to
providing independent and transparent recommendation to its client and would be happy to provide any information in response to specific client queries. Neither
Edelweiss nor any of its affiliates, group companies, directors, employees, agents or representatives shall be liable for any damages whether direct, indirect, special
or consequential including lost revenue or lost profits that may arise from or in connection with the use of the information. Past performance is not necessarily a
guide to future performance. The disclosures of interest statements incorporated in this document are provided solely to enhance the transparency and should not
be treated as endorsement of the views expressed in the report. Edelweiss Securities Limited generally prohibits its analysts, persons reporting to analysts and their
dependents from maintaining a financial interest in the securities or derivatives of any companies that the analysts cover. The information provided in this document
remains, unless otherwise stated, the copyright of Edelweiss. All layout, design, original artwork, concepts and other Intellectual Properties, remains the property
and copyright Edelweiss and may not be used in any form or for any purpose whatsoever by any party without the express written permission of the copyright
holders.
Analyst Certification:
The analyst for this report certifies that all of the views expressed in this report accurately reflect his or her personal views about the subject company or companies
and its or their securities, and no part of his or her compensation was, is or will be, directly or indirectly related to specific recommendations or views expressed in
this report.
Analyst holding in the stock: No.
Additional Disclaimer for U.S. Persons
This research report is a product of Edelweiss Securities Limited, which is the employer of the research analyst(s) who has prepared the research report. The
research analyst(s) preparing the research report is/are resident outside the United States (U.S.) and are not associated persons of any U.S. regulated broker‐dealer
and therefore the analyst(s) is/are not subject to supervision by a U.S. broker‐dealer, and is/are not required to satisfy the regulatory licensing requirements of
FINRA or required to otherwise comply with U.S. rules or regulations regarding, among other things, communications with a subject company, public appearances
and trading securities held by a research analyst account.
This report is intended for distribution by Edelweiss Securities Limited only to "Major Institutional Investors" as defined by Rule 15a‐6(b)(4) of the U.S. Securities and
Exchange Act, 1934 (the Exchange Act) and interpretations thereof by U.S. Securities and Exchange Commission (SEC) in reliance on Rule 15a 6(a)(2). If the recipient
of this report is not a Major Institutional Investor as specified above, then it should not act upon this report and return the same to the sender. Further, this report
may not be copied, duplicated and/or transmitted onward to any U.S. person, which is not the Major Institutional Investor.
In reliance on the exemption from registration provided by Rule 15a‐6 of the Exchange Act and interpretations thereof by the SEC in order to conduct certain
business with Major Institutional Investors, Edelweiss Securities Limited has entered into an agreement with a U.S. registered broker‐dealer, Marco Polo Securities
Inc. ("Marco Polo").
Transactions in securities discussed in this research report should be effected through Marco Polo or another U.S. registered broker dealer.
Copyright 2009 Edelweiss Research (Edelweiss Securities Ltd). All rights reserved