2017
Computer detection of spatial visualization in a
location-based task
Georgi Iliev Batinov
Iowa State UniversityFollow this and additional works at:https://lib.dr.iastate.edu/etd
Part of theArt and Design Commons,Computer Sciences Commons, and thePsychology Commons
This Dissertation is brought to you for free and open access by the Iowa State University Capstones, Theses and Dissertations at Iowa State University Digital Repository. It has been accepted for inclusion in Graduate Theses and Dissertations by an authorized administrator of Iowa State University Digital Repository. For more information, please [email protected].
Recommended Citation
Batinov, Georgi Iliev, "Computer detection of spatial visualization in a location-based task" (2017).Graduate Theses and Dissertations. 16272.
by
Georgi Iliev Batinov
A dissertation submitted to the graduate faculty in partial fulfillment of the requirements for the degree of
DOCTOR OF PHILOSOPHY Major: Computer Science
Program of Study Committee: Les Miller, Major Professor
Stephen Gilbert Sunghyun Kang Simanta Mitra
Johnny Wong
The student author and the program of study committee are solely responsible for the
content of this dissertation. The Graduate College will ensure this dissertation is globally accessible and will not permit alterations after a degree is conferred.
Iowa State University Ames, Iowa
2017
TABLE OF CONTENTS ACKNOWLEDGEMENTS ... v ABSTRACT ... vi CHAPTER 1. INTRODUCTION ... 1 1.1 General Problem ... 1 1.2 Hypothesis ... 2 1.3 Testbed ... 3 1.4 Contributions ... 4 1.5 Organization ... 4
CHAPTER 2. REVIEW OF LITERATURE ... 6
2.1 Introduction ... 6
2.2 Location of Research Objectives within the Scientific Field ... 8
2.3 Literature Review Structure ... 10
2.4 Neuroergonomics ... 10
2.5 Educational Data Mining ... 12
2.6 Personalized Information Retrieval and Adaptive Hypermedia ... 16
2.7 Multimodal Interfaces ... 18
2.8 Accessible Interfaces ... 20
2.9 Task Detection Software ... 21
2.10 Industrial Interfaces ... 22
2.11 Conclusion ... 23
CHAPTER 3. DESIGN AND PERFORMANCE STATISTICS ... 25
3.1 Paper Map Study ... 26
3.1.1 Team roles ... 27
3.1.2 Design... 27
3.1.3 Results ... 32
3.1.4 Conclusion ... 33
3.2 Stationary Simulation Study... 34
3.2.1 Team roles ... 34
3.2.2 Design... 34
3.2.3 Results ... 41
3.2.4 Conclusion ... 43
3.3 Field and Virtual Reality Study ... 43
3.3.1 Team roles ... 44
3.3.2 Design... 44
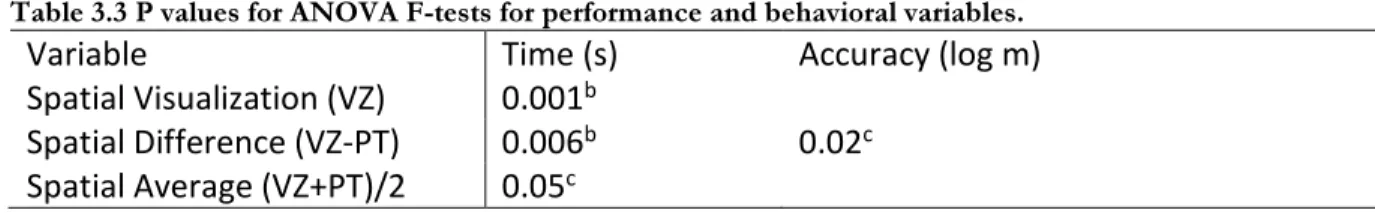
3.3.3 Results ... 51
3.3.4 Conclusion ... 53
CHAPTER 4. BEHAVIORAL STATISTICS ... 55
4.1 Paper Map Study ... 55
4.1.1 Annotation behaviors ... 55
4.1.2 Observer-reported behaviors ... 56
4.1.3 Phase-specific behaviors ... 57
4.1.4 Conclusion ... 63
4.2 Stationary Simulation Study... 63
4.2.1 Conclusion ... 65
4.3 Field and VR study ... 65
4.4 Conclusion ... 67
CHAPTER 5. AUTOMATIC DETECTION ... 68
5.1 Feature Selection ... 69
5.1.1 The need for a low feature-to-instance ratio ... 69
5.1.2 Geo-tagging and location attributes for interface actions ... 73
5.1.3 Data representation ... 75
5.1.4 Algorithms ... 76
5.2 Stationary Simulation Results ... 78
5.2.1 Participant demographics ... 78
5.2.2 Results ... 78
5.3 Field and Virtual Reality Results ... 80
5.3.1 Participant demographics ... 80
5.3.2 Results: Field and Virtual Reality Study ... 81
5.4 Interpretation of Algorithmic Outcomes ... 81
5.4.1 Plurality of algorithms ... 81
5.4.2 Analysis of the best detection schemes ... 83
5.4.3 Conclusion ... 89
5.5 Results in Light of the Existing Literature ... 90
5.6 How to Deploy Detection ... 91
5.6.1 Implementation methodology ... 91
5.6.2 Accuracy expectations for new deployments ... 93
5.7 Conclusion ... 93
CHAPTER 6. POTENTIAL SPATIO-VISUAL ADAPTATIONS ... 94
6.1 Adaptation Leads in the Literature ... 94
6.2 A Directive for Spatio-Visual Adaptation ... 98
6.3 Adaptation Indicators in the Field and Virtual Reality Study ... 102
6.4 Adaptation Recommendations ... 106
6.5 Conclusion ... 108
CHAPTER 7. CONCLUSION... 110
APPENDIX A. PAPER MAP STUDY: SCHEDULING SCRIPTS AND ADVERTISING ... 120
APPENDIX C. PAPER MAP STUDY: TRAINING SCRIPT ... 127 APPENDIX D. PAPER MAP STUDY: OBSERVER CODING SHEET ... 129 APPENDIX E. EKSTROM ET AL. (1976) TEST OF SPATIAL
VISUALIZATION ... 131 APPENDIX F. EKSTROM ET AL. (1976) TEST OF VISUAL MEMORY ... 136 APPENDIX G. KOZHEVNIKOV ET AL. (2006) TEST OF
PERSPECTIVE-TAKING ABILITY ... 145 APPENDIX H. PAPER MAP STUDY: LIST OF CODES IN THINK-ALOUD
PROTOCOLS ... 148 APPENDIX I. PAPER MAP STUDY: POST-STUDY QUESTIONNAIRE ... 149 APPENDIX J. STATIONARY SIMULATION STUDY: ADVERTISING ... 151 APPENDIX K. STATIONARY SIMULATION STUDY: INFORMED
CONSENT FORM ... 154 APPENDIX L. FIELD AND VR STUDY: ADVERTISING AND
SCHEDULING SCRIPTS ... 156 APPENDIX M. FIELD AND VR STUDY: INFORMED CONSENT FORM ... 161 APPENDIX N. FIELD AND VR STUDY: TRAINING SCRIPT ... 164 APPENDIX O. FIELD AND VR STUDY: ADDRESS VERIFICATION
SOFTWARE STORYBOARD\ ... 166 APPENDIX P. FIELD AND VR STUDY OBSERVER CODING SHEET ... 168 APPENDIX Q. STUDY COMPENSATION RECEIPT FORM ... 170 APPENDIX R. PAPER MAP STUDY: INSTITUTIONAL REVIEW BOARD
APPROVAL PAGE ... 172 APPENDIX S. FIELD AND VR STUDY: INSTITUTIONAL REVIEW BOARD
ACKNOWLEDGEMENTS
I am grateful to Dr. Les Miller for his divine and untiring work.
I am also grateful to Dr. Stephen Gilbert, Dr. Sunghyun Kang, Dr. Simanta Mitra, Dr. Johnny Wong, Dr. Sarah Nusser, Dr. Maureen Kilkenny, Dr. Wallace Huffman, Dr. Dirk Reiners, Dr. Leigh Tesfatsion, Dr. L. Emil Kreider, Dr. Steven Huss-Lederman, Dr. Paul Campbell, Dr. Darrah Chavey, Dr. Frederick Anscombe, Dr. Matthew Fike, Dr. Walt
Trahanovsky, Dr. Lucas Beverlin, and Dr. Adrian Silvescu for contributing in both intellectual and personal capacities to this project.
Thanks to Kofi Whitney for working shoulder-to-shoulder with me. Thanks to Dr. Maya Taneva, my mother.
ABSTRACT
An untapped area of productivity gains hinges on automatic detection of user cognitive characteristics. One such characteristic, spatial visualization ability, relates to users’ computer performance. In this dissertation, we describe a novel, behavior-based, spatial visualization detection technique. The technique does not depend on sensors or knowledge of the environment and can be adopted on generic computers. In a Census Bureau location-based address verification task, detection rates exceeded 80% and approached 90%.
CHAPTER 1. INTRODUCTION 1.1 General Problem
Through the proliferation of mobile devices, location-based software services have grown in both popularity and importance. According to Wilson (2012),
“Location-based services (LBS)...provide functions that are location-aware, where the use of such services is predicated on knowledge of where the services are engaged. LBS are oft-referenced with regard to mobile devices, although LBS are not necessarily only used on mobiles.”
A McKinsey Institute report estimated that in 2011, 28% of the U.S. population (87 million) used location-based services (Manyika et al. 2011). This massive user base requires varying levels of data fidelity. Accurate data is critical to organizations like the United States Census Bureau, which depends on authentic knowledge of every address in the nation to inform the distribution of $400 billion of federal monies each year (Census Bureau, 2015). The
importance of location-based services extends to their attached user interfaces, which, from a software engineering perspective, are the loci of human-error management (cf. Maxion and Reeder 2005, p. 26).
Scientific and commercial interests have devoted considerable resources to interface research, but so far, the role of individual differences has been underrepresented. The literature suggests ample potential for improvement. For example, Benyon, Crerar, and Wilkinson (2001) derive the relevance of individual differences from a fundamental disparity between physical and digital artifacts. Information processing predominantly depends on symbol manipulation, so HCI systems are black boxes that can only be interrogated through their displays. By contrast, the user can employ multiple strategies to investigate physical artifacts. Therefore, cognitive differences may express more strongly on computer tasks (pp. 21-22).
Spatial visualization ability is one individual difference that has been associated with user performance. Ekstrom et al. (1976) defines it as “the ability to manipulate or transform the image of spatial patterns into other arrangements” (p. 173). Some known correlates of this aptitude are performance with command-line interfaces (Jennings, Benyon and Murray 1991, Benyon 1993), file system navigation (Vicente, Hayes, & Williges 1987), searching an information retrieval system (Downing, Moore, & Brown 2005), exploring a non-immersive virtual environment (Modjeska & Chignell 2003), web browsing (Zhang and Salvendy 2001), simulated driving (Andrews and Westerman 2012), and remote control of robots (Liu, Oman, Galvan, and Natapoff 2012).
The present work presents a spatial visualization detection technique drawing on behaviors on a location-based task, without external sensors.
1.2 Hypothesis
We hypothesize that on a location-based task that involves address verification,
individual differences in spatial visualization ability lead to discernible variation in behaviors at the user interface, and that an algorithm can recognize the difference from the interface usage data alone.
This hypothesis will be validated if we observe algorithms detecting spatial visualization ability reliably enough to become viable in the real world. To accept the hypothesis beyond a reasonable doubt, we need to obtain favorable results persisting in multiple studies (two for the dissertation) using different software implementations, and in different environments. Based on results presented in the literature, a detection rate of 80% will have outdone prior research. This is because, other than in holistic cognitive fingerprinting (Chang et al. 2013), we have not seen any reports meeting a threshold of 80% correct detection of cognition-related variable. Kapoor,
Burleson and Picard (2007), the classification apex, reported 79.17% accuracy in predicting user frustration. The prediction algorithm drew on a combination of software logs, posture-sensitive chair, galvanic skin response sensor, face tracker, and pressure-sensitive mouse. However, the authors’ achievement in classifying transient emotions is in an altogether different research vein from the proposed dissertation’s aim to detect a complex semi-permanent ability. Furthermore, external sensors are barriers to adoption.
1.3 Testbed
The application testbed is an address verification task performed by quality control officers of the U.S. Bureau of Census. The job of the Bureau is to collect and maintain statistics about the population and economy of the nation, with at least $400 billion of federal funds dependent on this information each year (Census Bureau 2015).
The Bureau of Census address verification task has the following desirable properties: it is a complex, professional, location-based task, and the Bureau’s workforce is numerous and diverse.
The task consists of the following stages (stages 1 and 2 are interchangeable): 1. finding a specific address on a map;
2. locating the same address in reality;
3. ensuring the address is correctly reflected on the map and amending the map if necessary.
Bureau of Census survey takers are a diverse population and data fidelity is entirely dependent on employee competence. A computer device able to detect a user’s suitability for the task during normal job duties opens a pathway to relevant adaptations that can be automated.
The dissertation will show connections between spatial visualization ability and user workflows. The detection technique will only employ user interface logs, because accounting for non-software behaviors requires specialized equipment (microphones, cameras, pressure sensors, galvanic skin response detectors, etc.) and would hinder adoption.
1.4 Contributions
The present work aims to bring four contributions to computer science.
1) Establish strong justification for greater incorporation of individual differences into the applied and theoretical research of intelligent interfaces. To our knowledge, there are few if any reports in the literature of detection of individual differences from professional tasks.
2) Demonstrate for the first time that it is possible for a generic computer device to recognize a cognitive ability. Literature reports of detection of other user variables frequently depend on external sensors and are therefore unsuitable for wide adoption.
3) Show that behavioral-based detection can circumvent the need to know what
constitutes a user error, e.g. whether the address was correctly verified. Such a shortcut would be highly valuable in complex workflows, which are ubiquitous in professional computing, because the need for environmental information would be avoided altogether. As a result, both software and hardware designs can be simple without sacrificing the visualization detection capability.
4) Establish a relationship between spatial visualization ability and user preferences at the interface, with a goal to guide adaptive system design.
1.5 Organization
Chapter 2 surveys the existing literature and finds multiple sources that are almost relevant to the project, and a few that are directly related, due to the relative novelty of the
behavioral approach. Chapter 3 discusses statistical outcomes from three human-subject
experiments. Chapter 4 presents behavioral differences and infers decision models for the Paper Map experiment. Chapter 5 presents detection models and results. Chapter 6 investigates potential adaptations. Chapter 7 concludes the report.
CHAPTER 2. REVIEW OF LITERATURE 2.1 Introduction
User differences have always been of interest to system designers. Benyon, Crerar, and Wilkinson (2001) derive the relevance of individual differences from a fundamental disparity between physical and digital artifacts: information processing predominantly depends on symbol manipulation, so HCI systems are black boxes that can only be interrogated through their
displays. By contrast, there are multiple strategies to investigate physical artifacts. Therefore, cognitive differences may express more strongly on computer tasks (pp. 21-22).
Spatial visualization ability is one individual difference that is frequently tested in
experiments. Ekstrom et al. (1976) defined it as “the ability to manipulate or transform the image of spatial patterns into other arrangements” (p. 173). This aptitude correlates with performance in command-line interfaces (Jennings, Benyon & Murray 1991, Benyon 1993), file system
navigation (Vicente, Hayes & Williges 1987), searching an information retrieval system
(Downing, Moore & Brown 2005), web browsing (Zhang & Salvendy 2001), simulated driving (Andrews & Westerman 2012), and remote control of robots (Liu, Oman, Galvan, & Natapoff 2012).
Automated recognition of user variables is a large field that adjoins multiple disciplines, including computer science, psychology, human–computer interaction, ethnography, industrial design, many branches of engineering, instructional design and industrial ergonomics. There is an extensive list of reports on gathering information about the user, e.g. research on online learning environments like Blackboard and WebCT. But our variable of interest, spatial ability, has never been automatically recognized. In addition, intrinsic cognitive abilities in general are
not represented as target variables. The most similar publications come from the field of adaptive interfaces.
Adaptive interfaces are encountered on any computer system that autonomously changes its interaction mode as a reaction to internal or external cues. Rothrock, Koubek, Fuchs, Haas and Salvendy (2002, pp. 58-63) use the term “variables calling for adaptation” and discuss user variables, situation variables, and system variables. User variables include an individual’s knowledge, performance, workload, personality and cognitive style.
Van Velsen, Van Der Geest, Klaassen, & Steehouder (2008) reasoned about
“personalized” software as systems that employ some type of individual user model. With regard to usability, Van Velsen et al. claimed that “comparing a personalized system with one where the personalization has been removed is deemed a false comparison” (p. 265) based on statements in Höök (1997), Höök (2000), and Bohnenberger, Jameson, Kruger, & Butz (2002), in the sense that personalized systems have extra cross-sectional and longitudinal features which change the overall mix of utilities provided by the system. These are the words of just a few authors who express a zeitgeist of strong desire for personalization – which has rendered it a ubiquitous goal in most commercial and scientific software, and has invested it in multiple research domains.
Reports of user detection differ from our research in several ways:
1. To our knowledge, no attempts have been made to recognize spatial visualization ability or other specific cognitive abilities.1 In contrast, we detect spatial visualization ability, which is linked to performance in many computer tasks. The detection is performed on a professional
task used by the Bureau of Census, and without knowledge of whether the user solved the task correctly.
2. Existing literature frequently uses external sensors. In contrast, our research detects spatial visualization ability based on ordinary user input. Detection is deployable on basic
computing systems.
3. The published accuracy of recognition is relatively low, with correct classification of less than 80% of instances. In contrast, our research uncovered detection rates of 84% and 87%, which we deem practical enough for adoption in the real world.
2.2 Location of Research Objectives within the Scientific Field
User modeling for user interfaces is a topic within a broad area called “human-centered design”. Human-centered design refers to emphasizing user qualities during the software modeling process, as opposed to presenting an interaction protocol and demanding that users adopt it (Norman & Draper, 1986). While the field can be systematized in multiple ways, we will present Gleasure, Feller and O’Flaherty (2012)’s division of human-centered design approaches into four categories: metaphoric, idiomatic, contextualized, and foundational. Metaphoric approaches carry a real-world control (or other) convention over to the interface realm, attempting to gain usability through the familiarity of the metaphor (Gleasure, Feller, & O'Flaherty, 2012). An example would be a generic calculator program such as those shipped with most current operating systems.
Idiomatic design tries to co-opt operators’ knowledge of existing digital systems,
perpetuating interaction modes that are already present in previously produced software. Unlike with the metaphoric approach, interface idioms (as well as linguistic idioms) have no
(Gleasure, Feller, & O'Flaherty, 2012). Idiomatic features include close buttons on most graphical interface windows and blinking cursors in command-line environments.
Contextualized design may be somewhat misleadingly named, as within Gleasure, Feller, and O’Flaherty’s classification it refers to “internal consistency within an application”, hence the term “contextualized”; but in practice, the methodology hinges on aligning the interface to user expectations by observing actual users. In this sense, the real context is the (sample) user base. Relevant investigative techniques span an array from in-depth ethnographic studies to iterative user evaluations (Gleasure, Feller, & O'Flaherty, 2012).
Research from the fourth category, foundational design, focuses on subconscious and unconscious factors in the interaction process, what the authors call “early perceptual and prejudicial aspects on interaction.” Foundational design incorporates findings from neurological and other sciences that may influence human behavior regardless of self-awareness. While one might raise the question whether foundational design is a part of contextualized design, Gleasure, Feller and O’Flaherty distinguish between the two based on how conscious user expectations are. Furthermore, foundational design does not necessarily demand user involvement at the interface creation stage, because readily available findings from relevant sciences, such as psychomotor studies’ outcomes, can be directly slotted into the process. Examples of potentially applicable results are known ergonomic concerns, for example, the difficulty with which the elderly notice some color combinations, or screen illumination levels that promote alertness (Gleasure, Feller, & O'Flaherty, 2012).
The metaphoric, idiomatic, contextualized and foundational design spaces form a continuum where user cognition becomes less and less conscious, with foundational design
reaching into behaviors where awareness is irrelevant (Gleasure, Feller, & O'Flaherty, 2012). The present work elicited behaviors in the subconscious, foundational level.
Many of the papers in this literature survey depend on external sensors such as galvanic skin response sensors or gaze tracking devices. In contrast, our detection technique operates only on ordinary user input and is not computation-intensive, which enables deployment on most computer devices.
2.3 Literature Review Structure
Adaptation cues and responses naturally constitute a systematic description of adaptive interfaces. For our project, we are predominantly interested in cue acquisition subsystems. But the available literature groups along application domains rather than adaptation mechanics - a condition due to the interdisciplinary nature of the domain. In the rest of this chapter, we will present reports from neuroergonomics, educational data mining, personalized information retrieval, adaptive hypermedia, multimodal interfaces, accessible interfaces, task detection software, and industrial interfaces. None of the “comparable” experiments inform our approach to a significant degree due to the relative novelty of the research problem, so we assemble a context of research neighbors instead.
We encountered no research on address verification and cognitive abilities in a software engineering context. What follows will be a listing of research that neighbors ours mostly in the methodological area, but is otherwise of limited utility to the central question: having the software infer spatial ability as it observes the user.
2.4 Neuroergonomics
Parasuraman (2003) defined neuroergonomics as “the study of brain and behavior at work”. The field is an amalgamation of neuroscience and ergonomics, where ergonomics is “a
scientific discipline concerned with the understanding of the interactions among humans and other elements of a system, in order to optimize human well-being and overall system performance” (Mehta & Parasuraman 2013). While such a postulation of the field should be generally applicable to the dissertation’s goals, the current state of neuroergonomics reduces its practical relevance. In particular, the discipline is concerned with brain and body imaging through external sensors, and the focus is on understanding what happens physiologically within the user. Since physiological changes, such as neural activations, can refer to particular
cognitive states in considerable detail, some form of quasi-mind-reading appears to be a long-term goal. At the same time, the necessary equipment for physiological detection is rare and expensive, and therefore unsuitable for the professional tasks we targeted. For example, Sciarini, Grubb, & Fatolitis used an electroencephalograph to examine workload changes on a Stroop task, where a word for the name of a color is presented in a different color to induce cognitive dissonance. The authors detected higher workload when the named color and the actual color were mismatched, but their results depended on the presence of an expensive external device and did not include automatic prediction. Similarly, Sciarini, Fidopiastis, & Nicholson (2009) were able to associate inter-beat intervals of the heart to spatial ability during a Tetris-like task, but attempting to replicate their results would require an electrocardiograph to be attached to a participant – a condition unfavorable to our goal of using generic computer devices for prediction.
Reeves et al. (2007); and Reeves & Schmorrow (2007) survey older adaptive systems triggered by physiological signals.
2.5 Educational Data Mining
The field of educational data mining frequently includes user modeling. Romero & Ventura (2010) define educational data mining as “an emerging interdisciplinary research area that deals with the development of methods to explore data originating in an educational context. EDM uses computational approaches to analyze educational data in order to study educational questions” (p. 1). The major sub-fields are educational hypermedia and intelligent tutoring. Calvet Liñán & Juan Pérez (2015) distinguish educational data mining from learning analytics along several dimensions. The most salient difference is that learning analytics is primarily concerned with empowering human decisions and strategic involvement, while educational data mining places an emphasis on automated discovery and adaptation (pp. 105-106). We next present several research reports from the field that are related to our project.
Antonenko, Toy, & Niederhauser (2012) reported two cases of student workflow differentiation based on cluster analysis of server logs of an online learning environment. Their research follows a user modeling pattern that persists throughout the field of educational data mining: decision models describe states of learning, a highly mutable variable, which makes them only marginally useful for our purpose, which is to investigate a cognitive competence that is immutable in the short term. In the first experiment, education students were asked to assume the role of high-school teachers and write a report recommending solutions to a school incident. Based on server logs of time spent visiting relevant resources, irrelevant resources, and writing, participants were grouped into “discriminating investigators”, “non-discriminating
investigators”, “non-discriminating writers” and “writers”. Investigators spent more time visiting resources than writers, and discriminating participants devoted less time to irrelevant resources. Clustering identified non-discriminating investigators as having an inferior strategy.
In the second experiment, collaborating groups of three or four students had to select a mortgage plan given a complex list of requirements. Cluster analysis pointed at high-performers spending more time working on tailoring the problem submission and progressing at a steady pace, while low-performers spent more time visiting the available information resources and also started working late. In this report, we see some strategy differentiation between high and low performers, a workflow outcome that is crucial to the success of this dissertation. What is less useful to our research effort is that the strategy differentiation is an isolated observation not connected to cognitive aptitudes.
Other recent examples in hypermedia-based educational data mining include Del Puerto Paule-Ruiz, Riestra-Gonzalez, Sánchez-Santillan, & Pérez-Pérez (2015), who mined six
association rules from hypermedia logs that inferred whether a student would pass or fail a course with greater than 97% accuracy. Xing, Guo, Petakovic, & Goggins (2015) compared the performance of genetic algorithms, Naïve Bayes, and several other machine-learning algorithms to predict final grades in an online mathematics course. Campagni, Merlini, Sprugnoli, & Verri. (2015) used clustering and sequential pattern algorithms to infer that college students who kept close to the ideal sequence of computer science exams during their college career graduated faster and with higher grades. These reports are interesting in associating behaviors with final outcomes, but they have a limit in their utility to the dissertation work, because the target variable, learning performance, is highly volatile.
The other part of educational data mining, Intelligent Tutoring Systems, emphasizes workflow analysis and has an ongoing interest in user modeling. Older papers that inform the background of our research include Kinnebrew & Biswas (2012), who identified frequently occurring online reading patterns for low-performers and high-performers on a climate change
study topic. The source data was the sequence of links visited and the time taken with each link. High-performers tended to re-read important pages and were productive in both long and short reading sessions, while low-performers were more successful in long reading sessions and first-time reads. While interesting from a data mining perspective, the report by Kinnebrew and Biswas is representative of its field in being concerned primarily with learning performance, a target variable we already noted is volatile. The takeaways for our research from this
neighborhood in the literature are mostly about recognition mechanics and, to a much lesser extent, about cognitive properties of human subjects..
A common type of user modeling in intelligent tutoring systems relies primarily on the correctness of student answers. Koedinger, McLaughlin & Stamper (2012) created models from large sets of student answers to automated tutors’ questions. The answers were coded as correct and incorrect, and a student model consisted of a sequence of questions and the expected probability of failure on each one. The probability of failure was predicated on student
proficiency, number of learning concepts involved, difficulty per concept, and experience with the concept. The authors data-mined the models to find superior concept combinations for the tutors. In a good student model, the probability of error was relatively stable and declining. Erratic jumps in failure rates or progressively increasing difficulty indicated a problematic teaching sequence. To maximize predictive power (root mean square error of the predicted sequence of correct-incorrect responses), the researchers regrouped concepts with a limited-brute-force method. New answer-concept combinations were formed by iteratively mutating existing models with portions of man-made models. Those models were created mostly independently by teachers and not expected to be remixed in a model search. The brute-force approach discovered combinations with higher predictive power than man-made models (which
to that point were considered the standard), and more importantly, the improvements were localized to particular spots in the question sequences, pinpointing problematic teaching areas that had eluded human experts.
Waalkens, Aleven, & Taatgen (2013) tested three different approaches to tutoring single-variable linear equations. One tutor only allowed students to use the standard strategy for solving an equation, as taught in middle schools in the United States. Another tutor allowed students to use minor variations on the standard strategy, and a third accepted all possible solution paths. The authors found that allowing strategy variations improved learning, but did not find significant differences in teaching effectiveness between the multi-strategy tutor and the
standard-strategy-with-variations tutor. This finding is relevant to our research in suggesting that the effort to accommodate multiple workflows in software pays off even for a highly constrained problem like single-variable equations.
Galán & Beal (2012) used EEG signals to predict student success on SAT-level
mathematical problems. In this case, the cognitive model consisted of two brainwave functions denoting workload and engagement. The engagement signal predicted the first error in 80 percent of the cases based on the first 20 s of sensor data. The authors suggested adding a non-intrusive EEG module to intelligent tutoring sessions to help students stay interested in a problem. This research is relevant to the proposed dissertation in its methodology: employing machine learning techniques to infer a cognitive variable. But the invasive external sensors create a distance between the work and our project goal.
In a recent sensor-oriented report, Petersen, Pardos, Rau, Swigart, Gerber, & McKinsey (2015) predicted chemistry performance on an intelligent tutoring system from gaze tracking variables, with 66% accuracy. Their efforts showcase a drive in the community to improve tutor
adaptivity by knowing more about the user, while the relatively low accuracy illustrates how challenging user inference is even with a sophisticated external sensor. However, their variables of interest, learning gains and problem-solving performance, do not directly relate to our
variable, spatial visualization ability.
Argenta and Hale (2015) provide another example of the ongoing interest in inferring user state in intelligent tutoring systems. They reported automatically reordering learning modules within an educational game based on pre-test result and in-game scores, in order to maximize initial learning and subsequent retention. While the methodological story of how they connected user assessment with tutoring presentation is interesting to us, our research focuses on professional tasks in the real world which cannot be scored independently by the computer due to their open-ended nature.
The takeaway narrative from the educational data mining literature spanning thousands of articles is that there is high ongoing interest in inferring user states, and in particular in linking learning gains to user modeling. However, the variables of interest are not connected to our spatial visualization detection, thereby limiting the utility of educational data mining approaches to the methodologies involved.
2.6 Personalized Information Retrieval and Adaptive Hypermedia
User modeling is a foundational aspect in the domains of personalized information retrieval and adaptive hypermedia. These two domains have considerable overlap with
educational data mining, which was covered in the previous subsection, and which constitutes a exceptionally large corpus of research reports. In this subsection, we will briefly cover
applications outside of formal education. Our interest will be perfunctory due to the insufficient relevance of user models available in this space.
According to Steichen, Ashman, & Wade (2012), personalized information retrieval “typically aims to bias search results towards more personally relevant information by modifying traditional document ranking algorithms”, while adaptive hypermedia biases “content retrieval and presentation by adapting towards multiple characteristics. Those characteristics, more typically called personalisation ‘dimensions’, include user goals or prior knowledge” (p. 1) In these two domains, personalization is achieved through content or result selection and is based on what topics were visited by the user. Steichen, Ashman, & Wade (2012) and Knutov, De Bra, & Pechenizkiy (2009) provide reviews of older adaptive hypermedia papers.
User modeling in the information retrieval domain, in one form or another, is often based on browsing or search histories augmented with rules or other structures, and the models
themselves are information topic aggregations that are of interest to the user. A recent example from this research vein can be found in de Campos, Fernández-Luna, Huete, & Vicente-Lopez (2014), who express a popular view: “An accurate representation of the user profile is very important in order to obtain good retrieval results” (p. 1281). In their report, the authors modified a political document search engine algorithm to accommodate individual user models and serve more relevant results. Another recent study, Kotzyba, Siegert, Gossen, Wendemuth, & Nürnberger, (2015), investigated exploratory voice-controlled search specifically tailored for children in third and fourth graders. The drawback of the report was that it described a pilot-sized study with only five children tested. The user models were individual in nature and needed further research to be able to generalize outcomes.
Thomas, Bailey, Moffat, & Scholer (2015) estimated users’ utility from search tasks, expressed as a user-desired number of relevant search results. The independent variables included search query length in characters, individual search word length, and several more
complicated arithmetically-derived query-related characteristics, as well as a user’s past search profile. Four factors diminish the applicability of this report to our investigation. First, the target variable, user utility from searching, is far removed from spatial visualization as a
cognitive ability. Second, a user’s utility of search results cannot be known with certainty even if the user reported a particular number of desired relevant results, as users themselves may not be aware of what their utility thresholds are. Third, the prediction performed relatively poorly against a baseline. Fourth, utilizing individual search profiles for each participant that were unrelated to the experiment of the study weakens the ability to predict a user’s utility if these profiles were absent.
Brennan, Kelly, and Arguello (2014) investigated information retrieval tasks and associated higher spatial visualization ability with visiting and abandoning more search engine result pages, and with longer search queries. This is a particularly encouraging report, because it demonstrated behavioral differences between low- and high-spatial-visualization participants. We will go into more detail into this publication in Chapter 6, as it informs our understanding of the connection between spatial visualization and potential adaptations.
Overall, our impression from the domains of adaptive hypermedia and personalized information retrieval was that, on one hand, user models did not investigate variables applicable to our research, or, alternatively, if the user variables were relevant, the reports did not contain attempts at detection.
2.7 Multimodal Interfaces
The multimodal interfaces domain is concerned with human-computer interaction occurring through visual, aural and haptic channels. User modeling in this field can be elaborate due to the presence of multiple information streams from the variety of sensors and effectors.
Dumas, Lalanne, & Oviatt (2009) present an overview of older papers. The field overlaps with educational data mining, and some of the papers surveyed in that subsection of the literature review are relevant in the multimodal interfaces domain. For example, Petersen, Pardos, Rau, Swigart, Gerber, & McKinsey (2015) predicted user learning from an intelligent tutoring system from electroencephalograph feeds, while Galan and Beal (2012) used an electroencephalograph to predict success on SAT-level mathematical problems.
User modeling in multimodal interfaces is interesting to us due to potentially suggesting approaches to harvesting and processing data for automated inference of spatial ability.
However, to the extent we have surveyed the literature, we have not encountered a report that directly informs that goal. Instead, recent examples in the field classified student dialogue utterances based on gestures and postures (Ezen-Can, Grafsgaard, Lester, & Boyer 2015), predicted learning style on a basic mechanical engineering task from speech, gesture and electro-dermal sensors (Worsley & Blikstein 2015), predicted user choice of graphical or voice interface (Schaffer, Schleicher, & Möller 2015), or predicted mind wandering while reading electronic text from gaze tracking (Bixler & D’Mello 2015). Worsley & Blikstein (2015) presented more elaborate user models, but used external sensor instrumentation and did not relate to spatial visualization. Schaffer, Schleicher, & Möller (2015) used a generalized utility user model to predict what they suspect are individually differentiated users again with the help of external sensors, and their variable of interest is not pertinent to our research. Bixler & D’Mello (2015) are representative of a large and long-running gaze-tracking research direction that has had mediocre success in predictive accuracy, with this instance reporting 72% correct classification over a baseline of 60%. Overall, the multimodal interfaces domain is a potential source of technique inspiration in user modeling, but does not inform our research substantially.
2.8 Accessible Interfaces
The domain of accessible interfaces and assistive technologies, however, does provide previous research that is relevant to our work. There are documented efforts to create adaptive applications to furnish personalized aid based on user interactions alone. Taylor, Sr., et al. (2009) were able to automatically modify the appearance of a web page presented to older adults in order to minimize errors on a web use task. The adaptation was triggered by interaction errors: mouse-click errors, scrolling errors, and content access errors. The resulting system provided performance that was not significantly different from the performance of a system where a psychologist had determined the interface customizations for the users. Both the adaptive system and the psychologist-determined system exhibited considerably better performance than the baseline, non-adaptive system. Unlike Taylor, Sr., et al. (2009), we focused on a substantially complicated map survey task. Furthermore, we did not tackle accessibility challenges, but rather more demanding workflow differentials among physiologically capable users.
Another relevant effort with the goal of improving accessibility for older adults is Hourcade et al. (2010). The authors’ system, PointAssist, detected mouse-pointing errors
exhibited by the elderly and selectively turned on pointer slowdown to assist the user with hitting the interface target. Again, our goal is not accessibility, but support for physiologically capable users. Additionally, our research pursues a more complex workflow efficiency improvement.
Gonzalez-Rodriguez et al. (2009) introduced GADEA, an interface personalization system which employed a mixture of adaptive and adaptable behavior. The system aimed to improve accessibility, and personalized user-facing dialogs for ability differentials like typing speed and vision accuracy. Only dialogs were monitored and adapted, with fuzzy logic
on questions about age, disabilities, and personal preferences, asked in the beginning of the interactive session. Additionally, for adaptivity, GADEA included background monitors that tracked user behavior at a dialog. They measured typing speed, pointing speed, mouse motion accuracy, user reaction time and others. Numeric readings of these variables were converted to categories, e.g. “low visual precision”, and used in the fuzzy logic aggregator. Its output was categorical and could be converted back to percentage values for scaling visual objects. An example adaptation rule was:
IF USER_MOVEMENT_PRECISION IS LOW AND USER_VISUAL_PRECISION IS HIGH THEN INTERACTIVE_OBJECT_SIZE IS BIG.
The authors piloted the system with 26 participants divided into five groups according to their visual accuracy. GADEA created dialogs specific to each group for five separate messages, resulting in 25 dialogs in total. Participants were asked to indicate their preferred dialog out of the five tailored choices for each message. The authors reported percentage of participant preferences that matched GADEA’s suggested personalization.
There are multiple methodology leads in the GADEA framework, but it did not infer user cognitive ability and took a “dragnet” approach to usability, which is quite useful for specific applications such as critical systems monitoring.
2.9 Task Detection Software
Task detection is a domain tangentially relevant to our research in attempting to infer user workflows in advanced environments. Two example older task detection publications are Rath, Devaurs, & Lindstaedt (2010) and Rath (2010). The authors used machine learning techniques to classify interactive tasks on desktop computers. The interactive tasks were complex and spanned
multiple applications. The authors constructed classification features from document content, application identifiers (e.g. Microsoft Word), window names, user actions, intra-application interface tracking (through Microsoft’s accessibility framework), and users’ application-switching patterns. Interface events and interface components were highly ranked as
classification attributes. A recent report on task detection appeared in Mirza, Chen, Hussain, Majid, & Chen (2015), where the authors attempted to discriminate between desktop activities during multitasking. While there is superficial likeness between papers in this area and our research - the user modeling features include graphical user interface events - the goals in the field are completely dissimilar from our direction of investigation, and therefore the utility of the literature is limited to possibly intriguing data-mining techniques.
2.10 Industrial Interfaces
User modeling application domains presents itself in systems supporting industrial and military operators: fighter pilots, industrial process attendants, air traffic control personnel and others. There is a sizable collection of publications detailing context-aware interfaces for industrial and military workflows, but the presented systems do not rely on user characteristics alone. In almost all cases, there are other environmental sensors that inform the software. In contrast, the proposed dissertation will rely only on ordinary user input to make decisions.
In this domain, an older publication that only considered user characteristics is Yen & Acay (2009). Their system changed the user interface to an air traffic control task based on detected user errors, completion time, and number of user actions, complemented by mutations introduced by a genetic algorithm. The adaptation and evaluation process was sequential and iterative:
1. users completed the task on one interface variant,
2. performance was used to rank the current interface against all previously tested variants,
3. a set of new interfaces was generated via the genetic algorithm, and 4. the process was repeated 80 times.
In case the genetic algorithm produced multiple interfaces in a single generation, the authors would only present a single variant for human user evaluation, discarding the rest by extrapolating performance based on the observed mean and variance from historic evaluations. The underlying assumption for the extrapolation appears to be that user performance has a Gaussian distribution with the historically observed mean and variance. The utility of Yen & Acay’s work to our dissertation project is limited, because their framework made it possible to know when the user committed an error.
A relatively recent interface project with industrial implications is presented in Chang et al. (2013). The authors developed a personal keystroke authentication system based on inter-keystroke timings during typing tasks. The software was aware of the individual cognitive idiosyncrasies of its users exhibited in their inter-keystroke delays, being able to correctly identify the user with precision exceeding 98%. Since the research project is aimed at an overall cognitive “fingerprint” of a user, we cannot directly connect the outcomes to our research. However, the sequential and timing user input features used in the recognition task inform the machine-learning methodology we intend to use for the dissertation project.
2.11 Conclusion
In this chapter, we touched on an assembly of fields that contain publications which are “research neighbors” to the present work in predominantly methodology. More generally, we
have not been able to discover reports investigating persistent cognitive abilities within a software engineering context. This state of the literature may possibly be due to the scarcity of breakthroughs in classification with the variables that have been attempted so far, as well as to light interest in behaviors from an engineering viewpoint All of the surveyed fields seem to still be moving towards obtaining better results with their primary variables, which are unrelated to our project.
CHAPTER 3. DESIGN AND PERFORMANCE STATISTICS This chapter describes three human-subject experiments investigating individual differences in address verification tasks. The address verification tasks under consideration consisted of the following stages (stages 1 and 2 are interchangeable):
1. find a specific address on a map; 2. locate the same address in reality;
3. ensure the address is correctly reflected on the map and amend the map if necessary. The goals of this chapter are: (a) to convey the scope and intricacy of our data creation efforts; and (b) to present performance results which provide support for this dissertation’s objectives, in the sense that recurring performance differentials may indicate the presence of systematic behavioral differences.
The Paper Map study will be described first. In it, participants verified addresses in the field with pen and paper. The study allowed us to observe between-user differentials in non-software address verification, and therefore establish the credibility of individual difference research in this area.
The second experiment in this chapter is the Stationary Simulation experiment, where participants verified addresses on a tablet device while sitting at a desk. Information about the address location in reality was presented in panoramic pedestrian-perspective photos of
residential neighborhoods. The experiment allowed us to observe a fully controlled environment where both the available information about addresses and the verification workflow were
Lastly, in the Field-and-VR experiment, participants used a handheld device to verify addresses in both the field and a high-fidelity immersive virtual environment. This experiment allowed us to observe participants acting with considerable degrees of freedom.
3.1 Paper Map Study
Spatial visualization ability has been linked to performance on a variety of tasks. Some examples include command-line interfaces (Jennings, Benyon, & Murray 1991, Benyon 1993), file system navigation (Vicente, Hayes, & Williges 1987), searching an information retrieval system (Downing, Moore, & Brown 2005), web browsing (Zhang and Salvendy 2001), simulated driving (Andrews and Westerman 2012), and remote control of robots (Liu, Oman, Galvan, and Natapoff 2012). The existence of these prior reports supported the possibility of individual differences manifesting in address verification.
The design of the paper map study was based on a pen-and-paper protocol to avoid constraints associated with computers. As software and hardware could hamper the user with hidden workflow bottlenecks, removing both would allow the participant freedom of behavior. The literature suggested a second benefit to avoiding technology: if divergent behavior was observed on the core cognitive task, the differentials could be magnified in subsequent computer-based exercises (cf. Benyon, Crerar and Wilkinson (2001), pp. 21-22). A third advantage of a paper-only approach would be to support other computer experiments by providing a baseline of fundamental individual differences in address verification. The capability to compare statistical results from a paper-only study against results from a computer study would improve both plausibility and generalizability of inference.
3.1.1 Team roles
This research study was conducted in collaboration with Kofi Whitney, Les Miller, and Sarah Nusser. Drs. Miller and Nusser acted as faculty advisors, while Kofi Whitney and Georgi Batinov equally shared in the work of designing and executing the study.
3.1.2 Design
The experiment consisted of a cognitive test phase and a field exercise phase. Cognitive testing was performed in a room at the Iowa State University campus, while subsequent field activities occurred in a residential neighborhood of Ames, IA. In the field, twenty-six
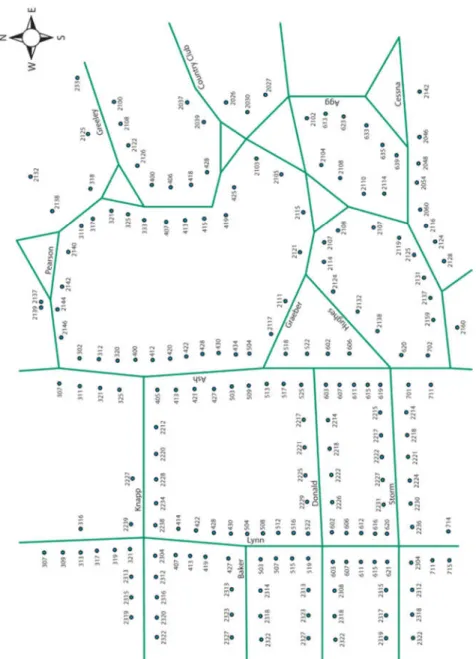
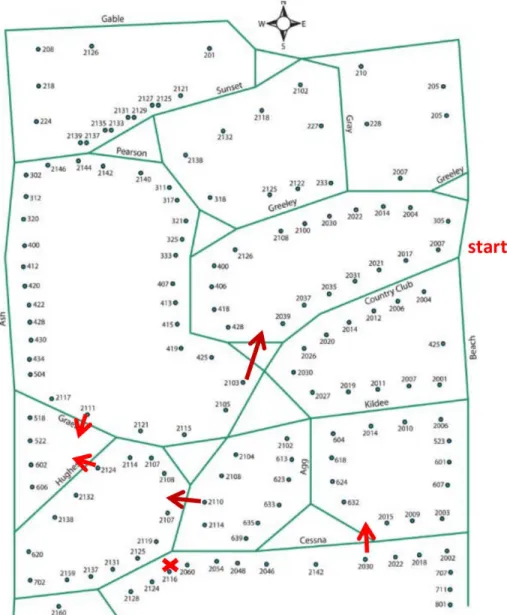
participants were asked to check whether seven addresses in a residential neighborhood were correctly reflected on a paper map, shown in Figure 3.1. Participants had to physically walk through the neighborhood, find the requested addresses, and amend the paper map if it did not accurately reflect reality. They were allowed to write and mark on the map as they saw fit. 3.1.2.1Recruitment, compensation, and compliance
This human-subject experiment was approved after review by Iowa State University’s Institutional Review Board. Participants were recruited through flyers posted on the Iowa State University campus, and public bulletin boards in grocery stores and churches in Ames, IA. Participants were also recruited through a posting on the computerized online Student job board maintained by Iowa State University. The compensation offered was a $10 Target Gift card for participating in the cognitive testing phase, and $20 for participating in the field phase.
Completion of the phases was not necessary for compensation to be offered. Participants were apprised of their rights in the experiment through a standardized Informed Consent form (see APPENDIX B).
Figure 3.1 Field exercise map given to participants 3.1.2.2Cognitive testing phase
During the cognitive testing phase, 99 participants were individually assessed on spatial visualization ability (VZ-2, Ekstrom et al. 1976), visual memory (MV-2, Ekstrom et al. 1976), and perspective-taking ability (Kozhevnikov et al. 2006) (see appendices E, F, and G). The location of the experiment was in an office on the Iowa State University campus. The cognitive
testing phase lasted approximately an hour. At the beginning of the phase, participants had to read and sign an informed consent form. Tests were administered in immediate succession, with one-minute breaks between test sections and three-to-five-minute breaks between testsThirteen participants with spatial-visualization scores over or equal to 14.5 (out of possible 20) or perspective-taking scores over 29 were assigned to the high-spatial group. Thirteen other participants with spatial-visualization scores below 12 (out of 20) or perspective-taking scores below 11 were assigned to the low-spatial group. Perspective-taking scores have no defined maximum, but a score over 25 is considered high. Participants in the high-spatial and low-spatial groups were admitted to the field exercise.
The map contains highly irregular intersections and curving streets in the eastern half, while the western half contains right-angle intersections and straight-line streets. There were three addresses to verify in the “irregular” half of the map, three addresses to verify in the “ordinary” half, and one address to verify on the north-south street bisecting the map. 3.1.2.3Field phase
During the field exercise, 26 participants (7 males) were taken individually to the exact same spot in a residential neighborhood in Ames, Iowa. They were trained on locating addresses in the field and the think-aloud protocol. An observer provided them with a clipboard with a paper map of the neighborhood on the front side (216x279 mm/8x11.5 inches, shown in Figure 3.1), a list of seven addresses taped to the back of the clipboard, and a four-colored ink pen. The next subsection reports on the details of target address selection.
The observer explained the task, the think-aloud protocol, and the possible results of each scenario. The goal of a participant was to determine whether the seven addresses were correctly reflected on the paper map. Participants would have to physically walk to an address in order to
answer the question. If the map contained errors, they were expected to mark or write on the map to indicate the proper position of the address. Participants were further informed that
experimenters were not interested in map errors that were not at the target addresses.
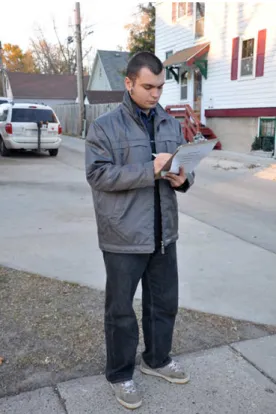
Figure 3.2 Example participant in the Paper Map Study. The paper map is affixed to the front of the clipboard, while a randomized list of target addresses identical to all participants is affixed to the back. The participant is holding a four-colored pen and is able to mark on both map and address list as desired.
Four outcomes were possible for each address: (1) add-to-map, (2) move-on-map, (3) delete-from-map, and (4) confirm-on-map. Participants were told to only work on the requested addresses and to ignore other possible errors on the map. Participants were not told that the map contained no errors outside of target addresses.
After the initial explanation, participants were asked to locate and verify three training addresses in the immediate vicinity on a simplified map with only two streets, while the
At the end of the training session, observers answered any final questions participants may have had. They also explained that they would not talk or answer questions during the experiment, other than to prompt the participant to keep verbalizing or to ask about behavioral details. Observers (1) returned the participant to the exact location where all trainees started; (2) replaced the training map with the full exercise map; and (3) started an audio recorder (a Zoom H2 Portable Stereo Recorder, worn by the participant) and a GPS tracker (a HTC Android smart phone, carried by the observer). The GPS tracker was not given to the participant to avoid interrupting the workflow to time-stamp scenario completions. Additionally, observers walked behind the participant, establishing a close approximation of the exercise path. Observers wrote comments on standardized coding sheets of paper. A participant in the experiment appears in Figure 3.2.
After participants solved their final scenario, observers audio-recorded an exit
questionnaire of 13 items detailing the participant’s perceptions of the exercise (see APPENDIX I).
3.1.2.4Map composition and target addresses
The study map (shown in Figure 3.1) contained two layers. Street layout and labeling were composed from the Census Bureau’s TIGER/Line dataset, located on the Census Bureau website at https://www.census.gov/geo/maps-data/data/tiger-line.html. Address spots and labels were based on a set of parcel centroids furnished by the Story County Geographic Information Services Office. This is a governmental unit in Nevada, IA, USA, online at
http://www.storycountyiowa.gov/index.aspx?NID=103. The address spots were moved on the map to align with buildings visible on geo-referenced satellite photos. The resulting map layout
was an approximation of the Census Bureau’s in-house visual presentation, which is unavailable to units outside the Bureau.
All participants verified the same seven addresses off of an identical randomized list order, and therefore could not benefit from inadvertent route hints. The list could be consulted at all times by flipping the clipboard. The opposite locations of the map and list meant that both could not be consulted at once unless the list or map were detached from the clipboard. This design choice made it obvious when users were checking the list of addresses. Participants were allowed to work on addresses in any order and could return to previously submitted scenarios as many times as they wanted. Only final answers were evaluated for correctness.
3.1.3 Results
The results in this section were published in Whitney, Batinov, Nusser, Miller, & Ashenfelter (2011). Table 3.1 presents the observed correlations between the three cognitive tests. The correlation values (r) are listed together with p values expressing the probability the correlation did not exist given the available test scores.
Table 3.1. Cognitive test score correlations.
COGNITIVE TEST COGNITIVE TEST n r p
Spatial Visualization Visual Memory 26 0.54 0.00 Spatial Visualization Perspective-taking 26 0.44 0.02 Perspective-taking Visual Memory 26 0.36 0.07
The following performance ranges were observed in the study: 30 to 66 minutes for exercise completion times between 30 and 66 minutes, personal distances traveled between 1.10 mi and 1.88 mi (1.77 km and 3.02 km), and 0 to 3 incorrectly completed addresses per exercise. Total time, distance traveled, error pre-detection, and the number of errors made by each participant were correlated with cognitive test scores. Table 3.2 presents the significant
scores were negatively correlated with total time (r = -0.44, p = 0.02) and distance traveled (n = 21, r = -0.65, p = 0.00), revealing that lower-scoring participants tended to take longer and travel farther to complete the exercise. Perspective-taking scores were negatively correlated with total time (r = -0.51, p = 0.01), suggesting that, on average, participants with lower perspective-taking ability were slower in arriving at solutions. Additionally, both spatial visualization scores and perspective taking scores were positively correlated with error pre-detection, which tracks the tendency of participants to notice address errors while initially familiarizing themselves with the map. Correlations with pre-detection reveal that high-ability participants were more likely to detect flaws in the map model without needing cues from reality.
Table 3.2 Correlations of cognitive test scores and performance
COGNITIVE TEST PERFORMANCE METRIC n r p Spatial Viz. Total Time 26 -0.44 0.02 Spatial Viz. Distance Traveled 21 -0.65 0.00 Spatial Viz. Error Pre-detection 21 0.44 0.05 Persp. Taking Total Time 26 -0.51 0.01 Persp. Taking Error Pre-detection 25 0.49 0.01
3.1.4 Conclusion
Overall, the Paper Map study provided evidence that, for an address verification task, increased spatial visualization ability and perspective-taking ability correlate with better
performance. The direction of the statistical connection was congruent with published findings in other exercise types (e.g. command-line interfaces (Jennings, Benyon and Murray (1991)), simulated driving (Andrews and Westerman 2012), remote control of robots (Liu, Oman, Galvan, and Natapoff (2012), suggesting that an address verification task is one more activity that is sensitive to spatial ability components, and spatial visualization ability in particular.
Evidence of performance differentials on the “baseline” task encouraged a search for behavioral differentials.
3.2 Stationary Simulation Study
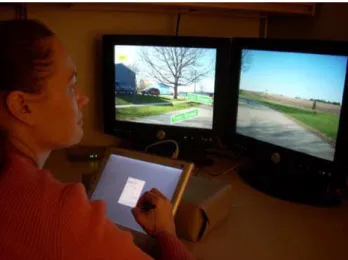
This exercise investigated individual differences in address verification with significant constraints on both software workflow and information available in the panoramic views of the target addresses. Twenty-four participants used address verification software on a tablet device while viewing photos of a neighborhood. Participants were in a stationary seated position for the duration of the exercise, and the photos were displayed on two adjacent monitors (as shown in Figure 3.1). Participants had to amend address locations on the tablet to reflect the information presented on the monitors.
3.2.1 Team roles
This research study was conducted in collaboration with Michelle Rusch, Kofi Whitney, Les Miller, and Sarah Nusser. It was published as Rusch, Nusser, Miller, Batinov, & Whiney (2012). Drs. Miller and Nusser acted as faculty advisors, Michelle Rusch designed and executed the study, Georgi Batinov wrote the software, and assisted with the study design and execution. Kofi Whitney assisted with the study design, executed the study, and contributed to the software. 3.2.2 Design
The study consisted of two phases: a cognitive test phase and a computer exercise phase. 3.2.2.1Recruitment, compensation, and compliance
Participants were recruited through flyers posted on the Iowa State University campus, and public bulletin boards in grocery stores and churches in Ames, IA. The compensation offered was a $10 Target Gift card for participating in the cognitive testing phase, and $20 for
compensation to be offered. Participants were apprised of their rights in the experiment through a standardized Informed Consent form (see APPENDIX K).
3.2.2.2Cognitive test phase
In the cognitive examination portion of the experiment, participants had to solve three psychometric tests in the exact same sequence: Ekstrom et al.’s (1976) VZ-2 Paper-Folding test of spatial visualization ability and Kozhevnikov et al.’s (2006) Perspective-taking test from the Ekstrom et al. (1976) factor-referenced test battery (see Appendices E and G). The location of the experiment was in an office on the Iowa State University campus. The cognitive testing phase lasted approximately an hour. At the beginning of the phase, participants had to read and sign an informed consent form. Tests were administered in immediate succession, with one-minute breaks between test sections and three-to-five-one-minute breaks between tests. All tests by Ekstrom et al. were paper-based, while Kozhevnikov et al.’s Perspective-taking test was carried out on a desktop computer.
3.2.2.3Computer exercise phase
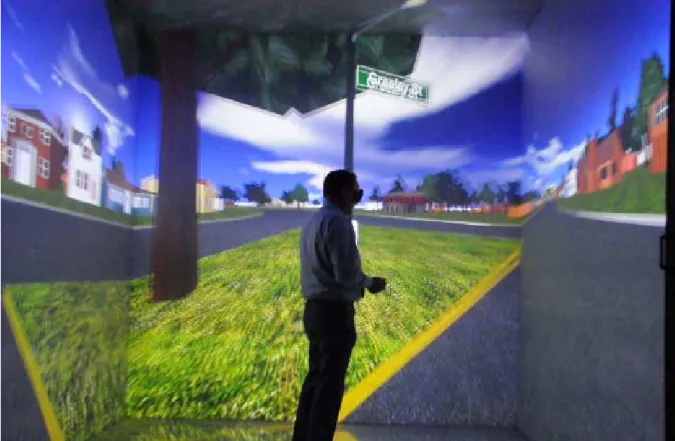
For the computer exercise phase, twenty-four participants (twelve males) were taken individually to a room with the computer tablet and two adjacent twenty-inch LCD monitors shown in Figure 3.3. The location of the experiment was in an office on the Iowa State University campus. In a stationary seated position, participants used address verification
software running on the tablet. Their task was to verify the map location of addresses in a town against photos of the addresses taken from a pedestrian perspective (Figure 3.3). The adjacent monitors showed a combined photographed view of two sides of the street at the target address. The observer explained the nature of the task and asked the participants to complete two untimed training scenarios, which were of similar type and difficulty as the experimental scenarios.
Participants were allowed to ask questions during the training. At the end of the training, the observer offered to answer any additional questions. Figure 3.5 shows a storyboard of the interface for one scenario.
Figure 3.3 Example participant in Stationary Simulation study (photo courtesy of Michelle Rusch). Participant is in a stationary sitting position at a desk, and the verification software is loaded on a tablet computer fixed in a stationary position. The two screens show photos of two sides of a street.
The remainder of this section presents an overview of scenario types and participant workflow. Further detail on the workflow pertains to software specifics and is described in the following “Materials” section.
In the experimental task, participants had to verify ten target addresses. Five scenario types were tested:
a) address needed to be added to the map; b) address needed to be deleted from the map;
c) address needed to be moved to a different location;
d) address was present and required no corrective action; and e) address was absent and required no corrective action.
Each scenario type was tested in two out of ten target addresses. Addresses and their sequence did not vary among participants. The software map and photos depicted Cedar Falls, Iowa.
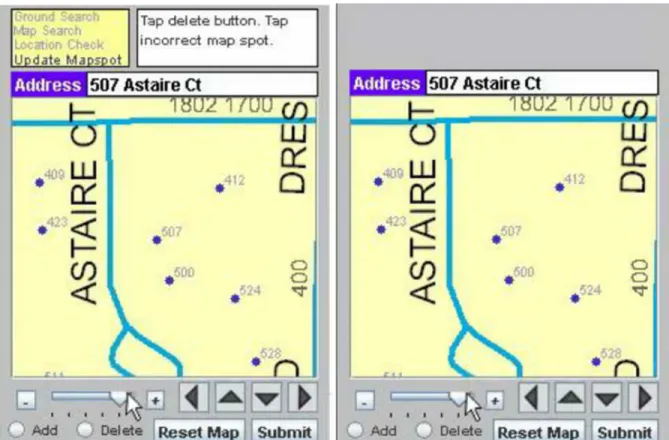
The software for this exercise offered helper questions along the way. Figure 3.2 shows one path through the software, corresponding to scenario (b), “address needed to be deleted from the map”. Participants went through the following sequence while completing a target scenario:
locate the address on the photos;
1) answer a software question of whether the address exists; 2) find the address on the map, if possible;
3) answer a computer question of whether the address is on the map;
4) answer a software question of whether the address is in the correct location; and 5) add, delete, or move the address, if applicable.
3.2.2.4Materials
Georgi Batinov wrote the tablet software for the address verification exercise in the Java 1.5 programming language and the Swing graphical library. The software was loaded onto a Gateway M1300 tablet device with a 500 MHz CPU, 512 MB of random access memory, a 40 GB Hard Disk Drive and a 12.1-inch (307 mm) active matrix color screen with resolution of 1024x768 pixels (246 x 184 mm, see Figure 3.3). For the experiment, the tablet was oriented in landscape mode, with a horizontally positioned wide side of the screen. The dimensions of the software were smaller than the tablet display to more closely emulate the screen real estate of handheld device that could be used for address verification in the field. The interface area dimensions were 2 ¼ inches (57 mm) in width by 3 inches (76 mm) in height and the map area dimensions were 2 1/16 inches (52 mm) in width by 1 7/8 inches (48 mm) in height.
Kofi Whitney wrote the image display software in Java 1.6. Two copies with separate photo sets were loaded on two desktop computers driving 20-inch Dell LCD screens with 4:3 display ratios. The monitors were 16 inches (40.64 cm) wide and 12 inches (30.48 cm) tall. The verification software sent photo display commands to the desktop computers via a wired local area network. The adjacent monitors showed a combined photographed view of two sides of the street at the target address. Both desktops and the tablet ran the Windows XP Professional operating system. Participants used a stylus on the tablet’s touch screen to perform software operations. Every time a participant signaled the start of a scenario, the tablet software commanded the display stations to change the environmental view. At the end of the two training scenarios, the displays were commanded to show red stop lights until the observer finished answering any last questions by the participant. Figure 3.3 displays the tablet computer and the environmental displays as they were used during the experiment.
There were two interface versions presented to participants: the “guided” interface and the “unguided” interface. The guided interface had additional elements compared to the
unguided interface (Figure 3.4.). A yellow box at the top of the guided interface area contained all the steps necessary to complete the current scenario, with the current step highlighted. To the right of the yellow box, a white box contained an instruction on what to do for the current
Figure 3.4 Guided interface (left) and unguided interface (right) (figure taken from Rusch, Nusser, Miller, Batinov, & Whiney (2012).
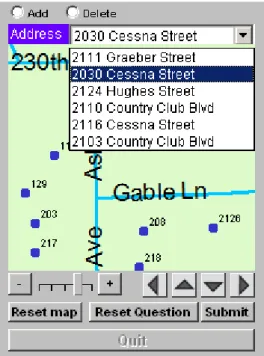
Figure 3.5 presents a sequence of screenshots of the address verification software with the guiding elements visible. The sequence depicts changes in the software interface as a participant proceeded through a type (b) scenario, “address needed to be deleted from the map.” The interface combined a map area (in the center) with a text display of the current target, pan and zoom buttons, “ add mapspot” and “delete mapspot” radio buttons, an “undo” button with the text “Reset Map”, a “Submit” button, and optionally, a step-by-step instruction list at the top of the interface. The software logged and timestamped all user interface actions (e.g. button clicks) as well as all mouse movement and events.