Workshop report: Training on seasonal
forecasting using the IRI Climate
Predictability Tool and Data Library
Kigali, Rwanda
September 2017
Asher Siebert
Desire M. Kagabo
Floribert Vuguziga
2
Training on seasonal
forecasting using the IRI
Climate Predictability Tool
and Data Library
Kigali, Rwanda, September 2017
Workshop Report
CGIAR Research Program on Climate Change,
Agriculture and Food Security (CCAFS)
Asher Siebert
Desire M. Kagabo
Floribert Vuguziga
Correct citation:
Siebert A, Kagabo DM, Vuguziga F. 2017. Training on seasonal forecasting using the IRI Climate Predictability Tool and Data Library. CCAFS Workshop Report. Wageningen, Netherlands: CGIAR Research Program on Climate Change, Agriculture and Food Security (CCAFS). Available online at: www.ccafs.cgiar.org
CCAFS Workshop Reports aim to disseminate interim climate change, agriculture and food security research and practices and stimulate feedback from the scientific community.
Published by the CGIAR Research Program on Climate Change, Agriculture and Food Security (CCAFS).
The CGIAR Research Program on Climate Change, Agriculture and Food Security (CCAFS) is a strategic partnership of CGIAR and Future Earth, led by the International Center for Tropical Agriculture (CIAT). The Program is carried out with funding by CGIAR Fund Donors, Australia (ACIAR), Ireland (Irish Aid), Netherlands (Ministry of Foreign Affairs), New Zealand Ministry of Foreign Affairs & Trade; Switzerland (SDC); Thailand; The UK Government (UK Aid); USA (USAID); The European Union (EU); and with technical support from The International Fund for Agricultural Development (IFAD).
Contact:
CCAFS Program Management Unit – Wagenigen University & Research, Lumen Building, Droevendaalsesteeg 3a, 6708 PB Wageningen, the Netherlands. Email: [email protected]
Creative Commons License
This Workshop Report is licensed under a Creative Commons Attribution – NonCommercial– NoDerivs 3.0 Unported License.
Articles appearing in this publication may be freely quoted and reproduced provided the source is acknowledged. No use of this publication may be made for resale or other commercial purposes. © 2017 CGIAR Research Program on Climate Change, Agriculture and Food Security (CCAFS).
Cover photo by CIAT Rwanda.
DISCLAIMER:
This Workshop Report has been prepared as an output for the Flagship 4: Climate Services and Safety Nets (previously Flagship 2: Climate Risk Management) under the CCAFS program and has not been peer reviewed. Any opinions stated herein are those of the author(s) and do not necessarily reflect the policies or opinions of CCAFS, donor agencies, or partners. The geographic designation employed and the presentation of material in this publication do not imply the expression of any opinion whatsoever on the part of CCAFS concerning the legal status of any country, territory, city or area or its authorities, or concerning the delimitation of its frontiers or boundaries. All images remain the sole property of their source and may not be used for any purpose without written permission of the source.
4
Abstract
This report summarizes the interactions, discussions, and analyses of Asher Siebert, Post-Doctoral Research Scientist at the International Research Institute for Climate and Society (IRI), during his three-week visit to Rwanda in late August to mid-September 2017 as part of the Rwanda Climate Services for Agriculture project. The project aims to provide climate services widely throughout Rwanda and help farmers better adapt to climate variability and climate change impacts. In doing so, the project seeks to help improve agriculture outcomes and ensure food security. During the visit, trainings were held to discuss seasonal climate forecasting and downscaling methods. A particular national forecast for Rwanda along with downscaled results in
probability of exceedance format for ten Rwandan districts (those in the first two phases of the project) was developed using the IRI Climate Predictability Tool (CPT). A critical component of the project’s mission is capacity building and to that end, a number of staff from the Rwanda Meteorology Agency (Météo Rwanda) were trained in CPT, the IRI Data Library, and the Météo Rwanda maprooms. Further discussions addressed longer-term collaborative work on both climatology and further seasonal prediction work, particularly with regard to El Niño - Southern Oscillation (ENSO) and the Indian Ocean Dipole (IOD). Discussions with experts at International Center for Tropical Agriculture (CIAT) and the Rwanda Agriculture Board (RAB) also focused on the newly developed water balance maprooms and the possibilities of updating these maprooms in the future.
Keywords
Climate information services; Rwanda; Seasonal climate forecast; Climate variability; Adaptation.
About the authors
Asher Siebert is a Post-Doctoral Research Scientist at the International Research Institute for Climate and Society (IRI), Columbia University, New York, USA. Contact: [email protected]
Desire M. Kagabo is the CCAFS Rwanda Climate Services for Agriculture Project Coordinator based at the International Center for Tropical Agriculture (CIAT), Kigali, Rwanda. Contact: [email protected]
Floribert Vuguziga a Senior Meteorologist with the Rwanda Meteorology (Meteo Rwanda) Agency and leads the climate services division of Météo Rwanda based in Kigali, Rwanda. Contact: f.vuguziga@Météo Rwanda.gov.rw
6
Acknowledgements
Institutional and technical support for this work was provided by the International Research Institute for Climate and Society (IRI). Travel support was provided by CGIAR Research Program on Climate Change, Agriculture and Food Security (CCAFS) Flagship 4: Climate Services and Safety Nets with an invitation by the Rwanda Meteorology Agency (Météo Rwanda). Throughout the training period from September 4-September 18, the International Center for Tropical Agriculture (CIAT) in Rwanda hosted the trainees and Dr. Asher Siebert. Desire Kagabo kindly
coordinated meeting and transportation logistics. This report is an output of the Rwanda Climate Services for Agriculture Project, supported by the U.S. Agency for International Development (USAID) – Rwanda and CCAFS. The opinions expressed herein are those of the authors, and do not necessarily reflect the view of the USAID and donors.
CCAFS receive support from CGIAR Fund Donors and through bilateral funding agreements. For details please visit https://ccafs.cgiar.org/donors. The views expressed in this document cannot be taken to reflect the official opinions of these organizations.
Contents
Introduction ... 10
Forecasting work and GHACOF output ... 10
Trainings of Météo Rwanda staff ... 19
Maproom training ... 20
IRI Data Library training ... 22
CPT forecasting training ... 23
CPT GCM validation and probabilistic forecast training ... 25
S2S forecasting training ... 26
Climate dynamics background ... 27
Group exercises and quiz ... 28
Water balance maprooms ... 30
Conclusions and future work ... 33
Appendix 1: Training Agenda ... 34
Appendix 2: Participant List ... 35
8
Acronyms
CCA Canonical Correlation Analysis
CCAFS CGIAR Research Program on Climate Change, Agriculture and Food Security
CGIAR Consultative Group on International Agricultural Research CIAT International Center for Tropical Agriculture
CPT Climate Predictability Tool
CSRD Climate Services for Resilient Development ENACTS Enhancing National Climate Services initiative ENSO El Nino - Southern Oscillation
GCM Global Circulation Model
GeoCOF Geospatial Climate Outlook Forecasting Tool GHACOF Greater Horn of Africa Climate Outlook Forum ICPAC IGAD Climate Prediction and Applications Center IGAD Intergovernmental Authority on Development IOD Indian Ocean Dipole
MJO Madden Julian Oscillation MLR multiple linear regression
PCR Principal Component Regression PFV probabilistic forecast verification
PICSA Participatory Integrated Climate Services for Agriculture RAB Rwanda Agriculture Board
SOND September-December rainy season SST Sea surface temperature
WRF Weather Research and Forecasting Model WRSI Water Requirement Satisfaction Index
Introduction
This report summarizes the interactions, discussions, and analyses of Dr. Asher Siebert, Post-Doctoral Research Scientist at the International Research Institute for Climate and Society (IRI), during his visit to Rwanda from August 28 to September 18, 2017 as part of the Rwanda Climate Services for Agriculture project. During the visit, Dr. Siebert had meetings with staff from CIAT Rwanda, the Rwanda
Meteorology Agency (Météo Rwanda), and the Rwanda Agriculture Board (RAB), and led a two-week training of 12 junior staff from Météo Rwanda. Seasonal climate forecasts for the September-December 2017 rainy season (rainfall totals, onset date, and rainy day frequency) were created and downscaled information from those forecasts for ten target districts (part of phase 1 and 2 of the CCAFS project) were provided to Météo Rwanda and CIAT Rwanda.
The Rwanda Climate Services for Agriculture project seeks to help farmers in Rwanda better manage climate-related agricultural risks and achieve long-term food security. Project planning began in 2015, with project activities began in 2016, and is envisioned to last until 2019. The four main outcome areas are: (1) Climate services for farmers, (2) Climate services for government and institutions, (3) Climate information provision, and (4) Climate services governance. This visit was most aligned with the objectives of outcome area (1), although some aspects of the analysis may be insightful for some of the other outcome areas, particularly, outcome area (3).
Forecasting work and GHACOF output
During the week of August 21-25, 2017, the 47th GHACOF took place in Zanzibar, Tanzania. During the week prior, August 14-18, representatives from the member states’ meteorological services convened to discuss and establish a consensus climate outlook for the region and for individual nations within the Greater Horn of Africa for the upcoming September-December (SOND) 2017 rainy season. This modeling and prediction effort was led by climate scientists at Intergovernmental Authority on Development Climate Prediction and Applications Center (ICPAC) and predictions both at the regional level and country specific levels were made for the SOND 2017
season. Mr. Felix Ndabarase was the meteorologist representative from Rwanda at this meeting.
Due to the fact that the El Niño - Southern Oscillation (ENSO) and Indian Ocean Dipole (IOD) conditions were fairly neutral in the July-September period of 2017, the official regional consensus forecast produced by ICPAC leaned towards near average conditions for much of the region, with some areas forecast slightly towards wetter conditions, while others forecast slightly towards drier conditions. The consensus statement at the regional level for temperature was near or above average
temperatures everywhere within the GHA region. More official details regarding the regional consensus statement are available at the ICPAC website1.
At a country-specific level, several approaches were taken by ICPAC scientists to make seasonal forecasts for individual nations: using sea surface temperature (SST) fields as predictors, using General Circulation Model (GCM) outputs as predictors, running the dynamical regional climate Weather Research and Forecasting Model (WRF), and running predictions using Geospatial Climate Outlook Forecasting Tool (GeoCOF) software. These projections were made by ICPAC staff for Rwanda (shared with Mr. Felix Ndabarase) and for other nations in the region. These
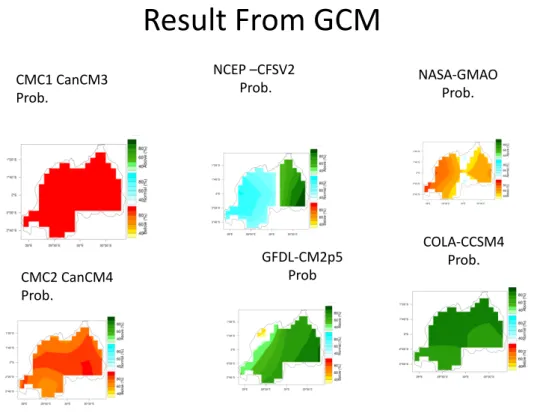
projections were not entirely internally consistent in their narratives: some predicted wetter than normal conditions through much of Rwanda for SOND 2017, some predicted drier than normal conditions through much of Rwanda for SOND 2017, while some others predicted near normal conditions through much of Rwanda for SOND 2017. Some of the outputs of the official Météo Rwanda forecast are shown below: output of several different GCMs (Figure 1), and three forecasts made with IRI Climate Prediction Tool (CPT), WRF, GeoCLIM, and the ensemble GCM (Fig. 2).
12
Figure 1: Probabilistic forecasts from several different GCMs for SOND 2017 rainfall total in Rwanda.
Figure 2: Probabilistic forecasts from several different platforms for SOND 2017 rainfall totals in Rwanda.
Result From GCM
CMC1 CanCM3 Prob.
NCEP –CFSV2
Prob. NASA-GMAOProb.
CMC2 CanCM4 Prob. GFDL-CM2p5 Prob COLA-CCSM4 Prob. GEOCLIM&
GEOCOF Ensemble Model of GCM
WRF SOND Total Precipitation
CFSV2
Probabilistics Forecasted SST Probabistics OBS SST JULY Probabilistic
After the close of the GHACOF, a three-day Climate Services for Resilient
Development (CSRD) technical exchange workshop took place in Zanzibar, Tanzania, August 23-25, 2017. There were roughly 75 participants for this meeting across the different member states of the Greater Horn of Africa region and a range of sectors. Additionally, there were a number of participants from ICPAC, the U.K. Meteorology Office, and from the IRI. During this workshop, the participants gave scientific
presentations and discussed sector specific needs and adaptations as well as maproom tools developed by the IRI. There were a number of Rwandan participants to this technical exchange, including several with health and agricultural affiliations. But the Rwandan participants with a more direct connection to the CCAFS Rwanda Climate Services for Agriculture project included Mr. Felix Ndabarase (Météo Rwanda), Ms. Gloriose Nsengiyumva (CIAT Rwanda) and Mr. Aimable Gahigi (RAB).
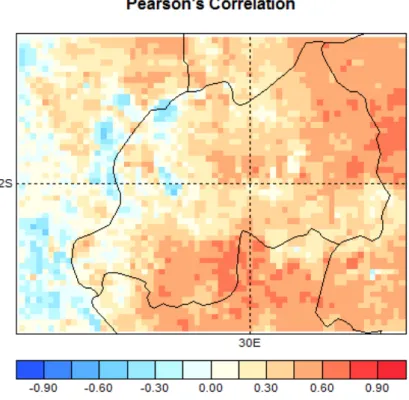
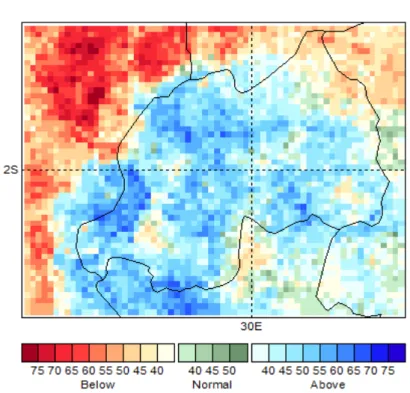
Following the GHACOF meeting and CSRD workshop, Dr. Siebert discussed with Mr. Ndabarase the forecast materials he had received during the pre-COF meetings, and Mr. Ndabarase collaborated with senior Météo Rwanda staff to prepare for the dissemination of the forecast. Dr. Siebert worked concurrently during this time to develop forecasts for the SOND 2017 using CPT. Shortly into September, when the observed August SST data were available from Extended Reconstructed Sea Surface Temperature version 4 (ERSST4), Dr. Siebert was able to make forecasts for the rainy day frequency, onset date, and total seasonal rainfall for the SOND 2017 season. Earlier attempts at the forecast had shown limited skill, but the analysis of the skill metrics for the forecasts based on version 3 of Enhancing National Climate Services initiative (ENACTS) and the observed August SSTs showed more robust skill (Fig. 3-5). Each forecast has relatively good skill over much of Rwanda, although the skill is weakest for the onset date forecast and strongest for the rainy day forecast. The mode maps of the three forecasts are shown below (Fig. 6-8).
14
Figure 3: Skill map of SOND total rainfall forecast
Figure 5: Skill of SOND 2017 rainy day frequency forecast
Figure 6: Mode maps for SOND total rainfall forecast
16
Figure 8: Mode maps for SOND rainy day frequency forecast
Fig. 6 shows that elevated SSTs in the tropical Indian Ocean (and cool SSTs in the tropical Atlantic near Africa) tend to correlate with above average precipitation in Rwanda. The domain for the predictor for this forecast is 30°N to 30°S, 0-100°E. Fig. 7 shows that elevated SSTs in the tropical Indian Ocean tend to correlate with earlier onset dates in Rwanda. Fig. 8 shows that cool SSTs in the tropical Indian Ocean tend to correlate with below average rainy day frequency in Rwanda. The domain for the predictors for the onset date and rainfall frequency forecasts is 30°N to 30°S, 40-100°E. The 2017 probabilistic forecasts are shown below (Fig. 9-11).
Figure 10: SOND 2017 onset date forecast
Figure 11: SOND 2017 rainy day frequency forecast
Fig. 9 shows a forecast leaning towards above normal rainfall for the season. Fig. 10 shows a forecast leaning towards an earlier than normal onset date for the season. Fig. 11 shows a forecast towards an above normal rainfall frequency for the season in most regions within the country. These forecasts are somewhat at odds with the official
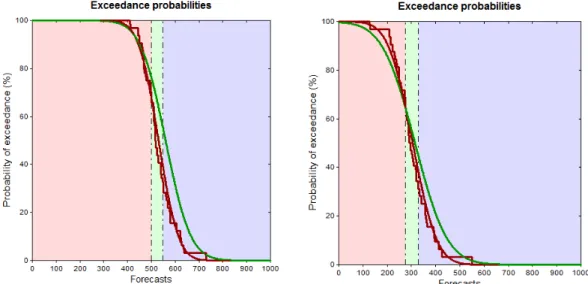
18 Météo Rwanda forecast. Although anecdotally, the rains so far during the season have tended in many regions to come early and be more frequent and intense than normal. Fig. 12-14 show probability of exceedance graphics for each of the forecasts for two illustrative locations (Burera district and Kirehe district). Burera district is a
comparatively humid district in the Northern province and was included in Phase 1 of the Rwanda Climate Services for Agriculture project (1.45°S 29.75°E). Kirehe district is a comparatively arid district in the southern part of the Eastern province and was included in Phase 2 of the project (2.22°S, 30.76°E). For all the probability of exceedance graphics shown below, the forecast is the green line and the climatology and empirical data are shown in red. The red region shows the lower tercile, the green region shows the middle tercile and the blue region shows the upper tercile.
Figure 12: Probability of Exceedance of SOND 2017 seasonal rainfall totals for Burera District (left) and Kirehe District (right).
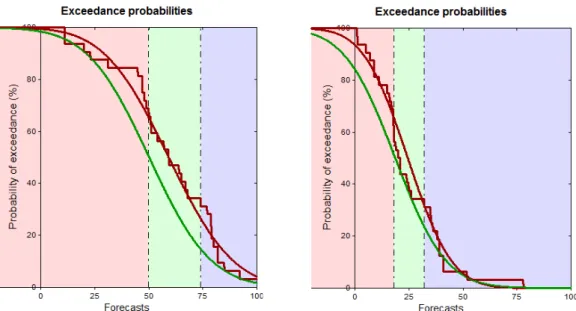
Fig. 12 shows that for both locations there is an elevated likelihood of above average rainfall for SOND 2017, although this effect is more pronounced for Burera than for Kirehe). Fig. 13 shows that there is an enhanced likelihood of an early onset for SOND 2017 for both locations. Fig. 14 shows that there is an enhanced likelihood of above average rainy day frequency, with the effect more pronounced for Burera than for Kirehe.
Figure 13: Probability of Exceedance of SOND 2017 onset date for Burera District (left) and Kirehe District (right).
Figure 14: Probability of Exceedance of SOND 2017 rainy day frequency for Burera District (left) and Kirehe District (right).
Trainings of Météo Rwanda staff
From September 4-18, 2017, twelve Météo Rwanda staff, many of whom were recently hired, were trained in the Météo Rwanda maprooms, the IRI Data Library, CPT, and seasonal to sub-seasonal (S2S) concepts.
20
Maproom training
The maproom training showed the Météo Rwanda trainees the features of the
maprooms hosted on Météo Rwanda’s website2. Participants learned the flexibility of the maproom interface, as well as the ability to select different variables of interest, zoom into specific grid boxes, districts or provinces for graph analysis, and to download graph and map images in different graphic formats.
This maproom interface has been developed by the IRI Data Library team with data inputs from Météo Rwanda and is based on the ENACTS rainfall and temperature data. ENACTS integrates station data provided by Météo Rwanda with satellite rainfall estimates and reanalysis temperature data to produce a spatially and temporally complete dataset from the early 1980s to the present.
Within the “Climate” maproom pages, the daily, dekad, and monthly climate analysis features were illustrated, along with the climate monitoring and climate forecast
2 http://maproom.Météo Rwanda.gov.rw/maproom/
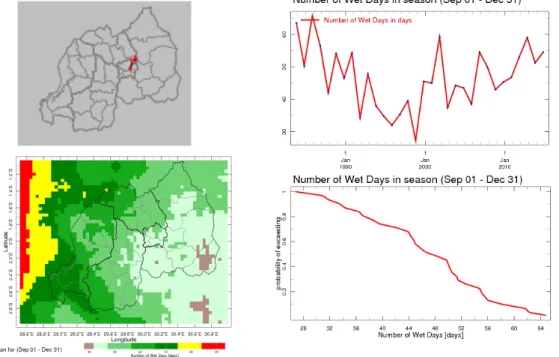
Figure 15: Location of gridbox with Kigali selected (top left); number of wet days in SOND in Kigali by year (top right); cumulative distribution function of number of wet days during SOND in Kigali (lower left); mean rainy day frequency during SOND across the country from 1983-2014 (lower right)
maproom features. To illustrate the flexibility of these maprooms, Fig. 15 shows the number of rainy days in the SOND season for the nation as a whole and a time series and statistics for an individual location. This figure can be recreated by visiting the daily climate analysis maproom page.
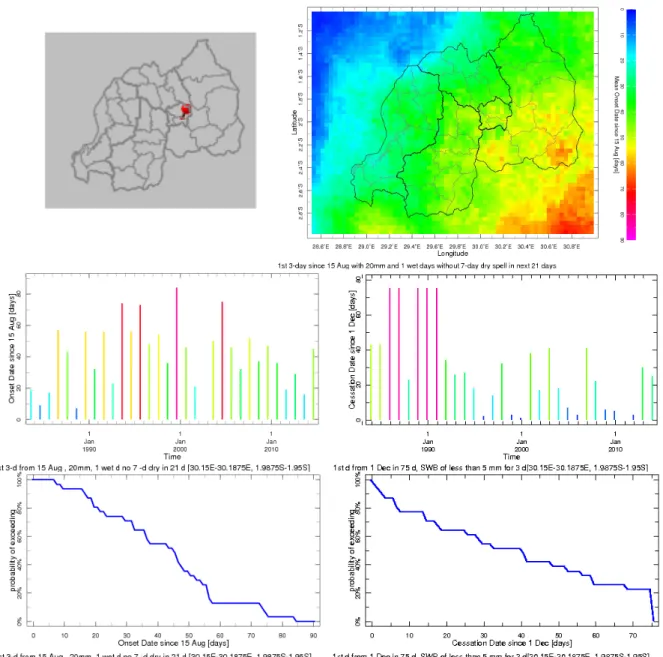
Figure 16: Location of gridbox with Kigali selected (top left); mean onset date across Rwanda from August 15 with stated specifications (top right); time series of onset dates for Kigali (middle left); time series of cessation dates for Kigali (middle right); cumulative distribution function of onset dates for Kigali (bottom left); cumulative distribution function of cessation dates for Kigali (bottom right).
22 Within the ‘Climate and Health’ maproom section, the ‘Seasonal Climatic Suitability for Malaria Transmission’ maproom and ‘Rwanda Administrative - Average
Weighted Anomaly Standardization Precipitation (WASP) Index’ maproom were discussed and illustrated. Within the ‘Climate and Agriculture’ maproom section, the historical onset and cessation date maproom was illustrated, along with the dynamic season totals. The maproom training was interspersed with training on the IRI Data Library and CPT. Fig. 16 shows an example graphic of onset and termination dates from the climate and agriculture maproom page.
IRI Data Library training
The IRI data library training that took place during this time period introduced the Météo Rwanda staff to some aspects of the functionality of the IRI Data Library3. The staff were shown how to make geographic and temporal selections of data using the ‘Data Selection’ window, how to navigate to a chosen data set via the ‘Data by Sources’ path and how to visualize gridded and/or station data in the data viewer. Some guidance was also given to the Météo Rwanda trainees regarding making seasonal averages and spatial averages using ‘Expert Mode Ingrid’ commands and the trainees were shown how to extract data files from the IRI Data Library in different formats. Because of the focus of the training on the use of the CPT, the trainees were asked primarily to extract data from the Data Library in CPT readable format.
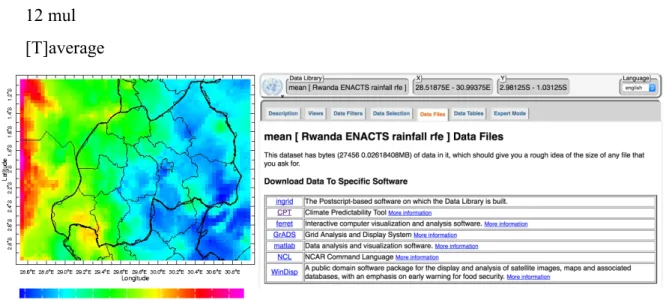
In addition to the numerous data sources available through the general IRI Data Library, there are data sets specific to Rwanda and hosted on the Météo Rwanda server. An example of such data extraction is shown in Fig. 17. The path to extracting the seasonal climatology of the SOND ENACTS climatology is shown along with the Ingrid code, the colored graphic, and several possible download file formats. Rwanda-specific climate data available through the Météo Rwanda server is password
protected.
CPT forecasting training
The CPT software is a Windows and Linux based software package designed to make seasonal climate forecasts, perform GCM validation and probabilistic forecast
verification, and other analyses based on model output statistics. CPT was developed by IRI senior scientist Simon Mason around 2000 and is now on Version 15. CPT is a very powerful tool for statistical analysis and has been used by meteorological
services around the world.
Given the time constraints, the Windows version of CPT was the focal point of this training. The Linux version requires the user have some familiarity with Linux and can enable the user to run larger batch computations quickly. However, since the graphical user interface exists only for the Windows version and much of the appeal of using CPT rests in the graphics that are generated, the focus was on the Windows version. Within the Windows version of CPT, there are two options for its use regarding expertise: beginner and expert. Within the beginner mode, the user can select either verification, GCM validation, or forecast options. If the user selects the forecast option, CPT will automatically choose the “best” forecasting approach for the
SOURCES .Rwanda .ENACTS .rainfall .rfe T (Sep-Dec) seasonalAverage 12 mul [T]average
Figure 17: The path, Ingrid code, visualization of the SOND rainfall climatology from the ENACTS dataset over 1983-2014, as well as several download file format options.
24 input data. However, within the expert mode, the user can actively choose between three different statistical forecast methodologies: multiple linear regression (MLR), principal component regression (PCR) and canonical correlation analysis (CCA). At first, the Météo Rwanda trainees were exposed to CPT’s forecast capabilities through the beginner mode just for the purpose of illustration. After the first day of training, the differences between the forecast methodologies were explained and most of the CPT training was conducted in expert mode. The training began with a
discussion of what constitutes a “predictor”—independent observed or modeled variable used to make a forecast—and what constitutes a “predictand”—observed “dependent” variable of interest that is influenced in some way by the predictor(s). MLR is a forecast methodology that is best suited to a small number of predictors that are not correlated with each other, ideally, and a small number of predictands (ideally, only one).
When there are a large number of predictors and/or the predictors have closely correlated variability to each other, the problem of “collinearity” arises. When there are a large number of predictands, PCR and/or CCA are more effective methods of making statistical predictions. PCR is a forecast methodology that is best suited for a larger number of predictors (including a spatial field/gridded predictor) and a small number of predictands. PCR analysis is sometimes also known as empirical
orthogonal function (EOF) analysis. Rather than using a simple linear combination of the different predictors, PCR statistically develops “modes” within the predictors to explain the variance in the predictand(s). Each mode is a weighted sum of the
predictors that explains the largest fraction of the variance of the predictand but is not collinear with other modes. By design, the leading PCR mode explains the most variance, the second mode the second most, etc. Within the CPT application, the user is prompted to select a geographical domain for the predictor and predictand as well as a maximum number of modes (for the predictor) to consider in the analysis. CCA is a forecast methodology that is somewhat similar to PCR, but is optimal for scenarios with a larger number of predictors (including a spatial field/gridded predictor) and a large number of predictands (including a spatial field/gridded predictand). CCA is different from PCR in that it develops “modes” for both the
predictor and predictand. CPT users are prompted to select a geographical domain for the predictor and predictand datasets and to select a maximum number of modes for predictor, predictand, and CCA for the analysis.
Once a forecast analysis is completed in CPT, there are a number of tools and options that the user can implement to visualize the output of the forecast. The Météo Rwanda trainees were advised on how to evaluate the skill of a forecast both on the basis of the Goodness Index and on the basis of the skill maps using different correlations and skill metrics. The interpretation of the Mode Maps which depict the weighting coefficients in PCR or CCA was also discussed. Different forecast outputs were discussed amongst other features: forecast values and maps, forecast time series for individual locations, probabilistic forecast maps, and probability of exceedance graphics for individual locations. Additionally, CPT has a tailoring option, which can enable users to run analyses with their own defined thresholds, either based on percentiles, absolute values or analogue years. Some of this tailoring capability was explored during the training. Throughout the forecast training, the Météo Rwanda trainees were shown both how to visualize and how to save/extract the various outputs of the CPT tools and graphics, as well as how to save project files so they could come back to an analysis they had already run.
CPT GCM validation and probabilistic forecast training
In addition to being a tool for seasonal climate forecasting, CPT can also perform validation of GCM output and probabilistic forecast verification (PFV). These analytical capabilities were explored during the training but were not a focal point of the group exercises.
Within CPT, GCM validation involves loading a GCM data source into the “X” window (independent variable) and a trusted observed data source of a corresponding resolution and time frame into the “Y” window (dependent variable). Once the validation is run, one can explore the goodness index and skill maps to compare the skill of the GCM simulation with the observations. Within the tailoring options, one can also choose different approaches to the model grid (nearest neighbor or
26 variance) and model combination (various types of ensemble weighting and
calibration).
Probabilistic forecast verification in CPT involves loading a probabilistic forecast into the “X” window (independent variable) and a trusted observed data source of a
corresponding resolution and time frame into the “Y” window (dependent variable). The purpose of forecast verification is to assess how accurate a probabilistic forecast is for a given season or collection of seasons. Once this type of analysis is run, the user can then explore a number of illustrative skill diagnostics; including skill maps, relative operating characteristic curves, tendency diagrams and attribute diagrams.
S2S forecasting training
In addition to understanding climate variability on the inter-annual to seasonal time scale, another critical time scale for climate prediction is the S2S time scale from about two weeks to around two-month lead time. Earlier in the summer of the 2017, there had been some planning to conduct a week-long training on S2S prediction that would be co-facilitated by the University of Rwanda Kigali campus and the Abdus Salam International Centre for Theoretical Physics (ICTP). This training has been postponed until 2018. However, in an effort to make sure that new Météo Rwanda trainees had some exposure to this material, Dr. Siebert—in collaboration with fellow IRI Post-Doctoral Research Scientist Angel Muñoz—gave two short lectures and shared several web portals on this information,
The lectures gave some background to the trainees on sources of uncertainty in atmospheric modeling, the predictability and importance of the S2S time scale, and the sources of variability on that time scale—including persistence features, tropical-extratropical interactions, interaction between variability on different time scales, and specific climate modes at the S2S time scale. Particular attention was drawn to the Madden Julian Oscillation (MJO), as the MJO is arguably the strongest dynamical mode of variability in the tropics on the S2S time scale. Links to the International Seasonal to Subseasonal Prediction Project4 were shared as was a webpage that
illustrates rainfall anomaly as a function of MJO phase. Fig. 18 below shows the rainfall anomaly over Rwanda and neighboring regions during the August-September period for phase 2 of the MJO (when the wet anomaly over Eastern Africa) is fairly well-developed.
Figure 18: Map of rainfall anomaly near Rwanda during phase 2 of MJO during August-September season
Climate dynamics background
Dr. Siebert also delivered a background lecture on climate, drawing materials from an undergraduate course that Dr. Siebert had taught. As the Météo Rwanda trainees were comparatively new hires and came from different backgrounds, this lecture covered some of the fundamental features of the global atmosphere, fluid motions on a rotating sphere, the processes of convection, advection, heat exchange, the thermal wind equation, the Clausius Clapeyron equation, some fundamentals of ocean
dynamics and discussions of different types of precipitation and atmospheric stability. This lecture, along with several others (from the same course) were shared
28
Group exercises and quiz
A collection of group exercises and a quiz were developed and given to the Météo Rwanda trainees. The quiz was intended to test the knowledge the trainees had gained on all of the materials covered to date: the Météo Rwanda maprooms, data
manipulation, visualization and extraction from the IRI Data Library, the use of CPT for a range of activities, and conceptual points of understanding regarding regression, statistics, climate dynamics, and S2S forecasting. The group exercises were intended to examine the trainees’ facility in working with the IRI Data Library and CPT to make seasonal forecasts independently and to evaluate their skill. The trainees
organized into four groups and worked on the group exercises over the three days that followed. The group exercises are shown in Appendix 3.
Each group of trainees delivered presentation on the exercises at the end of the working period. While not all of the groups were able to complete all of the exercises in the short period of three days, every group demonstrated facility with data
extraction from the IRI Data Library, running forecasts in CPT, and interpreting the forecasts they had made. In light of this favorable outcome, certificates of merit were issued to all the participants.
Some example findings from the different group presentations are shown in Fig. 19-22. In spite of the short period during which the groups had an opportunity to work on the exercises, all the group presentations were at least 20 slides long and most
demonstrated at least a moderate if not high level of understanding of the concepts addressed during the training.
Figure 19: Example slides from one group’s presentation showing responses to the exercise prompts.
Figure 20: Example slides from one group’ presentation showing recommendations
Figure 21: Example slides from one group’ presentation showing responses to the exercise prompts
30
Water Balance Maprooms
Three visitors from RAB, Bernard Musana, Aimable Gahigi, and Tenge Ngoga, visited the CIAT Rwanda facility and joined the discussions with the Météo Rwanda trainees. On this day, Dr. Siebert introduced the comparatively new Water Balance maproom which is hosted under the ‘Historical Agricultural Information’ link from the ‘Climate and Agriculture’ maproom page. These tools were developed by the IRI Data Library in mid-2017 and were made live in early August 2017. This maproom allows users to explore a range of variables connected to crop water usage: including effective precipitation, crop evapotranspiration, soil moisture, crop coefficients, water stress and water requirement satisfaction index (WRSI). The maproom interface is based on the ENACTS daily rainfall, but may be refined with input from the Rwanda agriculture board regarding soil water capacity. At the moment, the only cultivar shown live on the page is SOND Bush Beans. However, within the Météo Rwanda data page, there are data for Bush Beans, Climb Beans, and Maize for both rainy seasons and for different regions of the country.
WRSI is a useful agronomic drought metric that integrates accumulated water stress over the course of a season and often is well-correlated with agricultural yield in water limited environments. Higher values of WRSI (closer to 100% or 1) imply less water stress, while lower values imply more accumulated water stress over the course of the season. WRSI data are extractable through the Météo Rwanda data portal and preliminary forecasts can be made. Fig. 23 and 24 below depict the WRSI climatology for two different crops and integration windows.
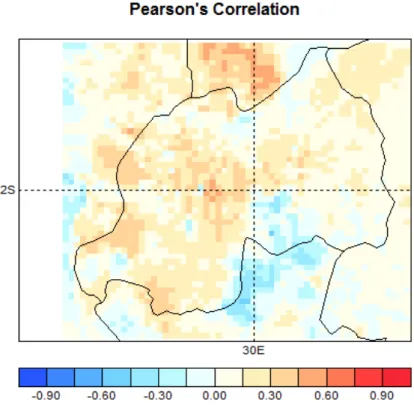
Since the WRSI data can be extracted, preliminary forecasts can be made using CPT. A CCA was run using the WRSI data based on an August 15-December 31 season, and the observed August SSTs in the tropical Indian Ocean as a predictor. The Pearson’s skill map is shown below in Fig. 25.
Figure 24: WRSI climatology for Climb Beans based on the August 15 to December 31 integration window.
Figure 23: WRSI climatology for Bush Beans based on the October 1 to December 31 integration window.
Figure 25: Pearson’s correlation for WRSI Bush Beans forecast based on observed August SSTs
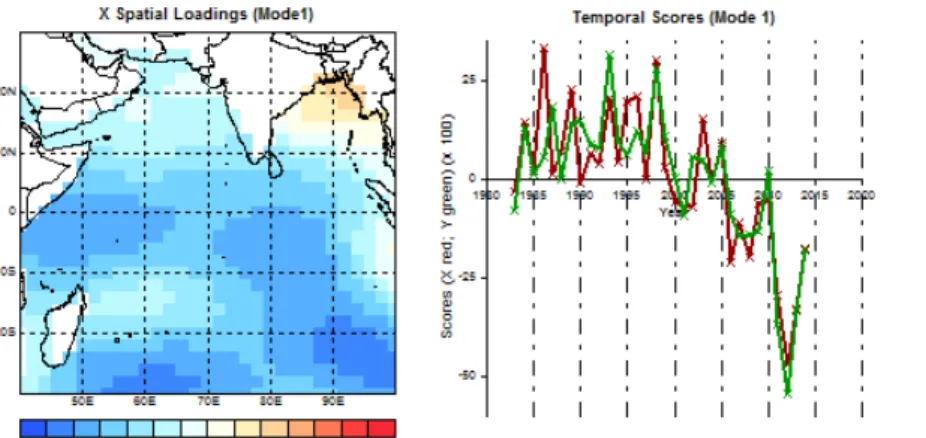
32 The X and Y loading patterns are shown below (Fig. 26). These loading scores
indicate that when the SST is below average in the tropical Indian Ocean in August, there is usually below average WRSI (elevated water stress) in Rwanda in the following SOND season. On the basis of this CCA, several example forecasts were made. Two are shown below in Fig. 27 for 2010 (neutral year) and 2015 (wet year).
Figure 26: Mode maps for Bush Beans SOND WRSI
Figure 27: Probabilistic Forecasts for Bush Beans SOND WRSI for 2010 (left panel) and 2015 (right panel).
Conclusions and future work
The work on the Rwanda Climate Services for Agriculture project is still in process and further collaboration between all parties is necessary to ensure improved climate information dissemination and improved food security outcomes for Rwanda.
Considerable progress has been made in IRI forecasting capability and development as well as in the training of Météo Rwanda staff on the use of CPT, the IRI Data Library, and the Météo Rwanda maprooms. Sustained contact on both forecasting and research objectives5 remains a high priority. The IRI team, Météo Rwanda, and CIAT Rwanda should discuss the evolution of the SOND 2017 rainy season and continue evaluate how skillful the forecasts were after the fact. Further collaboration between IRI, CCAFS, and the RAB would help to refine the water balance maproom
capabilities and the capacity to skillfully forecast WRSI and/or agricultural yield. All efforts to date will also be reviewed in light of emerging newer versions of the ENACTS data.
5 A paper on the climatology of the ENACTS data has been under development and will be submitted to the International Journal of Climatology in the near future. Dr. Siebert has recently received word from the American Meteorological Society that a research abstract was accepted for oral presentation at the annual meeting in Austin, TX, USA in January 2018.
34
Appendix 1: Training Agenda
Day Date Objectives
1 Monday, September 4,
2017
discussed climate maprooms, introduced the IRIDL, introduced some features of CPT forecasting in beginner mode
2 Tuesday, September 5,
2017
added discussion of climate and public health and climate and agriculture maprooms, illustrated additional features of the IRIDL, switched to CPT forecasting using expert mode and explained the difference between MLR, PCR and CCA
3 Wednesday, September
6, 2017
presented several lectures to the trainees on regression, forecasting (taken from Simon and Andrew R's presentations during the SCIPEA workshop last November), helped further refine their understanding of the difference between the forecast methods, reviewed some maproom and IRIDL concepts, discussed how to download data from IRIDL and CPT
4 Thursday, September 7,
2017
shared a few additional lectures (including on ENACTS), went into more depth in explaining how to evaluate forecasts with respect to goodness index, skill score and how to interpret certain output metrics (including probability of exceedance graphics), illustrated within DL how to extract rainy day frequency, dry spell frequency and onset date output
5 Friday, September 8,
2017
more review of data downloading from IRIDL and from CPT, illustrated how to do probabilistic forecast verification, reviewed material covered to date
6 Monday, September 11,
2017
presented lectures on seasonal to subseasonal prediction, showed websites for S2S prediction project page and interpretation of the MJO, answered lingering questions
7 Tuesday, September 12,
2017
illustrated GCM validation in CPT, gave group exercises and quiz and gave lecture on climate dynamics
N/A Wednesday, September
13, 2017
Not an official training day - the Météo Rwanda trainees met at CIAT and collaborated on their group exercises. some Météo Rwanda staff were in the field disseminating the forecast
8 Thursday, September
14, 2017
Aimable Gahigi, Tenge Ngoga and Bernard Musana joined us from RAB and I discussed the new water balance maprooms, the WRSI calculation and how to extract WRSI data for prediction and analysis
9 Friday, September 15,
2017
the Météo Rwanda trainees gave their presentations and were evaluated by Desire, Bernard, Aimable and myself
10 Monday, September 18,
2017
the trainees met with Desire and Floribert to discuss next steps and verification and certificates of merit were issued for all of the trainees - with signatures from DG John Semafara, Desire and myself.
Appendix 2: Participant List
Name Institutional Affiliation and nation Gender
Dr. Asher Siebert IRI, USA Male
Dr. Desire Kagabo CIAT Rwanda, CCAFS Male
Ms. Gloriose Nsengiyumva CIAT Rwanda, CCAFS Female
Mr. Floribert Vuguziga Rwanda Meteorology Agency, Rwanda Male
Ms. Peace Bamurange Rwanda Meteorology Agency, Rwanda Female
Mr. Joseph Hazabintwari Rwanda Meteorology Agency, Rwanda Male
Mr. Steven Higiro Rwanda Meteorology Agency, Rwanda Male
Mr. Vedaste Iyakaremye Rwanda Meteorology Agency, Rwanda Male
Mr. Jonah Kazora Rwanda Meteorology Agency, Rwanda Male
Mr. Felix Mucyo Rwanda Meteorology Agency, Rwanda Male
Mr. Godfrey Musafiri Rwanda Meteorology Agency, Rwanda Male
Ms. Annonciata Muteteri Rwanda Meteorology Agency, Rwanda Female
Mr. Felix Ndabarase Rwanda Meteorology Agency, Rwanda Male
Ms. Joyce Rusaro Rwanda Meteorology Agency, Rwanda Female
Mr. Joseph Sebiza Rwanda Meteorology Agency, Rwanda Male
Ms. Jacqueline Uwimbabazi Rwanda Meteorology Agency, Rwanda Female
Mr. Bernard Musana Rwanda Agriculture Board, Rwanda Male
Mr. Tenge Ngoga Rwanda Agriculture Board, Rwanda Male
36
Appendix 3: Group exercises
Exercise 1
Extract the MAM rainfall totals, rainy day frequency and onset date for both ENACTS (through the Météo Rwanda maproom with your login credentials) and CHIRPS (from the IRIDL on the 5km grid). Keep in mind that for the rainfall totals, you can use monthly or dekadal data, whereas for the rainy day frequency and the onset date, you will have to select daily data. For the onset date in this example, you can choose the default settings in the onset date maproom or other settings of your own selection. But state clearly what your choice is.
Use the January observed SSTs as a predictor field. Choose your own geographic domain and mode selection at your discretion. Keep the Y domain focused over Rwanda. Run canonical correlation analyses against each predictand with the January SSTs as predictor. Make three years of forecast; 2015-2017. On balance, which observational data set shows better predictability (CHIRPS or ENACTS)? Illustrate with appropriate graphics and explanation. Which predictand performs better (rainy day frequency, total rainfall or onset date)? Again, justify your answer with
appropriate graphics and explanation.
Exercise 2
For the six predictand files in exercise 1, extract the climatology from the IRIDL or Météo Rwanda maproom. How does this compare to the climatology you extract from the CPT analyses?
Exercise 3
For the analyses you’ve done above, find Kigali’s location (approximately 1.95S, 30.11) in the probability of exceedance graphics and discuss the probabilities of exceedance of the three years of forecast.
Explain this probability of exceedance in the context of the tercile probabilistic forecasts.
Choose one of the 6 forecasts to rerun and select the tailoring option. Choose different probabilistic thresholds and rerun your analysis. How does your analysis change? Is this in line with your expectation?
Exercise 4
Selecting one type of predictand from exercise 1 (rainy day frequency, onset or rainfall total), explore (with both CHIRPS and ENACTS) potentially skillful GCM predictors. Try several models, domains and lead times if the first attempt isn’t successful.