Czech Technical University in Prague
Faculty of Electrical Engineering
Department of Computer Graphics and
Inter-action
Master’s thesis
Data Visualization in Virtual Reality
Bc. Tomáš Havlík
Supervisor: Ing. David Sedláček, Ph.D.
Acknowledgements
My thanks go out to academic staff and students of the Interactive Content Design Laboratory at Tohoku University and the Department of Computer Graphics and Interaction at the Czech Technical University for their valuable feedback as well as providing me with laboratories to conduct testing in, Oculus for supplying me with a development kit and members of Unity and Oculus Start developer communities for providing answers to many technical questions. A sincere thank you to all the testers and friends for their patience. Special thanks goes out to Ing. David Sedláček, Ph.D. for providing an excellent introduction to VR development. Lastly, I would like to thank my parents, Věroslav and Lenka for their support during my studies.Declaration
I hereby declare that the presented thesis is my own work and that I have cited all sources of information in accordance with the Guideline for adhering to ethical principles when elaborating an academic final thesis.I acknowledge that my thesis is subject to the rights and obligations stipulated by the Act No. 121/2000 Coll., the Copyright Act, as amended, in particular that the Czech Technical University in Prague has the right to conclude a license agreement on the utilization of this thesis as a school work under the provisions of Article 60(1) of the Act.
Czech Technical University in Prague Faculty of Electrical Engineering
© 2020 Tomáš Havlík. All rights reserved.
This thesis is a school work as defined by Copyright Act of the Czech Republic. It has been submitted at Czech Technical University in Prague, Faculty of Electrical Engineering. The thesis is protected by the Copyright Act and its usage without author’s permission is prohibited (with exceptions defined by the Copyright Act).
Citation of this thesis
HAVLÍK, Tomáš. Data Visualization in Virtual Reality. Master’s thesis. Czech Technical University in Prague, Faculty of Electrical Engineering, 2020.
Abstrakt
Cílem této diplomové práce je návrh a implementace aplikace pro virtuální realitu, která umožní uživateli vytvářet obecné vizualizace poskytnutých dat v souladu s principy uživatelsky orientovaného návrhu a s využitím možností prostorového rozhraní. Nedostatky virtuální reality by měly být potlačeny. Klíčová slova virtuální, realita, vizualizace, imersivní, analytika, prostorový, designAbstract
The aim of this master thesis is to design and implement an application for virtual reality that enables the user to create generalized visualizations of provided datasets, while following the user-centered design practices and leveraging spatial interface design. Shortcomings of contemporary virtual reality hardware are to be mitigated.Contents
Introduction 19
Chapters . . . 20
1 Motivation 23 1.1 Analysis of desktop applications . . . 23
1.2 Benefits of virtual reality . . . 28
2 Domain analysis 31 2.1 Target group . . . 31
2.2 Target platform . . . 31
2.3 State of the art . . . 34
3 Design 41 3.1 Personas . . . 41 3.2 Task analysis . . . 42 3.3 Scenarios . . . 44 3.4 Design goals . . . 45 3.5 Feature selection . . . 46 3.6 Component design . . . 52 3.7 Challenges of VR design . . . 54 4 Manager 55 4.1 Required functionality . . . 56 4.2 Wireframes . . . 56
4.3 Design stage . . . 58 4.4 Implementation . . . 58 5 Plugins 65 6 Navigator 67 6.1 Required functionality . . . 67 6.2 Interaction design . . . 68 6.3 January build (1901) . . . 70 6.4 Lo-fi prototype . . . 73 6.5 August build (1908) . . . 74 6.6 Lo-fi prototype 2 . . . 76 6.7 December build (1912) . . . 78 7 Testing 83 7.1 Example task . . . 83 7.2 User testing . . . 84 8 Used technology 95 8.1 Manager . . . 95 8.2 Navigator . . . 96 Conclusion 97 Sources 99 A Key-stroke level model (KLM) 107 B Test reports 109 C Installation guide 111 C.1 Navigator . . . 111
C.2 Manager . . . 112
C.3 Plugins . . . 112
D List of abbreviations used 113
List of Figures
1.1 Result of our example workflow. . . 24
1.2 Menu listing all available filters. . . 25
1.3 Tableau’s sheet view. . . 28
1.4 Tableau’s edit view. . . 29
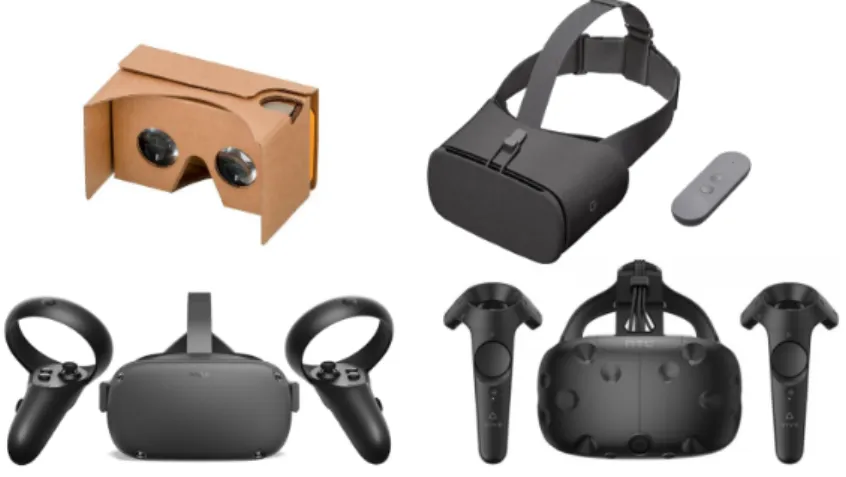
2.1 Examples of various contemporary virtual reality systems. Clock-wise from top: Google Daydream View (mobile), HTC Vive (PC), Oculus Quest (standalone), Google Cardboard (mobile). . . 32
2.2 Left: Oculus Go controller offering 3 degrees of freedom. Right: Oculus Touch 6DOF controller.[72] . . . 33
2.3 Spreadsheet view in Virtualitics’s desktop application.[69] . . . 35
2.4 Mapping view in Virtualitics’s desktop application.[69] . . . 35
2.5 Virtualitics’s VR interface.[69] . . . 36
2.6 LookVR’s user interface.[63] . . . 37
2.7 3Data’s immersive VR environment.[9] . . . 38
2.8 Comparison of VR data visualization applications. . . 39
3.1 Persona — Frank. . . 41
3.2 Persona — Quinn. . . 42
3.3 Persona — Paul. . . 42
3.4 Hierarchical task analysis of typical immersive analytics software. . 43
3.5 Clockwise from top left: surface plot, globe plot, scatter plot, bar plot, parallel coordinates plot, map plot. . . 48
3.7 Decision tree for automatic assignment of attribute types in
mul-tivariate datasets. . . 51
3.8 Comparison of pixel density between a high-end consumer headset and a business-oriented HMD.[66] . . . 53
3.9 Example use of Punchkeyboard.[51] . . . 53
3.10 Adapted version of Haber–McNabb dataflow model for scientific visualization in the context of our environment.[54] . . . 54
4.1 User interface of Manager. . . 55
4.2 Wireframe of Manager’s interface (version 1) — dataset listing. . . . 57
4.3 Wireframe of Manager’s interface (version 1) — dataset view. . . 57
4.4 Wireframe of Manager’s interface (version 2). . . 58
4.5 Wireframe detailing the process of uploading a new dataset from local file. . . 58
4.6 Low-fidelity prototype made in Inkscape. . . 59
4.7 Options for adding a dataset. . . 60
4.8 Dataset addition wizard. . . 60
4.9 Dataset actions. From left: Update, manage versions, download, share, rename, delete. . . 61
4.10 Version management in Manager. . . 62
4.11 A spatial dataset in Manager. . . 63
5.1 Guide for adding a dataset using Python. . . 66
6.1 Attribute element in VR. . . 68
6.2 2D and 3D variants of shapes used in scatter plots. . . 68
6.3 Plot in VR. . . 69
6.4 Plot resize interaction in 6DOF. . . 70
6.5 Attribute assignment in 6DOF. . . 70
6.6 Spatial design of the 3DOF version. . . 71
6.7 Input capabilities of an Oculus Go controller. . . 71
6.8 Initial user interface design for Navigator. . . 72
6.9 Screenshot from the January build of Navigator. . . 72
6.10 Prototype of 3DOF interface. . . 73
List of Figures 6.12 Left: Pairing prompt in Navigator. Right: Adding a new headset in
Manager. . . 74
6.13 Navigator’s 3DOF interface. . . 75
6.14 Navigator’s 6DOF interface. . . 76
6.15 Prototype of the immersive mode. . . 77
6.16 Prototype of collaboration with two other users, one of which is inside immersive mode. . . 77
6.17 Prototype of the filtering interface. . . 78
6.18 Plot types available to the user. . . 78
6.19 Pie menu used for selecting the type of a newly created plot. . . 79
6.20 Screenshot of Navigator highlighting immersive mode. Swatch is visible on the left. . . 79
6.21 Unused, alternative layout for statistics. . . 80
6.22 Swatches for the plot’s color feature. . . 81
6.23 Swatches for the plot’s size feature. . . 81
Introduction
The advances in technology over the past 30 years have brought us treasure troves of data. With the rise of the Internet especially, we are living in a world filled with information. Internet of things, big data and cloud are just some of the buzzwords that are often used in popular media. As the century turned, data had become the new oil. New industries were born out of nowhere as more and more people realized that information is power.We live in an age where products we use know more about ourselves than we do. Data has been weaponized to change public opinion during the 2016 US presidential elections. Chief executive officer of a consulting company employed by the presidential elect Donald Trump has been quoted as saying that they keep four to five thousand data points on nearly two thirds of US population.[5] This data has been used to classify individuals based on political preferences and for targeted advertising. The Cambridge Analytica dataset is just one example of big data, a popular term that denotes data of high volume, variety (form of data), veracity (uncertainty) and velocity.[35]
However, if we are to gain insight from such data, we have to find effective ways of analyzing it. Data analytics is the process of finding, interpreting and communicating data. Data visualization provides an effective means of communicating the results using visual representations. A related term that is often used interchangeably with-, but is often thought of as a superset of data analytics software, is Business intelligence (BI). BI software incorporate so-called decision support technologies, which include predictive analytics,
Introduction
benchmarking and various kinds of other tools. They utilize special databases that are capable of handling big data.[4]
As we will discuss in the following chapter, these pieces of software are not very user-friendly and are often unavailable for those outside of large corporations due to their reliance on enterprise-focused technology and business models, which make such products unattainable by end consumers. The hypothesis of our work is that we can make data visualization more accessible by utilizing novel interaction techniques, specifically spatial interfaces used in virtual reality (VR) applications. We will also discuss the state of virtual reality in 2019 and implications of using such technology in the context of data visualization before moving on to look at current applications in the area. We will then discuss in detail the design process behind our application and follow up with specification of our testing methodology and evaluation of feedback we have received from test participants. We will also provide a brief description of the technology used in the implementation stage and conclude the thesis with a look into the near future.
Chapters
The thesis is comprised of the following chapters.
Motivation
In this chapter we are going to go over several examples of traditional data analytics and business intelligence software, i.e. software that runs on a personal computer and utilizes a flat user interface. We will try to assess the ease of use and come up with reasons why VR might help us in this space.
Domain analysis
In this chapter, we will analyze the state of virtual reality in 2019 and take a look at a couple examples of applications in the space of immersive analytics. Furthermore, we will define our target group and set design goals to help narrow down our scope.
Chapters
Design
In this chapter we will discuss in detail the target user group and use cases of our application, specify important goals that we would like to meet, select features to help us meet these goals and talk about implications of virtual reality prototyping on our design process.
Manager
This chapter includes description of the prototyping process behind Manager, our web component. We will start by creating wireframes and continue by implementing two versions of the component.
Plugins
This chapter introduces plugins, programming integrations intended for de-velopers and power users to incorporate dataset creation and updating func-tionality into their applications and scripts.
Navigator
This chapter concerns the design and implementation of Navigator, the VR component of our application. The process of design and creation of three prototypes is discussed.
Testing
In this chapter, we will compare the efficiency of our application against that of its contemporary alternatives introduced in chapter 1, introduce our testing methodology and present some of the findings.
Used technology
In this chapter we will briefly discuss the technological stack behind our applications suite, which consists of a web component called Manager and a VR application called Navigator. Plugins are omitted, as their implementation varies on the language that they interface with.
Chapter
1
Motivation
In this chapter we are going to go over several examples of traditional data analytics and business intelligence software, i.e. software that runs on a personal computer and utilizes a flat user interface. We will try to assess the ease of use and come up with reasons why VR might help us in this space.1.1
Analysis of desktop applications
This section introduces two applications that we have chosen and goes over their functionality and user interface design. We will attempt to complete a simple task of creating a scatter plot from a CSV file. In order to quantify the data for further comparison, we will make use of the keystroke-level model (KLM).[3] For an explanation of the model and time values used, please see the appropriate section in the appendix.
1.1.1
Example task list
1. Load Wine dataset from a CSV file. 2. Create a scatter plot.
3. Assign attributes onto spatial axes. 4. Map attribute onto color.
1. Motivation
1.1.2 ParaView
ParaView is an open-source application for data analysis and visualization.[38] It is available for Linux, macOS and Windows. In our analysis, we will focus on the software’s visualization capabilities.
User workflow is centered on the so-called pipeline, which is presented to the user via a UI element calledPipeline browser. Here, the user can place actions, which then get applied incrementally, giving the user an option to jump back to a previous state in real time. Examples of actions include loading a file, creating a visualization of selected type and applying filters.
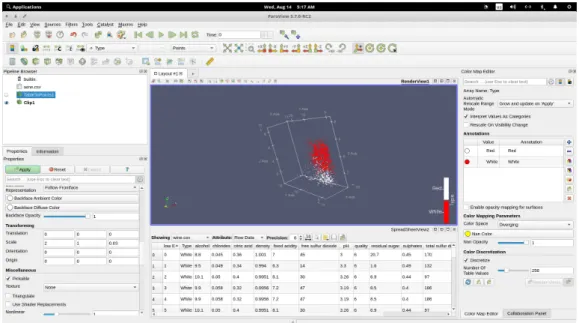
Figure 1.1: Result of our example workflow.
Other key parts of the user interface include a properties panel, which allows the user to modify parameters of a selected action in the pipeline, and the work area where visualizations are drawn. The user is also able to display other panels, which contain further statistical information on loaded dataset. Of particular note is the Color Map panel, which enables the user to choose between various color spaces.
There is also a Collaboration panel, which enables multiple users to connect to one another using a local-area network and share the current state of the work area as well as communicate with one another using text messages. The user roles are clearly defined — one user acts as a master and has the ability
1.1. Analysis of desktop applications to edit the project, while others act as slaves and cannot interact with the visualization.
We will start our usability test by opening our CSV file. ParaView supports a countless amount of input formats. After loading the data, it is analyzed and data types are automatically assigned, the user can choose a delimiter character and specify whether the dataset in question includes headers. To finish the loading process, the user has to click on the Apply button. After loading the dataset they are presented with a tabular view of it in its entirety.
Figure 1.2: Menu listing all available filters.
Next, we need to create a scatter plot. This is done in a very convoluted fashion by first selecting the dataset action in the pipeline browser and then opening up a menu via Filters → Alphabetical. This menu takes up the entirety of the screen and contains many seemingly unrelated actions. An obvious choice for the user would be to select the Plot Data option, however they must instead selectTable to Points.
The user is then free to select assignments for spatial axes using a drop down menu and map an attribute onto color in the same fashion. Clicking onApply
1. Motivation
The plot appears to be stretched, so we have to scale it by first pressing the cog icon to enable advanced options, and then modifying scale values for each axis in theTransforming section by typing in random values until we are satisfied with the look of our plot.
As points are very small when we zoom in on the plot, we set Point Size to a larger number. In order to be able to rotate the plot, we need to reset the pivot by pressing theZoom To Databutton in ParaView’s toolbar.
The next step is to slice the data by using the clip filter. We add the filter usingFilters → Alphabetical → Clip. It is appended to the end of our pipeline, however we need to copy the transform values to the new filter. Finally, we select the desired cutting plane usingX/Y/Z Normalbuttons and drag the plane to a position that we would like. In order to view original axes, we select the result ofTable to Pointsfilter in our pipeline.
The following table lists all KLM operations necessary to complete our task. The total time necessary to complete our tasks is 75.74 seconds. Overall, ParaView seems like a powerful tool, albeit with a very convoluted user interface. The tool’s tutorial guide contains 159 pages, although it covers advanced functionality in its later chapters.
1.1.3 Tableau
Tableau is a commonly used software for business intelligence. It allows the user to load data by opening a local file (CSV, JSON, Excel spreadsheet) or connecting to a database (MSSQL, Oracle, MySQL, Amazon Redshift and more). The number of database integrations is much larger than the number of supported types of local files indicative of the product’s focus on enterprises and big data. The desktop application is available for Windows and macOS.[55] The company also offers a product called Tableau Server which enables the users to store their data online using either a publicly hosted service or an on-premises server.
The client software includes a very straightforward and easy-to-use interface. The user loads a dataset and is presented with a tabular view. Data types are automatically detected, as is the column delimiter (in the case of CSV files). In this view, the user is also able to pre-filter data by selecting a threshold and filling in null values. They are then able to create asheet, a metaphor commonly
1.1. Analysis of desktop applications
Operator Description Time (s)
M Initiate opening a file 1.35
M Find file open button 1.35
PB Point at the button and press it 1.3 PB Select file and double click it 1.3
M Find properties panel 1.35
PB Point onApplybutton and press it 1.3
M Initiate plot addition 1.35
PBPPB Open upFiltersmenu, navigate toAlphabetical → Table to Points 3.7 M FindPropertiessection ofPropertiespanel 1.35 3*(PBPB) Select assignments from dropdown 7.8 M FindColoringsection ofPropertiespanel 1.35 PBPB Select an assignment from dropdown 2.6 M FindStylingsection ofPropertiespanel 1.35 PBHKH Change value of point size 2.38 PB Click on the eye icon to display filter 1.3 M FindTransformingsection ofPropertiespanel 1.35 6*(PBHKKKH) Guess transform scales that make length of plot’s axes equal 17.64 MPB FindZoom to Databutton and press it 1.3 PBPPB Filters → Alphabetical → Clip 3.7 PBPB Click on the eye icon next to the two recently added filters 2.6 M FindTransformingsection ofPropertiespanel 1.35 3x(PBHKKKH) Fill in scale values from the previous filter 8.82 M FindPlane parameterssection ofPropertiespanel 1.35 PB Point and click on desired normal button to create a cutting plane 1.3 PBPB Drag the cutting plane to desired position 2.6
PB Click onApply 1.3
PB Select original filter to display its axes 1.3
Table 1.1: Listing of KLM operations for ParaView.
used in spreadsheet software. The user then selects attributes they would like to use by dragging them into a Dimensions list and afterwards can map them onto rows, columns and non-spatial features of the two-dimensional scatter plot.
Unfortunately, as of version 2019.2.2, Tableau does not have native support for three-dimensional plots. There is a workaround for creating pseudo-3D plots, but it requires the use of a SQL database and is not user-friendly at all, being more of a hack than a proper solution.[2]
The following table lists all KLM operations necessary to complete a simplified task of creating a two-dimensional scatter plot.
The total time necessary to complete our tasks is 40.94 seconds, half the time of a similar workflow in ParaView. However, we have only been able to create a two-dimensional scatter plot due to software’s limitations.
1. Motivation
Operator Description Time (s)
M Initiate opening a file 1.35
M FindMore…button on sidebar 1.35 PB Point at the button and press it 1.3 PB Select file and double click it 1.3
M LocateSheet1tab 1.35
PB Point at the tab and press it 1.3
M LocateMeasuresandDimensionslists 1.35 3*(PBPB) Move attributes we want to display fromMeasurestoDimensions 7.8
M Locate plot dimension settings 1.35
2*(PBPB) Move spatial attributes fromDimensionslist toColumnsandPlotsrespectively 5.2 2*(PBPB) Click on both assignments and selectContinuousfrom dropdown menu 5.2 PBPB Move one attribute fromDimensionsontoColorsubsection ofMarkspanel 2.6 M Locate the axis we want to slice 1.35 PBPB Right click on the axis and selectEdit Axisfrom dropdown 2.6
PB SelectFixedradio button 1.3
PBHKKKH Input desired value toFixed endtextbox 2.94
PB Close the modal 1.3
Table 1.2: Listing of KLM operations for Tableau.
Figure 1.3: Tableau’s sheet view.
1.2 Benefits of virtual reality
We believe that virtual reality has the potential to enhance the visualization experience. Let us explore several reasons why.
1.2.1 Stereoscopic view, 6DOF
Head-mounted displays (HMD) are by design stereoscopic. One study com-pared error rates of visualization analysis on a conventional monitor against a stereoscopic solution with eye separation (interpupillary distance, IPD) of 6.4 cm. It also focused on the benefits of dynamic motion for perception.
1.2. Benefits of virtual reality
Figure 1.4: Tableau’s edit view.
The findings were that the use of both dynamic motion and stereoscopy significantly reduced error rates (by 10% in inexperienced participants, n=14 and 15-30% in experienced participants, n=2). Combination of these two methods led to further improvement.[70]
With modern HMDs we can leverage both of these methods as 6 degrees of freedom (6DOF) headsets allow the user to freely position their head in space, simulating motion.
1.2.2
Spatial interface
Researchers and designers alike have been looking at replacing the traditional Windows-Icons-Menus-Pointing (WIMP) desktop metaphors with 3D alternat-ives since the early 90s. The new interfaces instead rely on hand gestures and speech recognition to navigate around 3D space. One article from the era ar-gues that users are frustrated by many layers ofpoint and clickand visual clutter that is common with WIMP UIs and discusses the limitations of relying exclus-ively on the sense of sight. The author prophesizes rise of virtual reality and proceeds to discuss potential applications.[7]
Innovative examples such as Google Earth VR prove that well-designed spatial interfaces have the potential to make UI more intuitive, especially to first-time users.[23]
1. Motivation
1.2.3 Immersive analytics
The full use of one’s visual field as well as senses of touch (through force feedback) and spatial sound allow the user to fully immerse themselves into their data, which has potential to improve their concentration. Furthermore, they have the ability to invite other users into their virtual space, which allows for multi-user interactions with plots inside the space.
Chapter
2
Domain analysis
In this chapter, we will analyze the state of virtual reality in 2019 and take a look at a couple examples of applications in the space of immersive analytics. Furthermore, we will define our target group and set design goals to help narrow down our scope.2.1 Target group
Our application should provide an intuitive way to view data in a virtual reality environment in an attempt to leverage the spatial properties and immersion. It should be friendly enough to be accessible to users with basic computer skills while also providing advanced functionality to power users via API integrations.
2.2 Target platform
In order to specify a baseline for our application, we first need to look at the current landscape of virtual reality hardware. Over the years, we have primarily been dividing virtual reality systems into two main categories — phone- and PC-based VR. The former category includes ecosystems like Google Cardboard[28], Daydream[25] and Samsung’s GearVR[15], while the latter includes three primary vendors — Oculus with its Rift headset[19], Microsoft’s Windows Mixed Reality[46] ecosystem composed of head-mounted displays (HMDs) made by third-party manufacturers and Valve’s SteamVR[65], which includes support for pretty much any PC-based headset.
2. Domain analysis
Figure 2.1: Examples of various contemporary virtual reality systems. Clockwise from top: Google Daydream View (mobile), HTC Vive (PC), Oculus Quest (standalone), Google Cardboard (mobile).
There are two primary differences between the two mentioned categories. The first concerns system resources available to developer. Graphics processing units (GPUs) in modern personal computers are significantly more powerful than their handheld counterparts and as such, the software can be ran at much higher fidelity. To get a rough idea on performance targets for PC and mobile, we can consult Oculus’s development documentation. The recommended limit for draw calls and vertices is 100 and 100,000 for mobile and 1,000 and 2,000,000 for PC, more than a ten-fold difference.[21] We also have to keep in mind that this number is based on minimum requirements for Oculus Rift headset, which mention an Nvidia GeForce GTX 1050 Ti, a relatively low-spec GPU.[18] The second difference has to do with capabilities in regards to sensing move-ment and rotation of controllers and the HMD itself. Mobile headsets are lim-ited to 3 degrees of freedom (DOF), making use of rotational data from the phone’s inertial measurement unit (IMU), whereas PC-based systems generally offer 6 degrees of freedom (6DOF), which enables developers to utilize position as well as rotation. Controllers typically offer an array of buttons, digital/ana-log triggers and either a thumbstick or touchpad. The most basic VR systems do not offer a controller at all (Google Cardboard) or a non-tracked controller (also referred to as 0DOF; early iterations of Oculus Rift). These systems are restricted to gaze-based interaction techniques such as dwell selection, where
2.2. Target platform an action is triggered by lining up a reticle at the center of the screen with an object and keeping the head still for a defined period of time.[36]
Figure 2.2: Left: Oculus Go controller offering 3 degrees of freedom. Right: Oculus Touch 6DOF controller.[72]
The last two years saw a shift from phone-based VR into a completely new category of standalone virtual reality hardware, composed of headsets like Oculus Quest[17], Oculus Go[16] and HTC Vive Focus[33]. These headsets offer a much better end-user experience and reduce barrier to entry by removing the need for a powerful computer or a compatible smartphone. Technical capabilities of these devices are somewhere in between the two traditional categories with devices like Oculus Quest offering 6DOF inside-out tracking capabilities and ability to run graphically optimized versions of content previously exclusive to PCs.
In order to start designing our application, we first have to decide on baseline hardware as all future design decisions have to take into consideration technical limitations of targeted devices. In order to support the largest possible user base, we aim to support all classes of VR systems. To keep development manageable, we will primarily target Oculus hardware. We have chosen this particular company as it encompasses all three categories (PC, mobile, standalone) with its devices. The only ecosystems we will not support are
2. Domain analysis
Google Cardboard due to lack of hand controllers (and thus the necessity of designing around gaze-based interaction methods) and Google Daydream due to the recent discontinuation of the platform.[52]
2.3
State of the art
In this part we will focus on analyzing existing VR-enabled visualization tools. Emphasis is given on select features that author perceives as relevant. We will explore data support to see how we can load data onto the platform, as well as options for extensibility via plugins. Due to the rise of mobile HMDs, we will look at how well they are supported in each product. From the feature set, we will focus on machine learning capabilities and collaboration features. Lastly, we will take a quick look at business models of companies that develop these applications and check availability of editions aimed at end consumers and/or academia.
2.3.1
Virtualitics
Virtualitics aims to combine the benefits of high-dimensional visualization in VR with those of AI-driven data analysis.[68] It includes a Windows application for loading, editing and visualizing data in both desktop mode and VR, the latter enables the user to visualize data in an immersive environment as well as to collaborate with other users who are represented by avatars. Virtualitics also offers a Python API, which enables programmers to implement an integration into their applications. This API is available in the Python repository under a FOSS license (MIT).[50]
The interface of Virtualitics’s desktop application bears resemblance to Tableau. Data can be loaded from either a local file or a remote database. It includes a
spreadsheet view, which shows loaded data in a tabular form with histograms
and basic statistical information such as mean and median. The user is able to filter data and fill in missing values.
2.3. State of the art
Figure 2.3: Spreadsheet view in Virtualitics’s desktop application.[69]
Afterwards, they are able to switch into themapping view, which allows them to map attributes onto dimensions. A unique feature calledsmart mappingoffers the user a selection of attributes that are calculated to be the most important in the dataset. The user can also toggle between multiple plot types.
2. Domain analysis
The VR component dubbedVirtual Officeallows the user to interact with plots they have defined in the mapping view in VR. They are able to access key features of the desktop application using flat panels which have the same appearance as in desktop mode. The user can interact with one 3D plot at a time, which is located at the center of the virtual space with 2D plots surrounding the user and offering more insight. The software includes a collaboration feature, enabling the user to invite other stakeholders into their virtual environment.
Virtualitics’s Python API enables the user to connect to a running instance of the desktop application and load data from a Pandas data table as well as access certain analytics and visualization features straight from their code.
Figure 2.5: Virtualitics’s VR interface.[69]
Virtualitics includes support for Oculus Quest, however it is interesting to note that due to its limited hardware capabilities, arbitrary limits are in place for dataset size and number of points rendered in plots. If the point limit is reached, the software renders them as 2D billboards rather than as meshes.[67]
Out of the three products that we have analyzed, Virtualitics seems to be the most advanced. It offers a very clean task-driven user interface, powerful tools for analytics, mobile support for Oculus Quest, large number of integrations with an open-source Python API and collaboration features. Negatives include proprietary nature of all other components, which requires users to resort to
2.3. State of the art the aforementioned Python API, lack of support for 3DOF headsets such as Oculus Go or Google Daydream, VR interface that is perhaps too similar to its desktop counterpart and does not fully utilize the capabilities of room-scale VR and, as with all other products mentioned, lack of any consumer or academic version.
2.3.2 LookVR
LookVR is a virtual reality tool for exploring data that is part of Looker, an enterprise business analytics platform.[40] Looker enables its customers to connect to more than 50 types of databases. Their BI platform can be accessed via a web browser, a demo of an example dashboard is available.[41] LookVR enables the user to access 3D scatter plots, bar plots as well as more unorthodox plot types hosted on Looker. There does not seem to be any interactivity at all outside of selecting a plot. The software allows the user to push a cartoon-like
big databutton in order to enlarge the visualized plot.
Figure 2.6: LookVR’s user interface.[63]
LookVR is available for free via Steam.[63] If the user’s company has access to Looker, they may log in using their credentials, otherwise a small selection of plots is available as a sample. Unfortunately, all of our attempts to load sample data have ended unsuccessfully.
2. Domain analysis
When it comes to LookVR’s feature set, it is rather basic. The amount of available plot types is small, there is no support for mobile HMDs, no extensibility or FOSS components and although it is distributed for free via Steam, the requirement of a Looker license does not allow non-enterprise customers to utilize the product.
2.3.3 3Data
Austin-based startup 3Data started as a 2016 prototype called DataVizVR.[13] As of January 2020, this demo is still available via Oculus Store. The demo features a number of preloaded datasets and enables the user to interact with a single plot via a very spartan user interface. Since then, the product has matured, offering various plot types including terrain maps.[8]
Figure 2.7: 3Data’s immersive VR environment.[9]
Its user interface, dubbed3Data Operations Center, seems similar to Virtualitics with a plot front and center and details surrounding the user in a virtual room, albeit slightly less polished. Like its competitor, 3Data also offers collaboration features.
2.3. State of the art The product is sold solely to companies as an applications suite called 3Data
Power Office, which in addition to the VR viewer includes tools for creating
immersive presentations and collaboration with other stakeholders. Datasets can be self-hosted, 3Data promises direct connection to databases and existing BI tools.[10]
A defining feature of 3Data is its ability to run across multiple classes of devices. The visualization component is compliant with the WebVR specification, which enables it to run on VR/AR headsets, handheld mobile devices and personal computers in both 2D and immersive modes.[30] 3Data does not seem to offer a dataset editing tool of its own, relying instead on third-party applications. At the moment, the product does not support any analytical features, however support for IBM Watson is coming soon. After a detailed inspection, we concluded that there are no FOSS components whatsoever.
2.3.4 Summary
We have analyzed three products from the area of immersive analytics. The following chart compares their features.
Chapter
3
Design
In this chapter we will discuss in detail the target user group and use cases of our application, specify important goals that we would like to meet, select features to help us meet these goals and talk about implications of virtual reality prototyping on our design process.3.1 Personas
The following personas characterize potential users of our application.
3.1.1 Novice
Figure 3.1: Persona — Frank.
Frank is a hobbyist. He is capable of performing basic computer operations, such as browsing the Internet or using an office suite. Lately, he came across an interesting dataset that highlights population growth in different areas of the world over the past couple centuries. Frank is quite impatient when it comes to computers and gets easily frustrated with complex pieces of software. As such, he is looking for a tool that will enable him to view this data without too much hassle.
3. Design
3.1.2
Power user
Figure 3.2: Persona — Quinn.
Quinn is a senior data analyst working at a meteorological agency. She possesses advanced programming skills and her current task is to build a networked swarm of drones that gather meteorological data from locations around her neighbourhood. She wants to remotely access the measured data and share measurements from particular days with her colleagues.
3.1.3
IT administrator
Figure 3.3: Persona — Paul.
Paul works as an IT technician at a corporate bank. He has been tasked by the company to find and recommend an immersive analytics platform to be used by its employees. Paul wants the software to store data locally in order to achieve compliance with new data regulations, integrate easily with existing processes inside the company and have the ability to audit the software. Although he is an experienced administrator with many years under his belt, he always enjoys software that is hassle-free to run and easy to set up.
3.2
Task analysis
The goal of our research is to create a virtual reality visualization environment that is accessible to everyone, is easily extensible by outside developers and works on 3DOF and 6DOF HMDs, no matter whether they are connected to a personal computer or function as standalone devices. Different control styles should be taken into account when designing interactions. The following graph
3.2. Task analysis Task Description
Prepare data The user has to define the underlying structure of data they want to use. This is typically a local file in a certain format or an API provided by a third-party application. They can then proceed to retrieve such data and specify various associated features (metadata), such as attribute types or labels (in case of multivariate data). They are also able to select a subset of data to work with or fill in missing values.
Map data The user makes an informed decision on which plot type they wish to use and associates attributes from their dataset with its features. They are also able to conduct plot-specific filtering (e.g. by modifying the range of displayed values on a spatial axis in scatter plots).
Analyze data This task includes looking at plots from different viewpoints and discovering further information by consulting the le-gend.
Collaborate Collaboration can be divided into two distinct areas — syn-chronous and asynsyn-chronous. If the user we are collaborating with is available for real-time collaboration, we can invite them to a persistent virtual space and communicate using voice and physical gestures that map onto our virtual avatars. Alternatively, we are able to send them a copy of our dataset, which they can analyze at their leisure.
Table 3.1: Description of tasks in hierarchical task analysis.
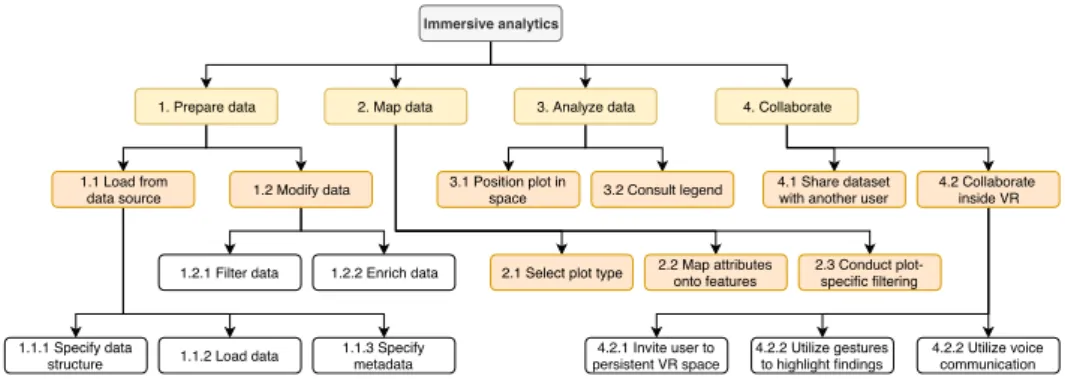
illustrates tasks that are typical for immersive analytics software (and for the most part, traditional business intelligence tools). High-level tasks are broken down into subtasks as is commonplace in hierarchical task analysis.[32]
Immersive analytics
1. Prepare data 2. Map data 3. Analyze data
1.1.1 Specify data
structure 1.1.2 Load data
1.1.3 Specify metadata 1.1 Load from
data source 1.2 Modify data
1.2.1 Filter data 1.2.2 Enrich data 2.1 Select plot type 2.2 Map attributesonto features 2.3 Conduct plot-specific filtering 3.1 Position plot in
space 3.2 Consult legend
4. Collaborate
4.1 Share dataset with another user
4.2 Collaborate inside VR 4.2.1 Invite user to persistent VR space 4.2.2 Utilize gestures to highlight findings 4.2.2 Utilize voice communication Figure 3.4: Hierarchical task analysis of typical immersive analytics software.
The users typically traverse these tasks in order, however, depending on the scenario, they may want to repeat tasks 2-4. It is important to note, that when collaborating with another user, tasks 1-2 can be skipped. Detailed descriptions of each task follow.
3. Design
3.3 Scenarios
Let us specify three scenarios that highlight certain use cases.
3.3.1 Loading a dataset from a local file
Frank opens up the application, logs in and proceeds to add a new dataset representing population growth in the last century. He locates a CSV file on his computer and answers a series of simple questions. After the application finishes loading the dataset, he promptly checks whether the data has been correctly loaded and attribute types correctly assigned. He notices that several attributes have been mistyped as numerical instead of locational and that several attribute labels are ambiguous. He proceeds to fix these issues and puts on a virtual reality headset.
Inside VR, Frank selects the dataset he had just uploaded and creates a globe plot. He assigns locational attributes onto compatible features of the plot and specifies a numerical attribute as value. As Frank rotates the globe, he observes several hotspots around the world — eastern portions of China catch his eye. He moves the globe closer towards him and continues to explore.
3.3.2
Creating an integration
Quinn has recently finished work on her new fleet of Internet-connected drones. She is using Python to periodically gather measurements of temperature, hu-midity, wind direction and wind speed. Every day at a set time, the drones travel along a pre-programmed path and log measurements at certain locations. These measurements are then dumped into a file, which is stored in the drone’s internal memory. Quinn, wanting to utilize the full capabilities of her drones, decides to add an integration to her Python script. She opens up our applica-tion, logs into her account and adds the file containing her last measurements as a new dataset. She then turns on a feature calledversion history, that enables her to upload multiple versions of the same dataset.
Quinn proceeds to look up the API key specific to the dataset she had just added along with instructions on how to set up the Python integration. After installing the integration from Python’s package manager, she replaces the bit of code that saves measured data as a file with a snippet that she found. The next day after her drones return from their travels, Quinn notices that a new version of data has been added to her dataset. She puts on her VR
3.4. Design goals headset, creates a map plot and assigns attributes from her dataset onto its features. Quinn then changes between the two versions and can see that today’s measurements indicate higher humidity in certain areas as well as a change in wind direction.
3.3.3 Collaborating with another user
Quinn wants to share her findings with her fellow employee, Bob. While in VR, she opens her friends list and notices that Bob is online. She invites him to join her in VR. Bob gets a notification and puts on his VR headset. He accepts the invitation and after waiting several seconds for Quinn’s data to load, appears in a shared virtual space beside Quinn’s virtual avatar. Quinn then briefs Bob on the current meteorological situation using the application’s voice communication functionality. She points to the area of interest and both agree that the situation is unusual. Bob requests a personal copy of the dataset and Quinn is happy to oblige. She takes off her VR headset and sends the dataset to Bob who then receives a prompt to accept the share request.
3.4 Design goals
Let us specify key design goals for our application.
3.4.1 Inclusivity
The application should be accessible to users without any prior experience with data analysis. Workflows that are expected to be utilized by the vast majority of users should be straightforward. More advanced functionality can be available for experienced users, but its presence should not deter newcomers from using the product.
3.4.2 Extensibility
The application has to be extensible to a certain degree as to give stakeholders the ability to integrate it with their existing software stack.
3.4.3 Data security
Users are not to be held hostage inside the application’s ecosystem (vendor lock). All data should be retrievable with ease by the user and a system administrator where applicable. There should be an option to store data locally without a requirement to connect to outside servers.
3. Design
3.4.4
Collaboration
The application should facilitate collaboration between multiple users. They should be able to share data with one another without being forced to resort to external tools. In an optimal scenario, they should have the ability to communicate and interact with one another inside the virtual environment.
3.4.5 Non-specificity
Use cases of our application should not be limited to a select field or domain of data.
3.4.6 Focus on VR
The application’s user interface should be tailor-made for virtual reality. It is to be designed around a spatial environment while mitigating all shortcomings of present-day virtual reality technology.
3.4.7
Availability
The application is to be available on all major virtual reality platforms across PC, mobile and standalone categories. The user should be able to retain a persistent copy of their data across all devices as they may for instance use a workstation at their workplace and a standalone system at home.
3.4.8
Automatization
When adding a new dataset, the application should be able to predict certain features, such as attribute type or structure of an uploaded dataset. The user should only be prompted if there is a high degree of uncertainty. In the inverse case, we will choose the most likely settings and allow the user to make modifications later at their leisure.
3.5
Feature selection
In this section, we will set the scope of our application by selecting features to meet aforementioned design goals and use cases. The user should be able to load industry-standard comma-delimited (CSV) files into the environment. Two data structures are to be supported —multivariate datasets, which contain multiple attributes arranged in columns and two-dimensional arrays of numerical values, which will be further referred to as matrix datasets for the lack of a
3.5. Feature selection more suitable term. Multivariate datasets may or may not include attribute labels. If they are present, they should be presented as a comma-delimited list on the first row of the file as per the example below.
S e p a l l e n g t h , S e p a l width , P e t a l l e n g t h , P e t a l width , S p e c i e s 5 . 1 , 3 . 5 , 1 . 4 , 0 . 2 , I r i s−s e t o s a 5 . 6 , 3 . 0 , 4 . 1 , 1 . 3 , I r i s−v e r s i c o l o r 6 . 3 , 3 . 3 , 6 . 0 , 2 . 5 , I r i s−v i r g i n i c a 0 . 3 , 0 . 4 , 0 . 6 , 0 . 4 , 0 . 3 0 . 4 , 0 . 5 , 0 . 7 , 0 . 5 , 0 . 4 0 . 6 , 0 . 4 , 0 . 5 , 0 . 4 , 0 . 6 0 . 4 , 0 . 5 , 0 . 7 , 0 . 5 , 0 . 4 0 . 3 , 0 . 4 , 0 . 6 , 0 . 4 , 0 . 3
When loading a new dataset into our application, the data type of each attribute should be automatically determined and presented to the user along with an option to change to another type that suits the provided data. In addition, the user should be presented with basic statistical data and data preview, so that they can make an informed decision regarding the data type of each attribute. The specifics of each attribute type are discussed later in this section. Users should also be able to change the label of each attribute and decide on how to fill in missing values.
The user should be able to load a new version of the dataset, provided the data structure meets dataset specifications. They are to be given an option to replace existing data or add a new version. In the latter case, the user will have the ability to change between versions when visualizing data from said dataset.
When in VR, the user will be able to choose between five types of plots discussed below, position them freely around the virtual environment, adjust their rotation and scale, assign dataset attributes onto features of the plot and view basic dataset metadata and statistics of attributes contained within said dataset. The user should also be able to filter by attribute value, regardless of whether said attribute is assigned onto a feature of the plot.
3. Design
Collaboration features should include the ability to share datasets with another user directly within the environment and also the ability to invite said user to a shared virtual environment with users represented as articulated virtual avatars that are capable of moving in space and voice communication.
Lastly, there should be integration support for popular programming languages that allows programmers to create or update datasets from their programming environment of choice. Since we cannot cater to all, we should provide the ability for outside developers to build their own integrations for other programming languages or environments.
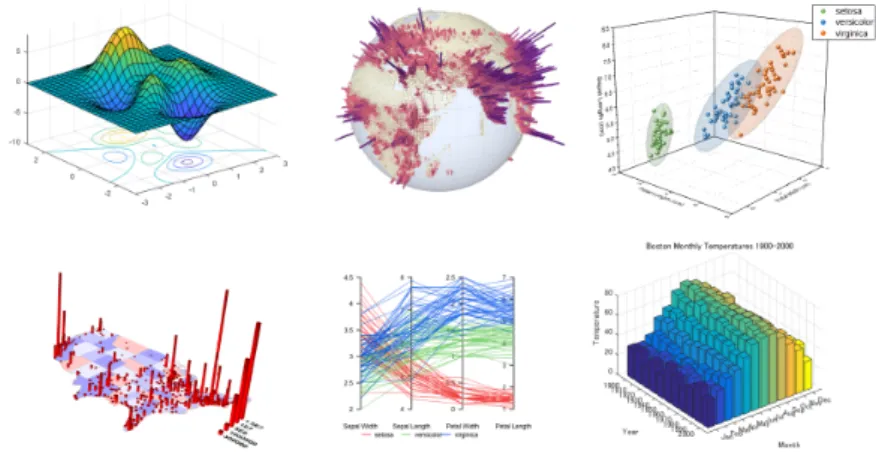
3.5.1 Plot types
In order to satisfy the non-specificity design goal, we have to offer the user a variety of plot options. Six plot types were selected for implementation, four for multivariate and two for spatial data (matrix datasets).
Figure 3.5: Clockwise from top left: surface plot, globe plot, scatter plot, bar plot, parallel coordinates plot, map plot.
3.5.1.1 Scatter plot
Accepts multivariate data. Allows the user to assign numerical values onto spatial axes, which determine the position of the nodes. Spatial axes also allow for the assignment of categorical attributes, however the ordering in this case is non-deterministic. The user is able to specify bounds for each axis. Assignable non-spatial features include color, size, shape and label, which is set to appear when the user points at a node.
3.5. Feature selection Color mapping differs based on the type of the assigned attribute. Numerical attributes map onto a gradient, which can be diverging (if the attribute includes both positive and negative numbers) or sequential (otherwise). When assigning a categorical attribute, each unique value is given a color with distinct hue. Size only accepts numerical attributes. Shape accepts either numerical or categorical attributes. In the former case, the values are divided into two bins of a similar size with median used as the division point, each half is then rendered as a different glyph. In the latter case, we try to map each unique value onto a distinct glyph. If the number of distinguishable glyphs is smaller than the number of unique values, one of the glyphs can substitute a greater number of unique values.
3.5.1.2 Globe plot
Accepts multivariate data. The globe plot accepts two locational attributes for coordinates (latitude, longitude) and a single numerical or categorical attribute. If a numerical attribute is assigned as a value, it renders bars that protrude from the globe. Assignment of a categorical attribute will result in the rendering of uniformly-sized marks of different colors, the hue of which is again distinct for each unique value.
3.5.1.3 Map plot
Accepts multivariate data. A flat version of the globe plot suitable for viewing smaller geospatial areas.
3.5.1.4 Parallel coordinate plot
Accepts multivariate data. Contains two or more axes, each of which represents a numerical or categorical attribute. A polyline is then created between the axes with vertices positioned in the same way as values on a spatial axis of a scatter plot. The user is able to position the axes around the space using an interaction technique borrowed from a distinguished paper.[6]
3.5.1.5 Surface plot
Accepts spatial data. Renders a continuous mesh, the elevation of which is determined by numerical values at a specified position in the two-dimensional matrix.
3. Design
3.5.1.6 Bar plot
Accepts spatial data. Renders a series of bars, with their height determined in the same way as with the surface plot.
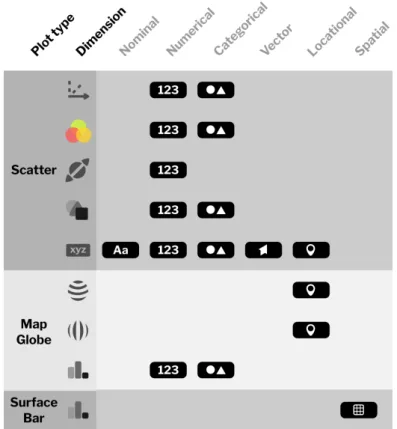
Figure 3.6: Type compatibility with different features of each plot.
3.5.2
Attribute types
This subsection lists attribute types to be supported by our application. As mentioned earlier, an attribute type is automatically assigned when loading a new dataset. The user is then given the ability to change to any other type provided the attribute in question meets the type’s requirements. Flow of the auto-assignment process is detailed by the following decision tree.
3.5. Feature selection
Vector
Do all values contain three numbers
separated by a comma?
Yes
Are all values numerical? No
Numerical
Are there less than 10 unique values? No
Do all values fall between <-180,180>? Categorical Nominal Locational Is the attribute labeled "lat","lon","latitude" or "longitude"? No Yes Yes No No Yes Yes
Figure 3.7: Decision tree for automatic assignment of attribute types in multivariate datasets.
3.5.2.1 Nominal
Nominal attributes do not have any special requirements. Attributes default to this type should they fail all other assignment checks.
3.5.2.2 Numerical
Numerical attributes represent numbers in both decimal and integer formats. Decimal point is to be represented by a dot. The type is automatically assigned if all of the attribute’s values are numeric and do not satisfy conditions set for the locational type.
3.5.2.3 Categorical
Categorical attributes do not have any special requirements. The type is automatically assigned if the attribute in question has less than 10 unique values, where 10 is an arbitrary number chosen by the author.
3.5.2.4 Vector
Vector type is designed for storing three-dimensional vectors. The accepted format is specified as three numerical values separated by spaces. If all values of a specific attribute adhere to this convention, the type is automatically assigned.
3.5.2.5 Locational
Locational type is a subset of the numerical type representing geospatial coordinates. Decimal values between –180 and 180 are permitted. The full range is used to represent longitude, while a reduced range from –90 to 90 represents latitude. An attribute is automatically determined to be spatial
3. Design
if it meets the requirements and is labeled as one of the following (case-insensitive): • latitude, • longitude, • lat, • lon 3.5.2.6 Spatial
Spatial type is exclusive to matrix datasets, where it represents the sole
“attribute”containing all data. It is automatically assigned and cannot be changed by the user. As it only supports numerical data, datasets that do not satisfy this condition will be treated as multivariate instead.
3.6
Component design
Two big issues in present-day virtual reality technology that we would like to focus on are low pixel density of displays on most consumer HMDs compared to modern computer monitors and non-intuitiveness of text input in VR. The first fact leads to poor legibility of text below a certain size. This effect is compounded in HMDs with an OLED screen, due to their characteristic pentile subpixel arrangement. Text input in VR typically consists of pointing the controller towards a virtual keyboard, the layout of which is reminiscent of its smartphone variant. Using such keyboard for a short amount of time is a mere inconvenience, attempting to do so for longer periods of time will lead to fatigue, due to the need to precisely position a controller in space.
Over the years, there have been many attempts to come up with a solution that mitigates the fatigue, one of which is a project called Punchkeyboard.[51] We had originally planned on designing a similar solution, however doing so would only work in 6DOF, requiring us to use a traditional keyboard interface in 3DOF. In order to alleviate both these issues, we came up with a component design, which divides the overall workflow — text input is done inside a WIMP interface on the computer, allowing the user to use the computer keyboard they are most likely already familiar with. Furthermore, usage of text in the VR part of our application is greatly reduced in favor of using icons.
3.6. Component design
Figure 3.8: Comparison of pixel density between a high-end consumer headset and a business-oriented HMD.[66]
Figure 3.9: Example use of Punchkeyboard.[51]
The three distinct components that we have chosen to divide our environment into are as follows — plugins, Manager and Navigator. Plugins are API integrations written for different programming languages that allow the user to create a new dataset or update an existing one. Manager enables the user to view and edit all of their datasets and also facilitates loading files from the local computer. Navigatorallows the user to interact with their data in virtual reality. The following visualization pipeline shows the distribution of tasks among our components.
3. Design
Figure 3.10: Adapted version of Haber–McNabb dataflow model for scientific visualization in the context of our environment.[54]
3.7
Challenges of VR design
The spatial nature of virtual reality applications carries with it certain design challenges, which make it difficult to utilize the typical prototyping workflow. As interaction techniques in VR are much more complex than in typical WIMP applications, we are unable to create a rich interactive prototype without being forced to delve into code. The typical workflow for VR prototyping consists of drawing sketches, creating 2D and 3D assets that we intend to use in our project and then positioning said assets inside astatic3D environment (spatial
prototyping). The user is then able to move between these scenes and also in 3D
space, but they are unable to interact with any of the objects.[39] Commonly used tools for spatial prototyping include Google Blocks[24] and Microsoft Maquette[44]. We will be using the latter as it is the more advanced of the two.
When it comes to our workflow, we will begin by creating a sketch of basic interactions. This is key, as the design of our user interface greatly depends on limitations imposed by the interaction scheme that we are going to use. We will follow up by creating a UI design for our application, which will share its design language with Manager, allowing for a consistent experience. Afterwards, we will alternate between designing prototypes in Maquette and implementing new features in our game engine of choice. After each run, we gather user feedback and attempt to incorporate it into our design.
Chapter
4
Manager
Figure 4.1: User interface of Manager.
Manager is the name for a component which enables the user to load datasets from their local computer and perform basic editing operations, such as data enrichment and attribute specification. In order to satisfy the design goal of mitigating all shortcomings of VR (Focus on VR), we have created a separate component that is accessible from a personal computer. Facilitation of collaboration, another of our design goals, demands that we create a centralized server node.
4. Manager
This backend will provide the users with a user account as well as a space to store all of their datasets and associated metadata. The design goal of availability mandates that the VR portion of our application suite should be made available on mobile and standalone headsets, as well as PC-based systems. As such, we had to figure out a way to access the data on any computer — an elegant solution is to create a web-based frontend.
To simplify our component design, we will use the term Manager to refer to both backend and frontend portions of this application, even though they are separate implementation-wise. Extensibility and data security will be achieved by open-sourcing the component, which enables outside developers to create integrations (plugins) and other stakeholders to audit the software.
4.1 Required functionality
Users should be able to do the following: • create a user account,
• upload new datasets,
• access previously uploaded datasets, • download previously uploaded datasets, • update an existing dataset,
• change attribute types,
• rename attribute labels and datasets, • share datasets,
• delete datasets
4.2 Wireframes
We began our design process by creating wireframes of the user interface. Two versions have been designed, the first consists of two separate views. The first view includes a listing of all uploaded datasets along with basic metadata — time of the last edit and users the dataset has been shared with. The presentation is reminiscent of folder listing in Google Drive.[29] The second view contains
4.2. Wireframes basic dataset metadata along with a selection of dataset-specific actions on the right-hand side. Data preview contains a histogram where applicable and a complete listing of data. It has been inspired by the UI of Kaggle.[37] Attribute-specific changes would have taken place inside a modal.
Figure 4.2: Wireframe of Manager’s interface (version 1) — dataset listing.
Figure 4.3: Wireframe of Manager’s interface (version 1) — dataset view.
The second version includes a more compact interface with a listing of datasets in a sidebar on the left, dataset information in the center and attribute-specific information in the bottom-right portion of the screen. Dataset-specific actions are accessible in the upper portion of the screen, followed by the listing of attributes, which use design consistent with the data panel in Navigator. Most interaction takes place in modals, the following wireframe illustrates the process of adding a new dataset from local file. In accordance with the design goal of automatization, the user is only asked to input necessary information — in our case the user has to select whether headers are present in the file.
4. Manager
Figure 4.4: Wireframe of Manager’s interface (version 2).
Figure 4.5: Wireframe detailing the process of uploading a new dataset from local file.
4.3 Design stage
In this stage, we have created a low-fidelity prototype of our user interface based on the second version discussed earlier. Inkscape vector imaging software was used.[57] The full version of the low-fidelity design is included with this thesis as a digital copy.
4.4 Implementation
The next stage included implementation of the component using Flask[53] and Vue.js[71] frameworks. Details are available in the chapter discussing used technology. The following two subsections include an overview of functionality available inside Manager.
4.4. Implementation
Figure 4.6: Low-fidelity prototype made in Inkscape.
4.4.1
August build
As Manager is a multi-user application, the user first has to create an account. After logging in, they are presented with a list of their datasets on a sidebar to the left. In the upper right corner of the screen, they can see their username and access a notification center, which is where they are able to answer share requests and, most importantly, access the VR headset management window. This window gives them information on headsets associated with their account, such as an identifier (name of HMD as well as the computer’s domain name if provided by host OS) and time of association.
In the lower left corner is a button titledAdd new dataset. Pressing it opens up a wizard for adding a dataset. The same wizard with slight differences is also used when updating an existing dataset. In the first step, the user can select their data source. If they choose a programming environment, they receive instructions on how to use the plugin system.
4. Manager
Figure 4.7: Options for adding a dataset.
If they choose to create a dataset from a local file, they are prompted to select a CSV file by either opening an OS-native file picker dialog or by dragging a file icon into their web browser. In the next step, they have to decide whether the first line of their file includes labels. After selecting an appropriate answer, the dataset is uploaded and appears in the sidebar. Attribute types are assigned automatically.
Figure 4.8: Dataset addition wizard.
Clicking on a dataset in the sidebar brings up the dataset view, which contains select metadata (number of attributes, row count, timestamp of last edit), buttons for accessing various functions and a listing of all attributes. For each
4.4. Implementation attribute, we can see its label, data type and a preview of its values. Clicking on an attribute brings up the attribute view that contains options to rename an attribute, change its data type (nominal, numerical, categorical, vector) and decide on which action to take in case some values are missing. With numerical attributes, we are able to view select statistical information, such as quartiles, mean and standard deviation.
If we return back to dataset-wide actions, we have the following options: • update dataset,
• manage dataset versions, • download dataset file,
• share dataset with another user, • rename dataset,
• delete dataset
Figure 4.9: Dataset actions. From left: Update, manage versions, download, share, rename, delete.
Sharing a dataset allows us to select a user with whom to share. The next time they log in, they are presented with a notification that enables them to either accept or decline the share request. Should they accept, the dataset is copied onto their account.
Datasets can be updated in the same way as they are created, that is using a local file or via the plugin system. The system checks for any type discrepancies and will refuse upload of data incompatible with current attributes. By default, existing data is overwritten on update. However, we can choose to enable
4. Manager
versioning in order to keep multiple copies of the same dataset, essentially adding a temporal dimension to our data. Examples of using this feature include a smart device for gathering data, which periodically uploads said data using the plugin system. Versions can be individually downloaded and deleted using the version management interface. Versioning can also be turned on or off on a per dataset basis.
Figure 4.10: Version management in Manager.
4.4.2 December build
The December build of Manager includes the addition of a new attribute type for storing locations, a brand new installation script that allows the administrator to install from source code using a single command as well as a number of bug fixes.
The most significant feature is support for spatial datasets. When adding all-numeric datasets, the user is asked to select whether the dataset in question is multivariate or spatial. Spatial datasets are compatible with certain plots inside Navigator, in both components they are represented as a single unified attribute with a special type.
4.4. Implementation
Chapter
5
Plugins
Plugins are intended for developers or power users to incorporate dataset creation and updating functionality into their applications and scripts. We have implemented integrations for Python and R, as they are the most commonly used programming languages by data scientists. Manager provides a set of APIs that enable outside developers to create their own integrations and as both Manager and official plugins are open-source[31], it is a very straightforward process.From the user’s perspective, the workflow to add or update a dataset is as follows:
1. Log into Manager.
2. Access the create/update dataset modal. 3. Select programming language or environment.
4. Copy API key that is unique for user (when creating a dataset) or dataset (when updating an existing dataset).
5. Import a library in the programming environment of choice. 6. Insert an applicable command.
![Figure 2.2: Left: Oculus Go controller offering 3 degrees of freedom. Right: Oculus Touch 6DOF controller.[72]](https://thumb-us.123doks.com/thumbv2/123dok_us/11061501.2992845/33.892.182.746.265.587/figure-oculus-controller-offering-degrees-freedom-oculus-controller.webp)
![Figure 2.4: Mapping view in Virtualitics’s desktop application.[69]](https://thumb-us.123doks.com/thumbv2/123dok_us/11061501.2992845/35.892.169.750.738.1041/figure-mapping-view-in-virtualitics-s-desktop-application.webp)
![Figure 2.5: Virtualitics’s VR interface.[69]](https://thumb-us.123doks.com/thumbv2/123dok_us/11061501.2992845/36.892.148.728.490.794/figure-virtualitics-s-vr-interface.webp)
![Figure 2.6: LookVR’s user interface.[63]](https://thumb-us.123doks.com/thumbv2/123dok_us/11061501.2992845/37.892.172.741.590.915/figure-lookvr-s-user-interface.webp)
![Figure 2.7: 3Data’s immersive VR environment.[9]](https://thumb-us.123doks.com/thumbv2/123dok_us/11061501.2992845/38.892.150.727.497.831/figure-data-s-immersive-vr-environment.webp)