Understanding Network Failures in Data Centers:
Measurement, Analysis, and Implications
Phillipa Gill
University of Toronto[email protected]
Navendu Jain
Microsoft Research[email protected]
Nachiappan Nagappan
Microsoft Research[email protected]
ABSTRACT
We present the first large-scale analysis of failures in a data
cen-ter network.Through our analysis, we seek to answer several
fun-damental questions: which devices/links are most unreliable, what causes failures, how do failures impact network traffic and how ef-fective is network redundancy? We answer these questions using multiple data sources commonly collected by network operators. The key findings of our study are that(1) data center networks show high reliability, (2) commodity switches such as ToRs and AggS are highly reliable, (3) load balancers dominate in terms of failure occurrences with many short-lived software related faults, (4) failures have potential to cause loss of many small packets such as keep alive messages and ACKs, and (5) network redundancy is only 40% effective in reducing the median impact of failure.
Categories and Subject Descriptors: C.2.3
[Computer-Comm-unication Network]: Network Operations
General Terms: Network Management, Performance, Reliability Keywords: Data Centers, Network Reliability
1.
INTRODUCTION
Demand fordynamic scalingand benefits from economies of scale are driving the creation of mega data centers to host a broad range of services such as Web search, e-commerce, storage backup, video streaming, high-performance computing, and data analytics. To host these applications, data center networks need to be scalable, efficient, fault tolerant, and easy-to-manage. Recognizing this need, the research community has proposed several architectures to im-prove scalability and performance of data center networks [2, 3, 12– 14, 17, 21]. However, the issue of reliability has remained unad-dressed, mainly due to a dearth of available empirical data on fail-ures in these networks.
In this paper, we study data center network reliability by ana-lyzing network error logs collected for over a year from thousands of network devices across tens ofgeographically distributed data
centers. Our goals for this analysis are two-fold. First, we seek
to characterize network failure patterns in data centers and under-stand overall reliability of thenetwork. Second, we want to leverage
Permission to make digital or hard copies of all or part of this work for personal or classroom use is granted without fee provided that copies are not made or distributed for profit or commercial advantage and that copies bear this notice and the full citation on the first page. To copy otherwise, to republish, to post on servers or to redistribute to lists, requires prior specific permission and/or a fee.
SIGCOMM’11, August 15-19, 2011, Toronto, Ontario, Canada.
Copyright 2011 ACM 978-1-4503-0797-0/11/08 ...$10.00.
lessons learned from this study to guide the design of future data center networks.
Motivated by issues encountered by network operators, we study network reliability along three dimensions:
• Characterizing the most failure prone network elements. To
achieve high availability amidst multiple failure sources such as hardware, software, and human errors, operators need to focus on fixing the most unreliable devices and links in the network. To this end, we characterize failures to identify network elements
withhigh impact on network reliability e.g., those that fail with high frequency or that incur high downtime.
• Estimating the impact of failures. Given limited resources at
hand, operators need to prioritize severe incidents for troubleshoot-ing based on their impact to end-users and applications. In gen-eral, however, it is difficult to accurately quantify a failure’s im-pact from error logs, and annotations provided by operators in trouble tickets tend to be ambiguous. Thus, as a first step, we estimate failure impact by correlating event logs with recent net-work traffic observed on links involved in the event. Note that
logged events donot necessarily result in a service outage
be-cause of failure-mitigation techniques such as network redun-dancy [1] and replication of compute and data [11, 27], typically deployed in data centers.
• Analyzing the effectiveness of network redundancy. Ideally,
operators want to mask all failures before applications experi-ence any disruption. Current data center networks typically pro-vide 1:1 redundancy to allow traffic to flow along an alternate route when a device or link becomes unavailable [1]. However, this redundancy comes at a high cost—both monetary expenses and management overheads—to maintain a large number of net-work devicesand linksin the multi-rooted tree topology. To ana-lyze its effectiveness, we compare traffic on a per-link basis dur-ing failure events to traffic across all links in the network redun-dancy group where the failure occurred.
For our study, we leverage multiple monitoring tools put in place by our network operators. We utilize data sources that vide both a static view (e.g., router configuration files, device pro-curement data) and a dynamic view (e.g., SNMP polling, syslog, trouble tickets) of the network. Analyzing these data sources, how-ever, poses several challenges. First, since these logs track low level network events, they do not necessarily imply application perfor-mance impact or service outage. Second, we need to separate fail-ures that potentially impact network connectivity from high volume and often noisy network logs e.g., warnings and error messages even when the device is functional. Finally, analyzing the effec-tiveness of network redundancy requires correlating multiple data
sources across redundant devices and links. Through our analysis, we aim to address these challenges to characterize network fail-ures, estimate the failure impact, and analyze the effectiveness of network redundancy in data centers.
1.1
Key observations
We make several key observations from our study:
• Data center networks are reliable. We find that overall the data
center network exhibits high reliability with more than four 9’s of availability for about 80% of the links and for about 60% of the devices in the network (Section 4.5.3).
• Low-cost, commodity switches are highly reliable. We find
that Top of Rack switches (ToRs) and aggregation switches ex-hibit the highest reliability in the network with failure ratesof
about 5% and 10%, respectively. This observation supports net-work design proposals that aim to build data center netnet-works using low cost, commodity switches [3, 12, 21] (Section 4.3).
• Load balancers experience a high number of software faults.
We observe 1 in 5 load balancers exhibit a failure (Section 4.3) and that they experience many transient software faults (Sec-tion 4.7).
• Failures potentially cause loss of a large number of small packets. By correlating network traffic with link failure events, we estimate the amount of packets and data lost during failures. We find that most failures lose a large number of packets rela-tive to the number of lost bytes (Section 5), likely due to loss of protocol-specific keep alive messages or ACKs.
• Network redundancy helps, but it is not entirely effective.
Ideally, network redundancy should completely mask all fail-ures from applications. However, we observe that network re-dundancy is only able to reduce the median impact of failures (in terms of lost bytes or packets) by up to 40% (Section 5.1).
Limitations. As with any large-scale empirical study, our results are subject to several limitations. First, the best-effort nature of fail-ure reporting may lead to missed events or multiply-logged events. While we perform data cleaning (Section 3) to filter the noise, some events may still be lost due to software faults (e.g., firmware errors) or disconnections (e.g., under correlated failures). Second, human bias may arise in failure annotations (e.g., root cause). This concern is alleviated to an extent by verification with operators, and scale and diversity of our network logs. Third, network errors do not al-ways impact network traffic or service availability, due to several factors such as in-built redundancy at network, data, and applica-tion layers. Thus, our failure rates should not be interpreted as im-pacting applications. Overall, we hope that this study contributes to a deeper understanding of network reliability in data centers.
Paper organization. The rest of this paper is organized as follows.
Section 2 presents our network architecture and workload charac-teristics. Data sources and methodology are described in Section 3. We characterize failures over a year within our data centers in Sec-tion 4. We estimate the impact of failures on applicaSec-tions and the effectiveness of network redundancy in masking them in Section 5. Finally we discuss implications of our study for future data center networks in Section 6. We present related work in Section 7 and conclude in Section 8.
Internet
LB LB LB LBLayer 2
Layer 3
Data center
Internet
ToR ToR ToR ToR
AggS AggS AccR AccR Core Core
}
primary and back upFigure 1: A conventional data center network architecture adapted from figure by Cisco [12]. The device naming conven-tion is summarized in Table 1.
Table 1: Summary of device abbreviations
Type Devices Description
AggS AggS-1, AggS-2 Aggregation switches LB LB-1, LB-2, LB-3 Load balancers ToR ToR-1, ToR-2, ToR-3 Top of Rack switches
AccR - Access routers
Core - Core routers
2.
BACKGROUND
Our study focuses on characterizing failure events within our organization’s set of data centers. We next give an overview of data center networks and workload characteristics.
2.1
Data center network architecture
Figure 1 illustrates an example of a partial data center net-work architecture[1]. In the network, rack-mounted servers are connected (or dual-homed) to a Top of Rack (ToR) switch usu-ally via a 1 Gbps link. The ToR is in turn connected to a primary and back up aggregation switch (AggS) for redundancy. Each re-dundant pair of AggS aggregates traffic from tens of ToRs which is then forwarded to the access routers (AccR). The access routers aggregate traffic from up to several thousand servers and route it to core routers that connect to the rest of the data center network and Internet.
All links in our data centers use Ethernet as the link layer protocol and physical connections are a mix of copper and fiber cables. The servers are partitioned into virtual LANs (VLANs) to limit overheads (e.g., ARP broadcasts, packet flooding) and to iso-late different applications hosted in the network. At each layer of the data center network topology, with the exception of a subset of ToRs,1:1 redundancyis built into the network topology to miti-gate failures. As part of our study, we evaluatethe effectiveness of redundancy in masking failures when one (or more) components fail, and analyze how the tree topology affects failure characteris-tics e.g., correlated failures.
In addition to routers and switches, our network contains many middle boxes such as load balancers and firewalls. Redundant pairs of load balancers (LBs) connect to each aggregation switch and
0.0 0.2 0.4 0.6 0.8 1.0 0.0 0.2 0.4 0.6 0.8 1.0
Daily 95th percentile utilization
P[X<x] TRUNK LB MGMT CORE ISC IX Overall
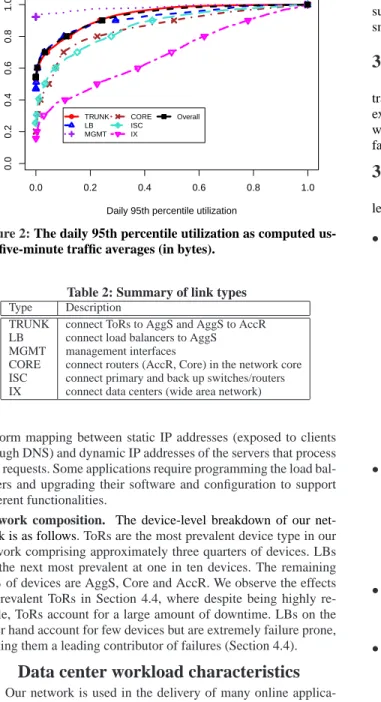
Figure 2:The daily 95th percentile utilization as computed us-ing five-minute traffic averages (in bytes).
Table 2: Summary of link types Type Description
TRUNK connect ToRs to AggS and AggS to AccR LB connect load balancers to AggS MGMT management interfaces
CORE connect routers (AccR, Core) in the network core ISC connect primary and back up switches/routers IX connect data centers (wide area network)
perform mapping between static IP addresses (exposed to clients through DNS) and dynamic IP addresses of the servers that process user requests. Some applications require programming the load bal-ancers and upgrading their software and configuration to support different functionalities.
Network composition. The device-level breakdown of our net-work is as follows. ToRs are the most prevalent device type in our network comprising approximately three quarters of devices. LBs are the next most prevalent at one in ten devices. The remaining 15% of devices are AggS, Core and AccR. We observe the effects of prevalent ToRs in Section 4.4, where despite being highly re-liable, ToRs account for a large amount of downtime. LBs on the other hand account for few devices but are extremely failure prone, making them a leading contributor of failures (Section 4.4).
2.2
Data center workload characteristics
Our network is used in the delivery of many online applica-tions. As a result, it is subject to many well known properties of data center traffic; in particular the prevalence of a large volume of short-lived latency-sensitive “mice” flows and a few long-lived throughput-sensitive“elephant” flowsthat make up the majority of bytes transferred in the network.These properties have also been
observed by others [4, 5, 12].
Network utilization. Figure 2 shows thedaily 95th percentile uti-lization as computed using five-minute traffic averages (in bytes).
We divide links into six categories based on their role in the net-work (summarized in Table 2). TRUNK and LB links which re-side lower in the network topology are least utilized with 90% of TRUNK links observing less than 24% utilization. Links higher in the topology such as CORE links observe higher utilization with 90% of CORE links observing less than 51% utilization. Finally, links that connect data centers (IX) are the most utilized with35%
observing utilization of more than 45%. Similar to prior studies
of data center network traffic [5], we observe higher utilization at upper layers of the topology as a result of aggregationand high
bandwidth oversubscription [12]. Note that since the traffic
mea-surement is at the granularity of five minute averages, it is likely to smooth the effect of short-lived traffic spikes on link utilization.
3.
METHODOLOGY AND DATA SETS
The network operators collect data from multiple sources to track the performance and health of the network. We leverage these existing data sets in our analysis of network failures. In this section, we first describe the data sets and then the steps we took to extract failures of network elements.
3.1
Existing
data sets
The data sets used in our analysis are a subset of what is col-lected by the network operators.We describe these data sets in turn:
• Network event logs (SNMP/syslog). We consider logs derived
from syslog, SNMP traps and polling, collected by our network operators. The operators filter the logs to reduce the number of transient events and produce a smaller set of actionable events. One of the filtering rules excludes link failures reported by servers connected to ToRs as these links are extremely prone to spurious port flapping (e.g., more than 100,000 events per hour across the network). Of the filtered events, 90% are assigned to NOC tickets that must be investigated for troubleshooting. These event logs contain information about what type of network element expe-rienced the event, what type of event it was, a small amount of descriptive text (machine generated) and an ID number for any NOC tickets relating to the event. For this study we analyzed a year’s worth of events from October 2009 to September 2010.
• NOC Tickets. To track the resolution of issues, the operators
employ a ticketing system. Tickets contain information about when and how events were discovered as well as when they were resolved. Additional descriptive tags are applied to tickets de-scribing the cause of the problem, if any specific device was at fault, as well as a “diary” logging steps taken by the operators as they worked to resolve the issue.
• Network traffic data. Data transferred on network interfaces is
logged using SNMP polling. This data includes five minute aver-ages of bytes and packets into and out of each network interface.
• Network topology data. Given the sensitive nature of network
topology and device procurement data, we used a static snapshot of our network encompassing thousands of devices and tens of thousands of interfaces spread across tens of data centers.
3.2
Defining and identifying failures
When studying failures, it is important to understand what types of logged events constitute a “failure”. Previous studies have looked at failures as defined by pre-existing measurement frame-works such as syslog messages [26], OSPF [25, 28] or IS-IS listen-ers [19]. These approaches benefit from a consistent definition of failure, but tend to be ambiguous when trying to determine whether a failure had impact or not. Syslog messages in particular can be spurious with network devices sending multiple notifications even though a link is operational. For multiple devices, we observed this type of behavior after the device was initially deployed and the router software went into an erroneous state. For some devices, this effect was severe, with one device sending 250 syslog “link down” events per hour for 2.5 months (with no impact on applications) before it was noticed and mitigated.
We mine network event logs collected over a year to extract events relating to device and link failures.Initially, we extract all
logged “down” events for network devices and links.This leads us to define two types of failures:
Link failures: A link failure occurs when the connection between
two devices (on specific interfaces) is down.These events are
de-tected by SNMP monitoring on interface stateof devices.
Device failures: A device failure occurs when the device is not functioning for routing/forwarding traffic. These events can be caused by a variety of factors such as a device being powered down for maintenance or crashing due to hardware errors.
We refer to each logged event as a “failure” to understand the occurrence of low level failure events in our network. As a result, we may observe multiple component notifications related to a sin-gle high level failure or a correlated event e.g., a AggS failure re-sulting in down events for its incident ToR links. We also correlate failure events with network traffic logs to filter failures with
im-pact that potentially result in loss of traffic (Section 3.4); we leave
analyzing application performance and availability under network failures, to future work.
3.3
Cleaning the data
We observed two key inconsistencies in the network event logs stemming from redundant monitoring servers being deployed. First, a single element (link or device) may experience multiple “down” events simultaneously. Second, an element may experience another down event before the previous down event has been re-solved. We perform two passes of cleaning over the data to resolve these inconsistencies. First, multiple down events on the same ele-ment that start at the same time are grouped together. If they do not end at the same time, the earlier of theirendtimes is taken. In the case of down events that occur for an element that is already down, we group these events together, taking the earliest down time of the events in the group. For failures that are grouped in this way we take the earliest end time for the failure. We take the earliest failure end times because of occasional instances where events were not marked as resolved until long after their apparent resolution.
3.4
Identifying failures with impact
As previously stated, one of our goals is to identify failures that potentially impact end-users and applications. Since we did not have access to application monitoring logs, wecannot precisely
quantify application impact such as throughput lossor increased re-sponse times. Therefore, we instead estimate the impact of failures on network traffic.
To estimate traffic impact, we correlate each link failure with traffic observed on the link in the recent past before the time of failure. We leverage five minute traffic averages for each link that failed and compare the median traffic on the link in the time win-dow preceding the failure event and the median traffic during the failure event. We say a failure has impacted network traffic if the median traffic during the failure is less than the traffic before the failure. Since many of the failures we observe have short durations (less than ten minutes) and our polling interval is five minutes, we do not require that traffic on the link go down to zero during the failure. We analyze the failure impact in detail in Section 5.
Table 3 summarizes the impact of link failures we observe. We separate links that were transferring no data before the failure into two categories, “inactive” (no data before or during failure) and “provisioning” (no data before, some data transferred during fail-ure). (Note that these categories are inferred based only on traffic observations.) The majority of failures we observe are on links that
areinactive(e.g., a new device being deployed), followed by link
failures with impact. We also observe a significant fraction of link
Table 3: Summary of logged link events Category Percent Events
All 100.0 46,676 Inactive 41.2 19,253 Provisioning 1.0 477 No impact 17.9 8,339 Impact 28.6 13,330 No traffic data 11.3 5,277
failure notifications where no impact was observed(e.g., devices experiencing software errors at the end of the deployment process). For link failures, verifying that the failure caused impact to network traffic enables us to eliminate many spurious notifications from our analysis and focus on events that had a measurable impact on network traffic. However, since we do not have application level monitoring, we are unable to determine if these events impacted applications or if there were faults that impacted applications that we did not observe.
For device failures, we perform additional steps to filter spuri-ous failure messages (e.g., down messages caused by software bugs when the device is in fact up). If a device is down, neighboring de-vices connected to it will observe failures on inter-connecting links. For each device down notification, we verify that at least one link failure with impact has been noted for links incident on the device within a time window of five minutes. This simple sanity check
sig-nificantly reduces the number of device failures we observe.Note
that if the neighbors of a device fail simultaneously e.g., due to a correlated failure, we may not observe a link-down message for that device.
For the remainder of our analysis, unless stated otherwise, we consider only failure events that impacted network traffic.
4.
FAILURE ANALYSIS
4.1
Failure event panorama
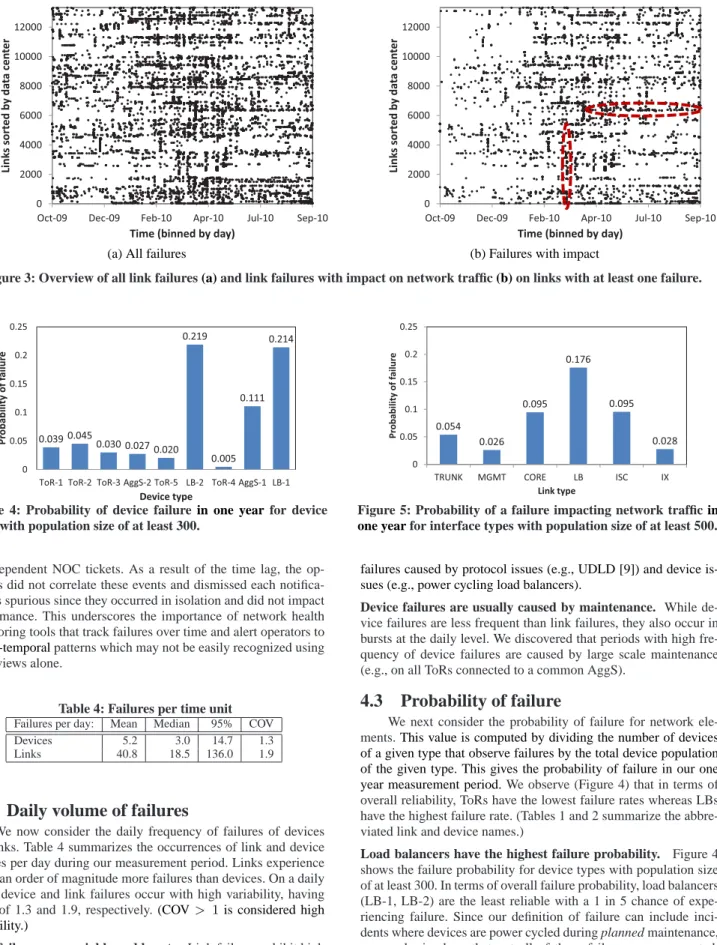
Figure 3 illustrates how failures are distributed across our mea-surement period and across data centers in our network. It shows plots for links that experience at least one failure, both for all fail-ures and those with potential impact; the y-axis is sorted by data center and the x-axis is binned by day. Each point indicates that the link (y) experienced at least one failure on a given day (x).
All failures vs. failures with impact. We first compare the view of
all failures (Figure 3(a)) to failures having impact (Figure 3(b)). Links that experience failures impacting network traffic are only about one third of the population of links that experience failures. We do not observe significant widespread failures in either plot, with failures tending to cluster within data centers, or even on in-terfaces of a single device.
Widespread failures: Vertical bands indicate failures that were
spatially widespread. Upon further investigation, we find that these tend to be related to software upgrades. For example, the vertical band highlighted in Figure 3(b)was due to an upgradeofload bal-ancer software that spanned multiple data centers. In the case of planned upgrades, the network operators are able to take precau-tions so that the disrupprecau-tions do not impact applicaprecau-tions.
Long-lived failures: Horizontal bands indicate link failures on a
common link or device over time. These tend to be caused by prob-lems such as firmware bugs or device unreliability (wider bands indicate multiple interfaces failed on a single device). We observe horizontal bands with regular spacing between link failure events. In one case, these events occurred weekly and were investigated
0 2000 4000 6000 8000 10000 12000
Oct-09 Dec-09 Feb-10 Apr-10 Jul-10 Sep-10
Link s so rt ed b y da ta ce n ter
Time (binned by day)
(a) All failures
0 2000 4000 6000 8000 10000 12000
Oct-09 Dec-09 Feb-10 Apr-10 Jul-10 Sep-10
Link s so rt ed b y da ta ce n ter
Time (binned by day)
(b) Failures with impact
Figure 3: Overview of all link failures(a)and link failures with impact on network traffic(b)on links with at least one failure.
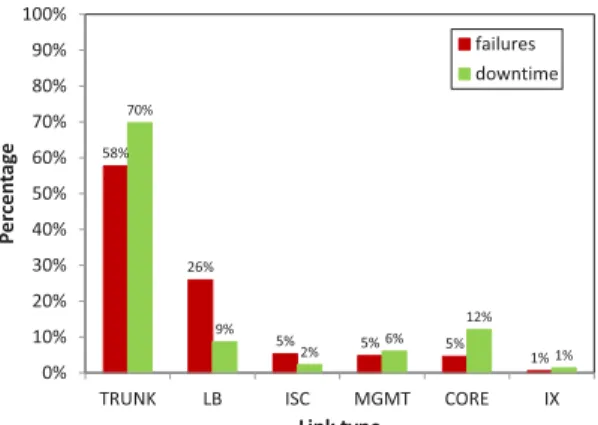
0.039 0.045 0.030 0.027 0.020 0.219 0.005 0.111 0.214 0 0.05 0.1 0.15 0.2 0.25
ToR-1 ToR-2 ToR-3 AggS-2 ToR-5 LB-2 ToR-4 AggS-1 LB-1
Pr o babili ty o f f ailur e Device type
Figure 4: Probability of device failure in one year for device types with population size of at least 300.
0.054 0.026 0.095 0.176 0.095 0.028 0 0.05 0.1 0.15 0.2 0.25
TRUNK MGMT CORE LB ISC IX
Pr o b a b il ity o f fa il u re Link type
Figure 5: Probability of a failure impacting network trafficin one yearfor interface types with population size of at least 500.
in independent NOC tickets. As a result of the time lag, the op-erators did not correlate these events and dismissed each notifica-tion as spurious since they occurred in isolanotifica-tion and did not impact performance. This underscores the importance of network health monitoring tools that track failures over time and alert operators to
spatio-temporalpatterns which may not be easily recognized using
local views alone.
Table 4: Failures per time unit Failures per day: Mean Median 95% COV
Devices 5.2 3.0 14.7 1.3
Links 40.8 18.5 136.0 1.9
4.2
Daily volume of failures
We now consider the daily frequency of failures of devices and links. Table 4 summarizes the occurrences of link and device failures per day during our measurement period. Links experience about an order of magnitude more failures than devices. On a daily basis, device and link failures occur with high variability, having COV of 1.3 and 1.9, respectively.(COV > 1is considered high variability.)
Link failures are variable and bursty. Link failures exhibit high
variability in their rate of occurrence. We observedbursts of link
failures caused by protocol issues (e.g., UDLD [9]) and device is-sues (e.g., power cycling load balancers).
Device failures are usually caused by maintenance. While
de-vice failures are less frequent than link failures, they also occur in bursts at the daily level. We discovered that periods with high fre-quency of device failures are caused by large scale maintenance (e.g., on all ToRs connected to a common AggS).
4.3
Probability of failure
We next consider the probability of failure for network ele-ments.This value is computed by dividing the number of devices of a given type that observe failures by the total device population of the given type. This gives the probability of failure in our one
year measurement period.We observe (Figure 4) that in terms of
overall reliability, ToRs have the lowest failure rates whereas LBs have the highest failure rate. (Tables 1 and 2 summarize the abbre-viated link and device names.)
Load balancers have the highest failure probability. Figure 4 shows the failure probability for device types with population size of at least 300. In terms of overall failure probability, load balancers (LB-1, LB-2) are the least reliable with a 1 in 5 chance of expe-riencing failure. Since our definition of failure can include inci-dents where devices are power cycled during planned maintenance, we emphasize here that not all of these failures are unexpected. Our analysis of load balancer logs revealed several causes of these
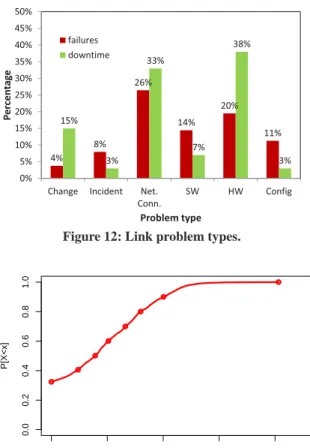
38% 28% 15% 9% 4% 4% 2% 18% 66% 5% 8% 0.4% 0% 10% 20% 30% 40% 50% 60% 70% 80% 90% 100%
LB-1 LB-2 ToR-1 LB-3 ToR-2 AggS-1
P er ce n tag e Device type failures downtime
Figure 6: Percent of failures and downtime per device type.
58% 26% 5% 5% 5% 1% 70% 9% 2% 6% 12% 1% 0% 10% 20% 30% 40% 50% 60% 70% 80% 90% 100%
TRUNK LB ISC MGMT CORE IX
P er ce n tag e Link type failures downtime
Figure 7: Percent of failures and downtime per link type. Table 5: Summary of failures per device (for devices that
expe-rience at least one failure).
Device type Mean Median 99% COV
LB-1 11.4 1.0 426.0 5.1 LB-2 4.0 1.0 189.0 5.1 ToR-1 1.2 1.0 4.0 0.7 LB-3 3.0 1.0 15.0 1.1 ToR-2 1.1 1.0 5.0 0.5 AggS-1 1.7 1.0 23.0 1.7 Overall 2.5 1.0 11.0 6.8
transient problems such as software bugs, configuration errors, and hardware faults related to ASIC and memory.
ToRshave low failure rates. ToRs have among the lowest fail-ure rate across all devices.This observation suggests that low-cost, commodity switches are not necessarily less reliable than their
ex-pensive, higher capacity counterparts and bodes wellfor data
cen-ter networking proposals that focus on using commodity switches to build flat data center networks [3, 12, 21].
We next turn our attention to the probability of link failures at differentlayersin our network topology.
Load balancer links have the highest rate of logged failures.
Figure 5 shows the failure probability for interface types with a population size of at least 500. Similar to our observation with de-vices, links forwarding load balancer traffic are most likely to ex-perience failures (e.g., as a result of failures on LB devices).
Links higher in the network topology (CORE) and links con-necting primary and back up of the same device (ISC) are the sec-ond most likely to fail, each with an almost 1 in 10 chance of
fail-ure.However, these events are more likely to be masked by network
redundancy (Section 5.2).In contrast, links lower in the topology
(TRUNK) only have about a 5% failure rate.
Management and inter-data center links have lowest failure rate. Links connecting data centers (IX) and for managing devices
have high reliability with fewer than 3% of each of these link types failing. This observation is important because these links are the most utilized and least utilized, respectively (cf. Figure 2). Links connecting data centers are critical to our network and hence back up links are maintained to ensure that failure of a subset of links does not impact the end-to-end performance.
4.4
Aggregate impact of failures
In the previous section, we considered the reliability of indi-vidual links and devices. We next turn our attention to the aggregate impact of each population in terms of total number of failure events
and total downtime. Figure 6 presents the percentage of failures and downtime for the different device types.
Load balancers have the most failures but ToRs have the most downtime. LBs have the highest number of failures of any device
type. Of our top six devices in terms of failures, half are load bal-ancers. However, LBs do not experience the most downtime which is dominated instead by ToRs. This is counterintuitive since, as we have seen, ToRs have very low failure probabilities. There are three factors at play here: (1) LBs are subject to more frequent software faults and upgrades (Section 4.7) (2) ToRs are the most prevalent device type in the network (Section 2.1), increasing their aggregate effect on failure events and downtime (3) ToRs are not a high pri-ority component for repair because of in-built failover techniques, such as replicating data and compute across multiple racks, that aim to maintain high service availability despite failures.
We next analyze the aggregate number of failures and down-time for network links. Figure 7 shows the normalized number of failures and downtime for the six most failure prone link types.
Load balancer links experience many failure events but rela-tively small downtime. Load balancer links experience the second
highest number of failures, followed by ISC, MGMT and CORE links which all experience approximately 5% of failures. Note that despite LB links being second most frequent in terms of number of failures, they exhibit less downtime than CORE links (which, in contrast, experience about 5X fewer failures). This result suggests that failures for LBs are short-lived and intermittent caused by tran-sient software bugs, rather than more severe hardware issues. We investigate these issues in detail in Section 4.7.
We observe that the total number of failures and downtime are dominated byLBs and ToRs, respectively. We next consider how many failures each element experiences. Table 5 shows the mean, median, 99th percentile and COV for the number of failures observed per device over a year (for devices that experience at least one failure).
Load balancer failures dominated by few failure prone devices.
We observe that individual LBs experience a highly variable num-ber of failures with a few outlier LB devices experiencing more than 400 failures. ToRs, on the other hand, experience little vari-ability in terms of the number of failures with most ToRs experi-encing between 1 and 4 failures. We make similar observations for links, where LB links experience very high variability relative to others (omitted due to limited space).
4.5
Properties of failures
We next consider the properties of failures for network ele-ment types that experienced the highest number of events.
1e+02 1e+03 1e+04 1e+05 1e+06 0.0 0.2 0.4 0.6 0.8 1.0 Time to repair (s) P[X<x] LB−1 LB−2 ToR−1 LB−3 ToR−2 AggS−1 Overall 5 min 1 hour 1 day 1 week LB−1 LB−2 ToR−1 LB−3 ToR−2 AggS−1 Overall
(a) Time to repair for devices
1e+00 1e+02 1e+04 1e+06
0.0 0.2 0.4 0.6 0.8 1.0
Time between failures (s)
P[X<x] LB−1 LB−2 ToR−1 LB−3 ToR−2 AggS−1 Overall 5 min
1 hour 1 day 1 week
(b) Time between failures for devices
1e+02 1e+03 1e+04 1e+05 1e+06
0.0 0.2 0.4 0.6 0.8 1.0 Annual downtime (s) P[X<x] LB−1 LB−2 ToR−1 LB−3 ToR−2 AggS−1 Overall two 9’s three 9’s four 9’s five 9’s LB−1 LB−2 ToR−1 LB−3 ToR−2 AggS−1 Overall
(c)Annualized downtime for devices Figure 8: Properties of device failures.
1e+02 1e+03 1e+04 1e+05 1e+06
0.0 0.2 0.4 0.6 0.8 1.0 Time to repair (s) P[X<x] TRUNK LB MGMT CORE ISC IX Overall
5 min 1 hour 1 day 1 week TRUNK LB MGMT CORE ISC IX Overall
(a) Time to repair for links
1e+00 1e+02 1e+04 1e+06
0.0 0.2 0.4 0.6 0.8 1.0
Time between failures (s)
P[X<x] TRUNK LB MGMT CORE ISC IX Overall
5 min 1 hour 1 day 1 week TRUNK LB MGMT CORE ISC IX Overall
(b) Time between failures for links
1e+02 1e+03 1e+04 1e+05 1e+06
0.0 0.2 0.4 0.6 0.8 1.0 Annual downtime (s) P[X<x] TRUNK LB MGMT CORE ISC IX Overall two 9’s three 9’s four 9’s five 9’s TRUNK LB MGMT CORE ISC IX Overall
(c) Annualized downtime for links Figure 9: Properties of link failures that impacted network traffic.
4.5.1
Time to repair
This section considers the time to repair (or duration) for fail-ures, computed as the time between a down notification for a net-work element and when it is reported as being back online. It is not always the case that an operator had to intervene to resolve the failure. In particular, for short duration failures, it is likely that the fault was resolved automatically (e.g., root guard in the spanning tree protocol can temporarily disable a port [10]). In the case of link failures, our SNMP polling interval of four minutes results in a grouping of durations around four minutes (Figure 9 (a)) indicating that many link failures are resolved automatically without operator intervention. Finally, for long-lived failures, the failure durations may be skewed by when the NOC tickets were closed by network operators.For example, some incident tickets may not be termed as ’resolved’ even if normal operation has been restored, until a hardware replacement arrives in stock.
Load balancers experience short-lived failures. We first look
at the duration of device failures. Figure 8 (a) shows the CDF of time to repair for device types with the most failures. We observe that LB-1 and LB-3 load balancers experience the shortest failures with median time to repair of 3.7 and 4.5 minutes, respectively, indicating that most of their faults are short-lived.
ToRs experience correlated failures. When considering time to
repair for devices, we observe a correlated failure pattern for ToRs. Specifically, these devices tend to have several discrete “steps” in the CDF of their failure durations. These steps correspond to spikes in specific duration values. On analyzing the failure logs, we find that these spikes are due to groups of ToRs that connect to the same (or pair of) AggS going down at the same time (e.g., due to main-tenance or AggS failure).
Inter-data center links take the longest to repair. Figure 9 (a)
shows the distribution of time to repair for different link types. The majority of link failures are resolved within five minutes, with the exception of links between data centers which take longer to re-pair. This is because links between data centers require coordina-tion between technicians in multiple locacoordina-tions to identify and re-solve faults as well as additional time to repair cables that may be in remote locations.
4.5.2
Time between failures
We next consider the time between failure events. Since time between failure requires a network element to have observed more than a single failure event, this metric is most relevant to elements that are failure prone. Specifically, note that more than half of all elements have only a single failure(cf. Table 5), so the devices and links we consider here are in the minority.
Load balancer failures are bursty. Figure 8 (b) shows the
distri-bution of time between failures for devices. LBs tend to have the shortest time between failures, with a median of 8.6 minutes and 16.4 minutes for LB-1 and LB-2, respectively. Recall that failure events for these two LBs are dominated by a small number of de-vices that experience numerous failures(cf. Table 5). This small number of failure prone devices has a high impact on time between failure, especially since more than half of the LB-1 and LB-2 de-vices experience only a single failure.
In contrast to LB-1 and LB-2, devices like ToR-1 and AggS-1 have median time between failure of multiple hours and LB-3 has median time between failure of more than a day. We note that the LB-3 device is a newer version of the LB-1 and LB-2 devices and it exhibits higher reliability in terms of time between failures.
Link flapping is absent from the actionable network logs.
Fig-ure 9 (b) presents the distribution of time between failFig-ures for the different link types. On an average, link failures tend to be sepa-rated by a period of about one week. Recall that our methodology leverages actionable information, as determined by network oper-ators. This significantly reduces our observations of spurious link down events and observations of link flapping that do not impact network connectivity.
MGMT, CORE and ISC links are the most reliable in terms of time between failures, with most link failures on CORE and ISC links occurring more than an hour apart. Links between data cen-ters experience the shortest time between failures. However, note that links connecting data centers have a very low failure probabil-ity. Therefore, while most links do not fail, the few that do tend to fail within a short time period of prior failures. In reality, multiple inter-data center link failures in close succession are more likely to be investigatedas part of the same troubleshooting windowby the network operators.
4.5.3
Reliability of network elements
We conclude our analysis of failure properties by quantifying the aggregate downtime of network elements. We define annualized downtime as the sum of the duration of all failures observed by a network element over a year. For link failures, we consider failures that impacted network traffic, but highlight that a subset of these failures are due to planned maintenance. Additionally, redundancy in terms of network, application, and data in our system implies that this downtime cannot be interpreted as a measure of application-level availability. Figure 8 (c) summarizes the annual downtime for devices that experienced failures during our study.
Data center networks experience high availability. With the
ex-ception of ToR-1 devices, all devices have a median annual down-time of less than 30 minutes. Despite experiencing the highest num-ber of failures, LB-1 devices have the lowest annual downtime. This is due to many of their failures being short-lived. Overall, devices experience higher than four 9’s of reliability with the exception of ToRs, where long lived correlated failures cause ToRs to have higher downtime; recall, however, that only 3.9% of ToR-1s expe-rience any failures (cf. Figure 4).
Annual downtime for the different link types are shown in Fig-ure 9 (c). The median yearly downtime for all link types, with the exception of links connecting data centers is less than 10 minutes.
This duration is smaller than the annual downtime of 24-72 minutes reported by Turner et al. when considering an academic WAN [26].
Links between data centers are the exception because, as observed previously, failures on links connecting data centers take longer to resolve than failures for other link types. Overall, links have high availability with the majority of links (except those connecting data centers) having higher than four 9’s of reliability.
4.6
Grouping link failures
We now consider correlations between link failures. We also analyzed correlated failures for devices, but except for a few in-stances of ToRs failing together, grouped device failures are ex-tremely rare (not shown).
To group correlated failures, we need to define what it means for failures to be correlated. First, we require that link failures occur in the same data center to be considered related (since it can be the case that links in multiple data centers fail close together in time but are in fact unrelated). Second, we require failures to occur within a predefined time threshold of each other to be considered correlated. When combining failures into groups, it is important to pick an appropriate threshold for grouping failures. If the threshold is too
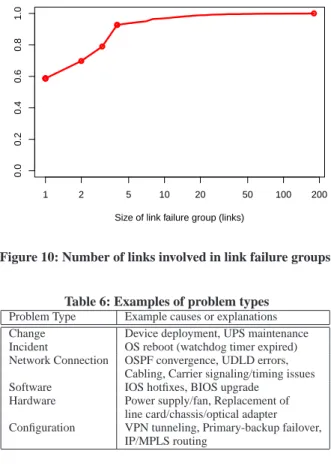
1 2 5 10 20 50 100 200 0.0 0.2 0.4 0.6 0.8 1.0
Size of link failure group (links)
P[X<x]
Figure 10: Number of links involved in link failure groups.
Table 6: Examples of problem types Problem Type Example causes or explanations Change Device deployment, UPS maintenance Incident OS reboot (watchdog timer expired) Network Connection OSPF convergence, UDLD errors,
Cabling, Carrier signaling/timing issues Software IOS hotfixes, BIOS upgrade
Hardware Power supply/fan, Replacement of line card/chassis/optical adapter Configuration VPN tunneling, Primary-backup failover,
IP/MPLS routing
small, correlated failures may be split into many smaller events. If the threshold is too large, many unrelated failures will be combined into one larger group.
We considered the number of failures for different threshold values. Beyond grouping simultaneous events, which reduces the number of link failures by a factor of two, we did not see significant changes by increasing the threshold.
Link failures tend to be isolated. The size of failure groups
pro-duced by our grouping method is shown in Figure 10. We see that
just over half of failure events are isolated with 41% of groups con-taining more than one failure. Large groups of correlated link fail-ures are rare with only 10% of failure groups containing more than four failures. We observed two failure groups with the maximum failure group size of 180 links. These were caused by scheduled maintenance tomultiple aggregation switches connected to a large number of ToRs.
4.7
Root causes of failures
Finally, we analyze the types of problems associated with de-vice and link failures. We initially tried to determine the root cause of failure events by mining diaries associated with NOC tickets. However, the diaries often considered multiple potential causes for failure before arriving at the final root cause, which made min-ing the text impractical. Because of this complication, we chose to leverage the “problem type” field of the NOC tickets which al-lows operators to place tickets into categories based on the cause of the problem. Table 6 gives examples of the types of problems that are put into each of the categories.
Hardware problems take longer to mitigate. Figure 11
consid-ers the top problem types in terms of number of failures and total downtime for devices. Software and hardware faults dominate in
3% 15% 5% 31% 33% 5% 4% 5% 6% 13% 72% 1% 0% 10% 20% 30% 40% 50% 60% 70% 80%
Change Incident Net.
Conn. SW HW Config P e rcen ta g e Problem type failures downtime
Figure 11: Device problem types.
4% 8% 26% 14% 20% 11% 15% 3% 33% 7% 38% 3% 0% 5% 10% 15% 20% 25% 30% 35% 40% 45% 50%
Change Incident Net. Conn. SW HW Config P e rcen ta g e Problem type failures downtime
Figure 12: Link problem types.
1e−03 1e−01 1e+01 1e+03 1e+05
0.0 0.2 0.4 0.6 0.8 1.0
Packets lost (millions)
P[X<x]
Figure 13: Estimated packet loss during failure events.
1e−03 1e−01 1e+01 1e+03 1e+05
0.0 0.2 0.4 0.6 0.8 1.0 Traffic loss (GB) P[X<x]
Figure 14: Estimated traffic loss during failure events.
terms of number of failures for devices. However, when consider-ing downtime, the balance shifts and hardware problems have the most downtime. This shift between the number of failures and the total downtime may be attributed to software errors being allevi-ated by tasks that take less time to complete, such as power cy-cling, patching or upgrading software. In contrast, hardware errors may require a device to be replaced resulting in longer repair times.
Load balancers affected by software problems. We examined
what types of errors dominated for the most failure prone device types (not shown). The LB-1 load balancer, which tends to have short, frequent failures and accounts for most failures (but relatively low downtime), mainly experiences software problems. Hardware problems dominate for the remaining device types. We observe that LB-3, despite also being a load balancer, sees much fewer software issues than LB-1 and LB-2 devices, suggesting higher stability in the newer model of the device.
Link failures are dominated by connection and hardware prob-lems. Figure 12 shows the total number of failures and total
down-time attributed to different causes for link failures. In contrast to device failures, link failures are dominated by network connection errors, followed by hardware and software issues. In terms of down-time, software errors incur much less downtime per failure than hardware and network connection problems. This suggests soft-ware problems lead to sporadic short-lived failures (e.g., a softsoft-ware bug causing a spurious link down notification) as opposed to severe network connectivity and hardware related problems.
5.
ESTIMATING FAILURE IMPACT
In this section, we estimate the impact of link failures. In the absence of application performance data, we aim to quantify the impact of failures in terms of lost network traffic. In particular, we estimate the amount of traffic that would have been routed on a failed link had it been available for the duration of the failure.
In general, it is difficult to precisely quantify how much data was actually lost during a failure because of two complications. First, flows may successfully be re-routed to use alternate routes af-ter a link failure and protocols (e.g., TCP) have in-built retransmis-sion mechanisms. Second, for long-lived failures, traffic variations (e.g., traffic bursts, diurnal workloads) mean that the link may not have carried the same amount of data even if it was active. There-fore, we propose a simple metric to approximate the magnitude of traffic lost due to failures, based on the available data sources.
To estimate the impact of link failures on network traffic (both in terms of bytes and packets), we first compute the median number of packets (or bytes) on the link in the hours preceding the failure event,medb, and the median packets (or bytes) during the failure
medd. We then compute the amount of data (in terms of packets or
bytes) that was potentially lost during the failure event as:
loss= (medb−medd)×duration
wheredurationdenotes how long the failure lasted. We use me-dian traffic instead of average to avoid outlier effects.
As described in Section 2, the network traffic in a typical data center may be classified into short-lived, latency-sensitive “mice” flows and long-lived, throughput-sensitive “elephant” flows. Packet loss is much more likely to adversely affect “mice” flows where the loss of an ACK may cause TCP to perform a timed out retrans-mission. In contrast, loss in traffic throughput is more critical for “elephant” flows.
Link failures incur loss of many packets, but relatively few bytes.
For link failures, few bytes are estimated to be lost relative to the number of packets. We observe that the estimated median number of packets lost during failures is 59K (Figure 13) but the estimated median number of bytes lost is only 25MB (Figure 14). Thus, the average size of lost packets is 423 bytes. Prior measurement study on data center network traffic observed that packet sizes tend to be bimodal with modes around 200B and 1,400B [5]. This sug-gests that packets lost during failures are mostly part of the lower mode, consisting of keep alive packets used by applications (e.g., MYSQL, HTTP) or ACKs [5].
5.1
Is redundancy effective in reducing impact?
In a well-designed network, we expect most failures to be masked by redundant groups of devices and links. We evaluate this expectation by considering median traffic during a link fail-ure (in packets or bytes) normalized by median traffic before the failure:medd/medb; for brevity, we refer to this quantity as
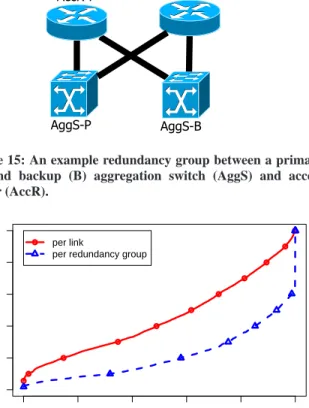
“nor-malized traffic”. The effectiveness of redundancy is estimated by computing this ratio on a per-link basis, as well as across all links in the redundancy group where the failure occurred. An example of a redundancy group is shown in Figure 15. If a failure has been masked completely, this ratio will be close to one across a redun-dancy group i.e., traffic during failure was equal to traffic before the failure.
Network redundancy helps, but it is not entirely effective.
Fig-ure 16 shows the distribution of normalized byte volumes for indi-vidual links and redundancy groups. Redundancy groups are effec-tive at moving the ratio of traffic carried during failures closer to one with 25% of events experiencing no impact on network traffic at the redundancy group level. Also, the median traffic carried at the redundancy group level is 93% as compared with 65% per link. This is an improvement of 43% in median traffic as a result of net-work redundancy. We make a similar observation when considering packet volumes (not shown) .
There are several reasons why redundancy may not be 100% effective in eliminating the impact of failures on network traffic. First, bugs in fail-over mechanisms can arise if there is uncertainty as to which link or component is the back up (e.g., traffic may be regularly traversing the back up link [7]). Second, if the redundant components are not configured correctly, they will not be able to re-route traffic away from the failed component. For example, we ob-served the same configuration error made on both the primary and back up of a network connection because of a typo in the configura-tion script.Further, protocol issues such as TCP backoff, timeouts, and spanning tree reconfigurations may result in loss of traffic.
5.2
Redundancy at different layers of the
net-work topology
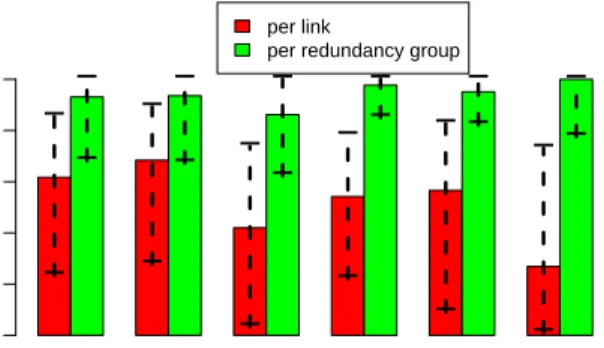
This section analyzes the effectiveness of network redundancy across different layers in the network topology. We logically di-vide links based on their location in the topology. Location is de-termined based on the types of devices connected by the link (e.g., a CoreCore link connects two core routers). Figure 17 plots quar-tiles of normalized traffic (in bytes) for links at different layers of the network topology.
Figure 15: An example redundancy group between a primary (P) and backup (B) aggregation switch (AggS) and access router (AccR). 0.0 0.2 0.4 0.6 0.8 1.0 0.0 0.2 0.4 0.6 0.8 1.0
Traffic during/traffic before
P[X<x]
per link
per redundancy group
Figure 16: Normalized traffic (bytes) during failure events per link as well as within redundancy groups.
Links highest in the topology benefit most from redundancy.
A reliable network core is critical to traffic flow in data centers. We observe that redundancy is effective at ensuring that failures between core devices have a minimal impact. In the core of the net-work, the median traffic carried during failure drops to 27% per link but remains at 100% when considered across a redundancy group. Links between aggregation switches and access routers (AggAccR) experience the next highest benefit from redundancy where the me-dian traffic carried per link during failure drops to 42% per link but remains at 86% across redundancy groups.
Links from ToRs to aggregation switches benefit the least from redundancy, but have low failure impact. Links near the edge of
the data center topology benefit the least from redundancy, where the median traffic carried during failure increases from 68% on links to 94% within redundancy groups for links connecting ToRs to AggS. However, we observe that on a per link basis, these links do not experience significant impact from failures so there is less room for redundancy to benefit them.
6.
DISCUSSION
In this section, we discuss implications of our study for the de-sign of data center networks and future directions on characterizing data center reliability.
Low-end switches exhibit high reliability. Low-cost,
commod-ity switches in our data centers experiencethe lowest failure rate with a failure probability of less than 5% annually for all types of
ToR switches and AggS-2.However, due to their much larger
All ToRAgg AggAccR AggLB AccRCore CoreCore Topology level Median nor maliz ed #b ytes 0.0 0.2 0.4 0.6 0.8 1.0
−
−
−
−
−
−
−
−
−
−
−
−
−
−
−
−
−
−
−
−
−
−
−
−
per linkper redundancy group
Figure 17: Normalized bytes (quartiles) during failure events per link and across redundancy group compared across differ-ent layers in the data cdiffer-enter topology.
dominate in terms of total downtime. Since ToR failures are consid-ered the norm rather than the exception (and are typically masked by redundancy in application, data, and network layers), ToRs have a low priority for repair relative to other outage types. This sug-gests that proposals to leverage commodity switches to build flat data center networks [3, 12, 21] will be able to provide good reli-ability. However, as populations of these devices rise, the absolute number of failures observed will inevitably increase.
Improve reliability of middleboxes. Our analysis of network
fail-ure events highlights the role that middle boxes such as load bal-ancers play in the overall reliability of the network. While there have been many studies on improving performance and scalability of large-scale networks [2, 3, 12–14, 21], only few studies focus on management of middle boxes in data center networks [15]. Mid-dle boxes such as load balancers are a critical part of data center networks that need to be taken into account when developing new routing frameworks. Further, the development of better manage-ment and debugging tools would help alleviate software and con-figuration faults frequently experienced by load balancers. Finally, software load balancers running on commodity servers can be ex-plored to provide cost-effective, reliable alternatives to expensive and proprietary hardware solutions.
Improve the effectiveness of network redundancy. We observe
that network redundancies in our system are 40% effective at mask-ing the impact of network failures. One cause of this is due to con-figuration issues that lead to redundancy being ineffective at mask-ing failure. For instance, we observed an instance where the same typo was made when configuring interfaces on both the primary and back up of a load balancer connection to an aggregation switch. As a result, the back up link was subject to the same flaw as the primary. This type of error occurs when operators configure large numbers of devices, and highlights the importance of automated configuration and validation tools (e.g., [8]).
Separate control plane from data plane. Our analysis of NOC
tickets reveals that in several cases, the loss of keep alive mes-sages resulted in disconnection of portchannels, which are virtual links that bundle multiple physical interfaces to increase aggre-gate link speed. For some of these cases, we manually correlated loss of control packets with application-level logs that showed sig-nificant traffic bursts in the hosted application on the egress path.
This interference between application and control traffic is undesir-able. Software Defined Networking (SDN) proposals such as Open-Flow [20] present a solution to this problem by maintaining state in
a logically centralized controller, thus eliminating keep alive mes-sages in the data plane. In the context of proposals that leverage location independent addressing (e.g., [12, 21]), this separation be-tween control plane (e.g., ARP and DHCP requests, directory ser-vice lookups [12]) and data plane becomes even more crucial to avoid impact to hosted applications.
7.
RELATED WORK
Previous studies of network failures have considered application-level [16, 22] or network connectivity [18, 19, 25, 26, 28] failures. There also have been several studies on understanding hardware reliability in the context of cloud computing [11, 23, 24, 27].
Application failures. Padmanabhan et al. consider failures from
the perspective of Web clients [22]. They observe that the majority of failures occur during the TCP handshake as a result of end-to-end connectivity issues. They also find that Web access failures are dominated by server-side issues. These findings highlight the im-portance of studying failures in data centers hosting Web services.
Netmedic aims to diagnose application failures in enterprise networks [16]. By taking into account state of components that fail together (as opposed to grouping all components that fail together), it is able to limit the number of incorrect correlations between fail-ures and components.
Network failures. There have been many studies of network
fail-ures in wide area and enterprise networks [18, 19, 25, 26, 28] but none considernetwork elementfailures in large-scale data centers.
Shaikh et al study properties of OSPF Link State Advertise-ment (LSA) traffic in a data center connected to a corporate network via leased lines [25]. Watson et al also study stability of OSPF by analyzing LSA messages in a regional ISP network [28]. Both stud-ies observe significant instability and flapping as a result of external routing protocols (e.g., BGP). Unlike these studies, we do not ob-serve link flapping owing to our data sources being geared towards actionable events.
Markopolou et al. use IS-IS listeners to characterize failures in an ISP backbone [19]. The authors classify failures as either router related or optical relatedby correlating time and impacted network
components. They find that 70% of their failures involve only a
single link. We similarly observe that the majority of failures in our data centers are isolated.
More recently, Turner et al. consider failures in an academic WAN using syslog messages generated by IS-IS [26]. Unlike prvious studies [19, 25, 28], the authors leverage existing syslog, e-mail notifications, and router configuration data to study network failures. Consistent with prior studies that focus on OSPF [25, 28], the authors observe link flapping. They also observe longer time to repair on wide area links, similar to our observations for wide area links connecting data centers.
Failures in cloud computing. The interest in cloud computing
has increased focus on understanding component failures, as even a small failure rate can manifest itself in a high number of fail-ures in large-scale systems. Previous work has looked at failfail-ures of DRAM [24], storage [11, 23] and server nodes [27], but there has not been a large-scale study on network component failures in data centers. Ford et al. consider the availability of distributed stor-age and observe that the majority of failures involving more than ten storage nodes are localized within a single rack [11]. We also observe spatial correlations but they occur higher in the network topology, where we see multiple ToRs associated with the same aggregation switch having correlated failures.
Complementary to our work, Benson et al. mine threads from customer service forums of an IaaS cloud provider [6]. They report
on problems users face when using IaaS and observe that problems related to managing virtual resources and debugging performance of computing instances that require involvement of cloud adminis-trators, increase over time.
8.
CONCLUSIONS
AND FUTURE WORK
In this paper, we have presented the first large-scale analysis of network failure events in data centers. We focused our analysis on characterizing failures of network links and devices, estimating their failure impact, and analyzing the effectiveness of network re-dundancy in masking failures. To undertake this analysis, we devel-oped a methodology that correlates network traffic logs with logs of actionable events, to filter a large volume of non-impacting failures due to spurious notifications and errors in logging software.
Our study is part of a larger project, NetWiser, on understand-ing reliability in data centers to aid research efforts on improv-ing network availability and designimprov-ing new network architectures. Based on our study, we find that commodity switches exhibit high reliability which supports current proposals to design flat networks using commodity components [3, 12, 17, 21]. We also highlight the importance of studies to better manage middle boxes such as load balancers, as they exhibit high failure rates. Finally, more investi-gation is needed to analyze and improve the effectiveness of redun-dancy at both network and application layers.
Future work. In this study, we consider occurrence of interface
level failures. This is only one aspect of reliability in data center networks. An important direction for future work is correlating logs from application-level monitors with the logs collected by network operators to determine what fraction of observed errors do not im-pact applications (false positives) and what fraction of application errors are not observed (e.g., because of a server or storage failure that we cannot observe). This would enable us to understand what fraction of application failures can be attributed to network fail-ures. Another extension to our study would be to understand what these low level failures mean in terms of convergence for network protocols such as OSPF, and to analyze the impact on end-to-end network connectivity by incorporating logging data from external sources e.g., BGP neighbors.
Acknowledgements
We thank our shepherd Arvind Krishnamurthy and the anonymous reviewers for their feedback. We are grateful to David St. Pierre for helping us understand the network logging systems and data sets.
9.
REFERENCES
[1] Cisco: Data center: Load balancing data center services, 2004. www.cisco.com/en/US/solutions/collateral/ ns340/ns517/ns224/ns668/net_implementation_ white_paper0900aecd8053495a.html.
[2] H. Abu-Libdeh, P. Costa, A. I. T. Rowstron, G. O’Shea, and A. Donnelly. Symbiotic routing in future data centers. In SIGCOMM, 2010.
[3] M. Al-Fares, A. Loukissas, and A. Vahdat. A scalable, commodity data center network architecture. In SIGCOMM, 2008.
[4] M. Alizadeh, A. Greenberg, D. Maltz, J. Padhye, P. Patel, B. Prabhakar, S. Sengupta, and M. Sridharan. Data Center TCP (DCTCP). In SIGCOMM, 2010.
[5] T. Benson, A. Akella, and D. Maltz. Network traffic characteristics of data centers in the wild. In IMC, 2010.
[6] T. Benson, S. Sahu, A. Akella, and A. Shaikh. A first look at problems in the cloud. In HotCloud, 2010.
[7] J. Brodkin. Amazon EC2 outage calls ’availability zones’ into question, 2011.http://www.networkworld.com/news/ 2011/042111-amazon-ec2-zones.html.
[8] X. Chen, Y. Mao, Z. M. Mao, and K. van de Merwe. Declarative configuration management for complex and dynamic networks. In
CoNEXT, 2010.
[9] Cisco. UniDirectional Link Detection (UDLD).
http://www.cisco.com/en/US/tech/tk866/tsd_ technology_support_sub-protocol_home.html. [10] Cisco. Spanning tree protocol root guard enhancement, 2011.
http://www.cisco.com/en/US/tech/tk389/tk621/ technologies_tech_note09186a00800ae96b.shtml. [11] D. Ford, F. Labelle, F. Popovici, M. Stokely, V.-A. Truong,
L. Barroso, C. Grimes, and S. Quinlan. Availability in globally distributed storage systems. In OSDI, 2010.
[12] A. Greenberg, J. Hamilton, N. Jain, S. Kandula, C. Kim, P. Lahiri, D. Maltz, P. Patel, and S. Sengupta. VL2: A scalable and flexible data center network. In SIGCOMM, 2009.
[13] C. Guo, H. Wu, K. Tan, L. Shiy, Y. Zhang, and S. Lu. DCell: A scalable and fault-tolerant network structure for data centers. In
SIGCOMM, 2008.
[14] C. Guo, H. Wu, K. Tan, L. Shiy, Y. Zhang, and S. Lu. BCube: A high performance, server-centric network architecture for modular data centers. In SIGCOMM, 2009.
[15] D. Joseph, A. Tavakoli, and I. Stoica. A policy-aware switching layer for data centers. In SIGCOMM, 2008.
[16] S. Kandula, R. Mahajan, P. Verkaik, S. Agarwal, J. Padhye, and P. Bahl. Detailed diagnosis in enterprise networks. In SIGCOMM, 2010.
[17] C. Kim, M. Caesar, and J. Rexford. Floodless in SEATTLE: a scalable ethernet architecture for large enterprises. In SIGCOMM, 2008.
[18] C. Labovitz and A. Ahuja. Experimental study of internet stability and wide-area backbone failures. In The Twenty-Ninth Annual
International Symposium on Fault-Tolerant Computing, 1999.
[19] A. Markopoulou, G. Iannaccone, S. Bhattacharyya, C.-N. Chuah, Y. Ganjali, and C. Diot. Characterization of failures in an operational IP backbone network. IEEE/ACM Transactions on Networking, 2008. [20] N. Mckeown, T. Anderson, H. Balakrishnan, G. Parulkar,
L. Peterson, J. Rexford, S. Shenker, and J. Turner. Openflow: enabling innovation in campus networks. In SIGCOMM CCR, 2008. [21] R. N. Mysore, A. Pamboris, N. Farrington, N. Huang, P. Miri,
S. Radhakrishnan, V. Subramanya, and A. Vahdat. PortLand: A scalable fault-tolerant layer 2 data center network fabric. In
SIGCOMM, 2009.
[22] V. Padmanabhan, S. Ramabhadran, S. Agarwal, and J. Padhye. A study of end-to-end web access failures. In CoNEXT, 2006. [23] B. Schroeder and G. Gibson. Disk failures in the real world: What
does an MTTF of 1,000,000 hours mean too you? In FAST, 2007. [24] B. Schroeder, E. Pinheiro, and W.-D. Weber. DRAM errors in the
wild: A large-scale field study. In SIGMETRICS, 2009.
[25] A. Shaikh, C. Isett, A. Greenberg, M. Roughan, and J. Gottlieb. A case study of OSPF behavior in a large enterprise network. In ACM
IMW, 2002.
[26] D. Turner, K. Levchenko, A. C. Snoeren, and S. Savage. California fault lines: Understanding the causes and impact of network failures. In SIGCOMM, 2010.
[27] K. V. Vishwanath and N. Nagappan. Characterizing cloud computing hardware reliability. In Symposium on Cloud Computing (SOCC), 2010.
[28] D. Watson, F. Jahanian, and C. Labovitz. Experiences with monitoring OSPF on a regional service provider network. In ICDCS, 2003.
![Figure 1: A conventional data center network architecture adapted from figure by Cisco [12]](https://thumb-us.123doks.com/thumbv2/123dok_us/11113028.2999373/2.918.480.837.90.589/figure-conventional-center-network-architecture-adapted-figure-cisco.webp)