DigitalCommons@University of Nebraska - Lincoln
Talks and Presentations: Department of Teaching,Learning and Teacher Education
Department of Teaching, Learning and Teacher Education
4-2019
Measuring and Modelling How and When
Effective Science Teaching Occurs
Elizabeth B. Lewis
University of Nebraska-Lincoln, [email protected]
Lyrica L. Lucas
University of Nebraska-Lincoln, [email protected]
Amy N. Tankersley
University of Nebraska-Lincoln, [email protected]
Elizabeth F. Hasseler
University of Nebraska - Lincoln, [email protected]
Brandon A. Helding
Boulder Learning, Inc., [email protected]
Follow this and additional works at:https://digitalcommons.unl.edu/teachlearntalks
Part of theJunior High, Intermediate, Middle School Education and Teaching Commons, and theScience and Mathematics Education Commons
This Article is brought to you for free and open access by the Department of Teaching, Learning and Teacher Education at
DigitalCommons@University of Nebraska - Lincoln. It has been accepted for inclusion in Talks and Presentations: Department of Teaching, Learning and Teacher Education by an authorized administrator of DigitalCommons@University of Nebraska - Lincoln.
Lewis, Elizabeth B.; Lucas, Lyrica L.; Tankersley, Amy N.; Hasseler, Elizabeth F.; and Helding, Brandon A., "Measuring and Modelling How and When Effective Science Teaching Occurs" (2019).Talks and Presentations: Department of Teaching, Learning and Teacher Education. 12.
1 Measuring and Modelling How and When Effective Science Teaching Occurs
Elizabeth Lewis, Lyrica Lucas, Amy Tankersley, Elizabeth Hasseler University of Nebraska-Lincoln
Brandon Helding Boulder Learning, Inc.
Abstract
With new national science education standards, we must understand how to prepare science teachers capable of advancing reform initiatives. In a 3-year longitudinal study we adopted a multi-method approach to investigate beginning science teachers’ instructional practices. We analyzed transcripts, administered a teaching self-efficacy survey, observed science lessons, and documented weeks of lessons. Using this large dataset, we posed research questions about the use of NGSS scientific practices in teachers’ science lessons (Paper #1) and teacher- and student-level characteristics as it relates to teachers’ use of inquiry in the classroom (Paper #2). In order to expand our coding capability of science teaching data for use in our structural equation modelling efforts (Paper #4) we also completed an initial validation of the DiISC instrument (Paper #3). Findings included: (a) differential use of scientific practices by physical and life science teachers in their lessons; (b) beginning teachers had lower levels of assessment use and there was little evidence to suggest that assessment varied greatly by
classroom diversity; (c) evidence for the validity of the DiISC with factor analyses, correlations with the EQUIP instrument, and think-aloud and semi-structured interviews with DiISC raters; and (d) an SEM showed master’s level teachers exhibited greater initial use of inquiry-based instruction and growth over time than undergraduate certified teachers with many contributing factors.
Corresponding author: Dr. Elizabeth Lewis
Associate Professor, Science Education University of Nebraska-Lincoln
2 Introduction
With new national science education standards, the Next Generation Science Standards
(NGSS), we must understand how to prepare science teachers capable of advancing science education reform. In this related paperset we adopted a multi-method approach to investigate beginning science teachers’ instructional practices in a 3-year longitudinal study. We analyzed transcripts, administered a teaching self-efficacy survey, observed science lessons, and documented a week’s worth of lessons including the observed lesson. Using this large dataset, we focused on research questions about the use of NGSS scientific practices in teachers’ science lessons (Paper #1) and classroom diversity as it relates to teachers’ use of assessment (Paper #2). In order to expand our coding capability of science teaching data for use in our structural equation modelling efforts (Paper #4) we also completed an initial validation of the DiISC instrument (Paper #3).
Findings from this study include: (a) differential use of scientific practices by physical and life science teachers in their lessons; (b) beginning teachers had lower levels of assessment use and there was little evidence to suggest that their assessment varied greatly by classroom diversity; (c) the DiISC can be validated with paired coding along with the EQUIP instrument; and (d) an SEM showed master’s level teachers exhibited greater initial use of inquiry-based instruction and growth over time than undergraduate certified teachers with many contributing factors.
Overall Conceptual Framework
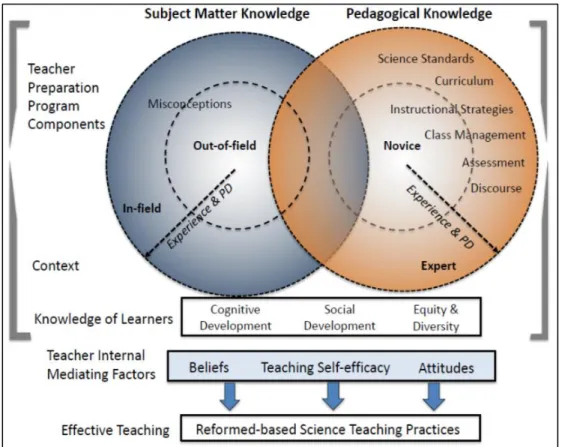
In recent work we developed a growth model of teachers’ learning and mediating factors that may support or impede teachers’ enactment of inquiry-based teaching (Figure 1, from Lewis, Rivero, Musson, Lucas, Tankersley, & Helding, 2019; Lewis, Rivero, Lucas, Tankersley, & Helding, 2018). Elements of the teacher preparation program are contained in the upper bracketed area of the figure
3 and the mediating factors are in the middle box with the arrows leading to reformed-based science teaching practices.
4
Figure 2. Single-subject and general science endorsements and their relative relationship to in-field and out-of-field teaching.
5 Paper #1: Secondary Science Teachers Use of NGSS Science Practice in Teachers’
Science Lessons Amy Tankersley
University of Nebraska-Lincoln Introduction
The Next Generation Science Standards (NGSS) combines content standards, crosscutting concepts, and science and engineering practices into a cohesive framework for learning science. Scientific practices (SP) are a key facet of NGSS and are designed to help transform K-12 science from didactic learning to mirror the work of scientists, with a focus not only on learning the content but also the nature and practice of science (NGSS Lead States, 2013). Effective use of NGSS will require teachers to be able to plan, enact, and reflect on their lessons and support students in three-dimensional learning through NGSS (Schneider & Plasman, 2011). Future science assessments need to integrate relevant science practices they need to be able to integrate student’s assessment of their knowledge of the core ideas together with science and engineering practices (NRC, 2010). To be able to support learning, teachers will need to be able to transform their teaching practices and develop effective assessments we will need to change the manner in which we prepare new teachers whose ideas may ideas about teaching and learning may not necessarily align with NGSS
(Crawford, 2014; Bybee, 2014).
To diagnose problems in and revise teacher education we will need to first understand what science practices are being used and how teachers are using those practices in the science
classroom. Despite the relative newness of the science practices, there has been some research into how teachers use science practices in the secondary classroom. Multiple factors are involved in the use of scientific practices, and teachers tend to focus on some of the practices more than others (Carpenter et al., 2015; Morales, 2016). In their early years of teaching second career science
6 teachers were influenced by their prior experiences when planning and implementing science
practices into their lesson plans (Antink-Meyer & Brown, 2017). There is also some evidence that some of the practices are linked and that often teachers use analyzing and interpreting data,
constructing explanations, and obtaining and evaluating information in conjunction with one another (Brownstein & Hovarth,2016). Despite a few prior studies, there is still little information on how students engage in practices in the classroom (Carpenter et al., 2015). Many of the studies that have been done using lesson plan analysis or small-scale studies with few teachers and there is a real need to analyze large scale lesson data to determine what practices are being used in the secondary science classroom and the factors that influence the use of those practices.
Literature Review The Evolution from Inquiry to Science Practices
In the early 1990s, science education underwent a revolution where teachers began to focus on the quality of students’ sense-making process (Taylor, 2014). Constructivist techniques see reality in the mind of the knower and people construct knowledge based on his or her perceptions (Jonassen, 1991). Constructivism has been a major emphasis in teacher education programs for more than 20 years (Ford, 2015). Despite this concentration on constructivism, new teachers are still more likely to use instructivist techniques in the classroom (Dalgarno and Colgan, 2007). The continued emphasis on instructivist techniques makes student learning in science a passive endeavor in which the teacher is the center of most lessons (Sizer, 1984). Many schools have resisted the change to inquiry-based science instruction and continue to use memorization without attention to coherent thinking or an appreciation for scientific explanations (Woodruff & Meyer, 1997). One of the reasons for this emphasis on instructivist practices is the continued belief that constructivist practices require students to use cognitive abilities they are not ready for yet (Kirschner et al.,
7 2006). Those who champion this argument contend that novice and intermediate learners need significant support in learning that cannot be gained through constructivist learning (Kirchner et al., 2006). Even if teachers are excited about constructivism and want to use student-centered
techniques, they are often nervous at the actual implementation of inquiry techniques and relinquishing control of the classroom required when facilitating more student-centered learning (Porcaro, 2011). Constructivist learning occurs most effectively in context and teachers should create environments where learning is relevant (Jonassen, 1991). Transitioning from instructor to facilitator requires different skills than many pre-service teachers have seen in their schooling (Porcaro, 2011). Early career teachers have less developed views on education and may have beliefs less resistant to change than experienced teachers (Luft et al., 2011). This makes preservice and new teachers a population that can be targeted for professional development in hopes of shifting their teaching practices to better fit a constructivist model.
Scientific literacy parallels general literacy in its requirement of abilities and background understandings to infer and interpret meaning from text, talk, and other modes of representation to build new interpretations (Cavagnetto,2010). For teachers to be able to increase students’ scientific literacy they will need proper teacher education and professional development. Teachers will need to be able to improve pre-service teachers’ ability to incorporating STEM concepts, prompting students to ask their own questions, developing and refining their questions and experimental design, and disseminating results to peers to the larger scientific community (French & Burrows, 2018). Many teachers report that their primary goal for their students is to gain science skills such as critical thinking and problem-solving strategies, but few report their skills goals specifically to science (Sandoval & Kawasaki, 2016).
8 The introduction of NGSS and science practices into curriculum promises to increase
science literacy beyond inquiry by integrating student learning of content knowledge with
engagement in the practices of science. In NGSS, each performance expectation combines content with relevant science and engineering practices and crosscutting concepts (NGSS Lead States, 2013). To implement NGSS effectively, students will need to learn science by actively engaging in the practices of science including conducting investigations, sharing ideas with peers, engaging in specialized ways of talking and writing, mechanical, mathematical, and computer-based modeling, and development of representations of phenomena (NRC, 2007). The transition to NGSS and science practices will require teachers to provide instruction, lessons, activities, and assessments that connect and focus on ideas of and about science and engineering practices which are essential to helping students develop a deep understanding of science across disciplines (Kloser, 2014). To provide that instruction teacher educators will need to revise teacher education to facilitate the transformation of science education and science teachers (Crawford, 2014). In order for that transformation to occur teacher educators will need to understand the current state of science education and the science practices used in the classroom.
Research on the Use of Science and Engineering Practices
As more states, schools, and districts move toward NGSS and three-dimensional science learning we are developing a growing body of literature on the science and engineering practices but there is still much we need to learn. We have some evidence that teachers may better
understand and implement some practices over others (Brownstein & Hovarth, 2016; French & Burrows, 2018). One study of science teachers in at a professional development designed to
support understanding and use of science and engineering practices found that teachers may already be comfortable with some practices like analyzing data and further professional development in
9 those areas may not be needed (French & Burrows, 2018). Further support for the high use of analyzing and interpreting data by teachers comes from a survey that reported that 59% of teachers reported using analyzing and interpreting data either very often or almost always but (Drew & Thomas, 2018).
Communication is a big part of the science practices and the ability of students to communicate their understanding of science. Effective classroom discourse via NGSS should be modeled on that of scientists which involves sharing multiple interpretations of phenomena,
collaboration, and collaborative discourse where students share their ideas and request clarifications from their classmates (Amin, Smith, & Wiser, 2014). NGSS also puts greater emphasis on
argumentation and modeling that allows students to go beyond inquiry by interpreting and evaluating data to develop arguments, explanations, and models (Crawford, 2014). Teachers surveyed about their use of science practices 44% of the 343 teachers surveyed reported that they had students construct explanations very often or frequently but most reported only using
argumentation from evidence in the classroom only occasionally or lesson frequently (Drew & Thomas, 2018). Scientific argumentation is a key practice, but it is not used much in the science classroom and there needs to be research, attention, and planning to successfully engage science students (Antink-Meyer & Brown, 2017; Brownstein & Hovarth, 2016). Even when attempted students often struggle with to produce justification for claims, generate complex explanations, and develop coherence linking ideas together focusing instead on the claims and assertions (Kelly, 2014). The lack of use of argumentation is troubling because of the central role it plays in students’ ability to use evidence to create arguments to science literacy (NGSS Lead States, 2013).
Modeling and using mathematical and computational reasoning are another set of science practices that are important to science literacy (NGSS lead states, 2013). Research on models and
10 modeling highlight the role of analogical restructuring and strategic recruiting of intuitive models in the process of conceptual change (Amin, Smith, & Wiser, 2014). For engineers, system modeling is essential to developing complex technologies and helps students understand the relationships
between micro and macro scales and provide opportunities for students to reason scientifically (Cunningham & Carlsen, 2014). Mathematical and computational thinking is another form of modeling that allows students to represent physical variables and their relationships and thus make quantitative predictions (NGSS Lead States, 2013). Science can provide concrete examples of abstract mathematical ideas and math can provide ways to quantify and explain science
relationships and thus deepened science knowledge (Czerniak & Johnson, 2014).
Along with research on the use of practices is literature on possible barriers to effective integration of science practices. Teachers often use science practices to reinforce concepts, engage with the content, learn the scientific method, or assess student understanding but rarely discuss using the practices as a holistic part of learning science (Sandoval & Kawasaki, 2016). This lack of an integrated view of science practices can limit their use in the classroom or the effectiveness when they are used. Pre-service teachers especially may not completely understand the practices and when surveyed often expressed confusion over practices like modeling and even when they could describe the practices the descriptions often did not entirely fit the full description of the practice as outlined in NGSS (Carpenter et. al, 2015). One study of 26 teachers in a professional development found that when discussing examples of practices integrated into their lessons most often described activities related to the scientific practices but not actually teaching core concepts through student engagement in scientific practices which highlights a need to create professional development that provides support to create lessons that use practices in a meaningful and integrated way (Sandoval & Kawasaki, 2016). Understanding what practices are being used and who is using those practices
11 may help us evaluate different groups of teachers and determine what barriers limit teacher ability to use science practices in the secondary science classroom.
Research Questions and Methods
Our research questions for this study were: What and how often are science and engineering practices used in the secondary science classroom? How do teacher and classroom factors
influence the use of science and engineering practices in the classroom?
Participants and Setting
This data is part of a larger set of data where we observed, interviewed, and collected data on secondary science teachers who were graduates of the same Midwestern University. For this study analyzed data from 55 of the teachers over a 2.5-year period collecting 514 weeks of self-reported classroom instructional practices in secondary science classrooms. All participants had a series of 2 methods courses. The first course was an overview of science teaching and the theory and practices related to inquiry and NGSS. The second course deepened the pre-service teachers of science education through developing an understanding of curriculum and assessment. All
participants also had more than 500 hours in the classroom during pre-service where they had the opportunity to implement the instruction from their methods courses supported by cooperating teachers and a university supervisor. All participants were in their 1-7 years of teaching and many came from two large districts around the University that were in the process of either piloting or implementing standards adapted from NGSS and thus were expected to use the science and engineering practices. Of the 55 participants, 21 (38%) graduated with a bachelor’s degree in secondary science education and 34 (62%) with a Master of Arts in education from the same university (Table 1). Most of our lessons were taught by teachers who taught in-field. In our Midwestern state, in-field teachers have to have a certification for teaching the subject. For our
12 purposes, we categorized in-field teachers as having at least 24 credit hours in the subject with a state single subject endorsement for high school classes and at least 12 credit hours in the subject (broad field endorsement) for teaching middle school.
Table 2. Summary of participating teachers by program membership
Program Number of Teachers (%) Number of Lessons (%)
Level (%) Lesson Subject Area
(%) In field/Out of field (%) Mean SEP Used in a week (SD) Undergrad uate 21 (38%) 179 (35%) Middle School = 67 (13%) High School = 112 (22%) Physical Sciences = 65 (13%) Life Sciences =78 (15%0 Earth and Space Science = 35 (7%) Other =1(.2%) In Field = 127 (25%) Out of Field= 52 (10%) 5.12 (3.73)
MAT 34 (62%) 335 (65%) Middle School = 77 (15%) High School = 258 (50%) Physical Sciences= 137 (27%) Life Sciences = 147 (28%) Earth Sciences = 48 (9%) Other =3 (.6%) In field= 255 (50%) Out of field = 79 (15%) 5.87 (4.22)
Total 55 514 Middle School = 144 (28%) High School = 370 (72%) Physical Sciences = 202 (39%) Life Sciences = 225 (44%)
Earth and Space Science = 83 (16%) Other = 4 (.8%) In field = 382(74%) Out of Field = 131 (25%) 5.64 (4.11) Data Collection
The researchers interviewed each participant 4-6 times per year for each year they
participated in the study. Teachers were interviewed asking them to summarize 4-5 lessons around a class that was observed by one of the researchers. To standardize the class time of the lessons gathered we collected 5 days of lessons from schools that were on a “regular” 40 to 50-minute schedule and 4 days of lessons from block schedules, which ranged from 85-120 minutes depending on the school schedule. During each interview, the teachers were asked to summarize 3-4 lessons previously to gather approximately a week’s worth of data. The researchers observed one of the
13 lessons in the summarized time period allowing us to better understand the instructional practices in the classroom and ask leading questions to get the full range of practices that were used by the teacher. After that interview, we coded each day summarized by the teacher with a 1 or 0 to indicate the use of the scientific practices as well as recording a brief qualitative description of the practices used during each class period. The data (n=514 weeks) was then averaged per week to obtain the average frequency of each practice and overall SEP practice use. Data were then sorted according to the program, subject, level (MS vs. HS), and in-field vs. out-of-field teaching. Data Analysis
For each science and engineering practice, we calculated the percentage of days in each week that the teacher described a lesson activity where a SEP was involved. We also calculated the number of weeks that at least one practice was used during the week and the number of practices used each week by the teachers. To account for differing lengths of class periods and standardized the data all other analysis was done and the unit of the week and not the individual lesson.
To determine possible teacher, school, and classroom factors that might influence the use of science practices. From the possible factors that might impact the science practices we selected program, subject matter of the lesson, level (middle school (MS) or high school (HS), in or out-of-field teaching as possible factors that might influence the use of science and engineering practices. We reviewed each teacher and school and first calculated descriptive statistics, finding the mean and standard deviation for each practice use by: school level (middle school and high school), in-field and out-of-in-field teaching, subject category (i.e., physical science, life science, Earth and space science), years of teaching experience (i.e., 0-3 years or 4-7 years), and by program (undergraduate or MAT teachers). We then calculated the mean and standard deviation for the total number of practices used in each group as well as the mean and standard deviation for the percentage of weeks
14 that at least one practice was used by the teacher. We followed up the descriptive statistics with a MANOVA type I sum of squares followed by a Tukey’s post hoc test when there were more than two categories of participants. Results were reported as significant for the MANOVA if the p-value was less than .05 and significant between-group effects if the p-value was less than .025.
Results
In this section, we briefly report our participants' overall use of science practices as well as factors that influence teachers use of science and engineering practices in the secondary science classroom. We start by reporting the most used and least used practices for all of our participants followed by the factors that significantly impacted the use of science practices. For each factor that was determined to be significant, we used between group effects to report which science practices varied significantly by each factor.
Overall our teachers used at least one science practice for 96% of the weeks surveyed with a standard deviation of 20%. This averaged to approximately 15% of the week’s lessons using one or more of the science practices. Analyzing and interpreting data was the most commonly used SEP with an average of 27%(SD=26%) of the lessons per week followed by mathematical and
computational thinking 25% (SD=34%) and Asking questions and defining problems at 21%(SD=33%). Engaging in argumentation from evidence at 2% (SD=8%) and constructing explanations and designing solutions 8% (SD=19%) were the least used by our participants and were recounted in only a few of the lessons surveyed.
Next, when looking at the factors that influenced the use of science practices, we started with program level. Participants that were graduates of the MAT program used significantly more science practices per week than teachers who graduated from the program with a bachelor’s degree, F (8.503) = 2.763, p=.005; Wilk’s Ʌ = .958, ɳ2 = .042. Table 2 shows that teachers who had a
15 Master’s degree had their students engage in planning and carrying out investigations (F(1,510) = 5.615, p=.018, ɳ2 = .011), analyzing and interpreting data (F(1,510) = 11.766, p=.001, ɳ2 = .023),
and using mathematics and computational thinking (F(1,510) = 7.845, p = .005, ɳ2 - .015) more
frequently than participants who had a bachelor’s degree. The only science and engineering practice that was used more often by teachers who graduated from the undergraduate program was engaging in argumentation from evidence, which was used 2.6% of a week’s worth of lessons on average by the participants from the undergraduate program and only 2.1% of the week on average by participants from the master’s program, but the difference was not significant.
Table 2. Use of Science and Engineering Practices by Program Science and Engineering
Practice
Undergraduates n=179 (SD)
MAT n=355 (SD) Total n=514 (SD)
Asking Questions and Defining Problems
21% (33%) 22% (34%) 21% (33%) Developing and Using
Models
13% (20%) 14% (24%) 13% (22%) Planning and Carrying out
Investigations
8% (17%) 12% (23%) * 11% (21%) Analyzing and Interpreting
Data
22% (24%) 30% (28%) * 28% (26%)
Using Mathematics and Computational Thinking
19% (29%) 28% (36%) * 25% (34%) Constructing Explanations
and Designing solutions
7% (17%) 9% (21%) 8% (19%) Engaging in Argumentation
from Evidence
3% (10%) 2% (8%) 2% (8%) Obtaining, Evaluating, and
Communicating Information
14% (26%) 16% (25%) 15% (26%)
* indicates a p<0.05
There was also a significant difference in the average percentage of practices used per week by the subject matter of the lessons (40, 2186) = 7.079, p< .001; Wilk’s Ʌ = .588, ɳ2 = .101). The
16 and using models (F(5,508)= 4.422, p =.001, ɳ2 = .042), planning and carrying out investigations
(F(5,508) = 5.982, p <.001, ɳ2 = 056), analyzing and interpreting data (F(5,508) = 4.942, p <.001, ɳ2
= .046), using mathematics and computational models (F(5,508) = 36.591, p <.001, ɳ2 = .265), and constructing explanations and designing solutions (F(5,508) = 9.480, p<.001, ɳ2 = .08) (Figure 1).
Physics teachers used science and engineering practices significantly more often than chemistry, physical science, biology, and Earth and space science teachers. When looking at the use of developing and using models, planning and carrying out investigations, and constructing
explanations and designing solutions physics teachers on average used those practices significantly more in a week than any other subject (P<.05). Chemistry teachers used modeling significantly less than either physics or Earth science teachers (p<.05). Chemistry teachers also used to analyze and interpreting data less often in their lessons than both physics and physical science teachers in our study (p<.05). Biology and earth science teachers did not use any practice significantly more than other subjects. In fact, biology and earth science teachers lagged behind physics teachers in many of the practices and did not use any practice significantly more than any other subject.
Figure 1. Use of science and engineering practices by lesson subject.
0% 10% 20% 30% 40% 50% 60% 70%
Modeling Invesigations Analyzing Data Math Models Explanations Physics Chemistry Physical Science Biology ESS
* * * * * * *
17 * indicates a P< .05
Science teacher training consists of not only pedagogical training but training in the discipline they are planning to teach as well. Teachers need to have strong subject matter knowledge to understand and implement curricular content and goals in a way that addresses student needs (Darling-Hammond, 2016). Teachers who taught out of subject area found difficulty selecting resources and using those resources to help students gain knowledge and make links between concepts in the discipline (Childs & McNicholl, 2007). In this case we defined out of field teaching for middle schools as teachers who either do not have a single subject certification, which requires at least 24 college credit hours in the subject, in the lesson subject area or a do not have a broad field certification which requires at least 12 hours in lesson subject matter and the passing of a general science subject area tests. For high school lessons, we defined out of field teachers as not having at least 24 credit hours in the subject area of the lessons. For our participants there was no significant difference overall in the use of science and engineering practices for teachers that taught in-field and out-of-field (8,505) = 1.329, p=.226, Wilks’ 𝛬= .979ŋ2=.612). Because of the trends, we saw by the subject matter of the lessons we decided to disaggregate in and out-of-field teaching by the subject matter of the lesson. Through analysis of the influence of out of field teaching by lesson subject matter we found that that teachers who taught chemistry lessons out of field used significantly less science and engineering practices in their lessons than teachers who had at least 24 college credit hours of chemistry and thus were teaching in-field (F(8.47)=2.359,p=.032, Wilks 𝛬= .713,𝜂2= .832)). Specifically, chemistry teachers who taught in-field used planning and carrying out investigations (p=.001) and analyzing and interpreting data (p=.003) more often than teachers who did not have a single subject certification to teach chemistry (Figure 2).
18
Figure 2. Use of Science Practices by In and Out-of-field Chemistry Teachers
In our study, 52% of the chemistry lessons were taught by teachers who were not certified to teach the subject and thus out of field teachers in chemistry impacts students access to the science and engineering practices during their chemistry courses. We were not able to properly examine the influence of out of field teaching on physics because we only had 38 total lessons of physics in our analysis and of those only 9 or 24% of the lesson were taught by teachers not certified in the subject. We were also not able to analyze the influence of out of field teaching on the use of science and engineering practices in life science lessons because only 2 out of the total 212 life science lesson or .9% were taught by teachers not certified in the subject.
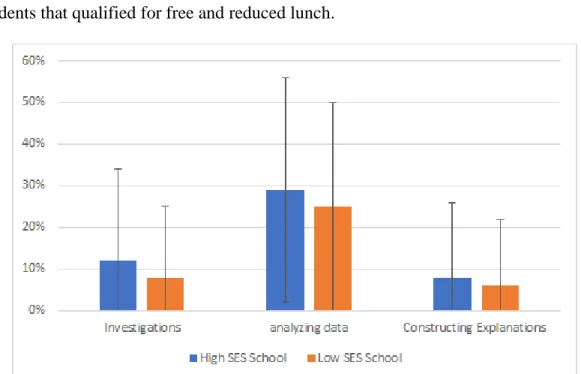
Concentrated poverty affects students learning because schools with a high number of low SES students tend to have less experienced teachers and fewer learning resources, more limited curricula taught at less challenging levels and other factors that can significantly affect academic achievement (Darling-Hammond, 2013). Because of this we were curious about the impact on SES on the use of science practice in the secondary science classroom. For this analysis, we defined schools that were high needs schools as middle schools that had more than 50% of the students
19 qualifying for free and reduced lunch and high schools that have more than 40% of their student’s body qualifying for free and reduced lunch. Table 3 shows the number of lessons taught in high or low socioeconomic schools and the average use per week of the science practices. According to our analysis, teaching in a high needs did impact the use of science and engineering practices in the classroom F(16,1008) = 3.501, p<.001, Wilks’ 𝛬= .897,𝜂2= .053. Teacher who taught in higher socioeconomic schools had students engage in planning and carrying out investigations
(F(2,511)=8.249, P<.001, 𝜂2 = .031, analyzing and interpreting data (F(2.511) = 3.751, p=.024,
𝜂2= .014, and constructing explanations and designing solutions (F(2.511) = 14.135, p<.001, 𝜂2 = .002 on average more times per week than teachers who taught in schools with a higher proportion of students that qualified for free and reduced lunch.
Figure 3. Use of science and engineering practices in lessons conducted in high needs schools * indicates p<.05
Discussion
Our study builds on and extends prior research into the use of scientific practices in the classroom. Teachers have been shown to some practice more than others (Brownstein & Hovarth, 2016; French & Burrows, 2018) and in our analysis, we found that overall teachers were
20 more likely to integrate analyzing and interpreting data, using mathematical and computational thinking, and asking questions and defining problems into their instructional practices. Practice that involved discourse was especially hard for our teachers and engaging in argumentation from
evidence and constructing explanations and designing solutions were rarely used by our teachers. This has implications for the continued resistance of teachers to high-yield discourse strategies and the lack of higher order discourse in the science classroom.
Beyond the overall conclusions about science and engineering practices were found some teacher and school factors that influenced the use of science practices in the science classroom. Our teachers who had a master’s degree averaged a higher percentage of practices per week than
teachers from our undergraduate program. Prior research has indicated that career changers in science education bring some of the ideas and orientations from their original field of science study (Antink-Meyer & Brown, 2017). On average the teachers from the MAT program typically have a high number of science courses in their content area, take more 300 and 400 level courses than our undergraduates, and often have experience in science fields which may carry over to their
instructional practices and ability to implement the science practices.
The subject matter of a lesson also impacted teachers’ use of science practices with physics teachers using practices like modeling, investigation, analyzing and interpreting data, mathematical and computational thinking, and explanations more than biology, chemistry, and earth science teachers. Chemistry teachers low use of science practices may have been influenced by the high number of our participants teaching chemistry out-of-field. Chemistry teachers with at least 24 credit hours of chemistry coursework integrating more investigations and analyzing data than teacher without a single subject endorsement in chemistry. This supports prior work on the importance of subject matter knowledge to reform-based teaching practice and assertion that
21 chemistry subject matter knowledge influences their use of inquiry in the classroom (Lewis et al., 2018). Finally, our work points to the need for more research into the continued inequities of low SES schools and the need to find supports for teachers who are implementing NGSS and the science practices in high needs environments.
Limitations and Future Directions
This data is self-report by teachers and why we strengthened the data with observations of teacher lesson plans we relied on teachers to summarize their lessons effectively. We also used a sample of convenience and thus did not have sufficient coverage in all categories to complete a full analysis of many of the factors that might influence the use of science practices. We also confined our participants to the alumni of one midwestern university and therefore cannot generalize our findings to teachers from other programs or contexts.
In the future we would like to perform a hierarchical linear model on our data to predict use of science practice by the secondary science teachers in our study. We would also plan to use qualitative analysis to analyze researcher observations and teacher interviews to better understand not only what practices are being used and by whom, but also how those practices are used in the secondary science classroom. the ultimate hope for this work is to find gaps in teachers
understanding and use of the practice and develop professional develop that will help teachers all of the science practices consistently and effectively.
22 Paper #2: Factors Impacting Teachers’ Use of Inquiry in the Science Classroom
Elizabeth F. Hasseler
University of Nebraska-Lincoln, Department of Teaching, Learning, & Teacher Education Abstract
This study investigates student- and teacher-level factors that impact the use of inquiry in the classroom by teachers who were prepared through one of two programs at the same university. Student-level factors that were used were their gender and racial demographics and grade level (MS/HS). Teacher-level factors included years of experience and membership in either a BA or MA leading to certification teacher preparation program. We used over 650 lesson observations that were generated between 2015 and 2018 and were coded using the EQUIP rubric. Multiple regression was used to investigate the EQUIP scores. We found that the diversity of the students was not correlated with use of inquiry in the classroom, but that membership in the teacher preparation program was a significant factor.
Introduction
Through my observations of local middle and high schools, I have seen science classrooms of varying student demographics, with respect to gender and race. I have also noticed that upper-level science classes tend to be of similar demographics, where most students are White, regardless of the demographics of the school. This observation suggests many questions regarding the
program enrollment mechanisms at the schools; as well as, whether the teaching practices in the more diverse classrooms are different than those of a less diverse classroom. If the teaching practices can be predicted based on the demographics of the classroom, then maybe that could also impact students’ success and whether they move onto more advanced science courses.
23 In this study, I will be delving into the following question: Is the use of inquiry by teachers predicted by the demographics of the classroom? In the future, I would like to take this question further and ask whether the use of inquiry is predicted by type and level of the science course. I chose to research inquiry in the classroom because of the numerous benefits to all students.
Conceptual Framework
The conceptual framework presented in the introduction to the paperset was developed by our research team in an earlier study (Lewis, et al, 2018). For this paper’s study, we focused on teachers’ pedagogical knowledge from their teacher preparation program and years of teaching experience. We are also focused on student factors of gender and racial diversity, as well as, their grade level, which was broken down into middle school or high school. From the framework, all of these factors have a relationship with and contribute to reform-based science teaching practices.
Literature Review Inquiry
Sociocultural learning theory has its roots in Vygotskyan tradition (Lemke, 2001). Part of Vygotsky’s theory analyzed the interplay between language and learning. He “conceptualized development as the transformation of socially shared activities into internalized processes” (John-Steiner & Mahn, 2012). Sociocultural theory looks at the questions of how personal identity and cultural values impact the science classroom.
The goal of integrating inquiry into the classroom is to help students to develop scientific reasoning (Chinn & Malhotra, 2002). Open inquiry in the classroom has many facets. It includes students designing procedures, making hypotheses, discussing results, and “linking of experience to activities, science concepts, and science principles” (Roth & Bowen, 1995). Inquiry-based
24 instruction has its roots in Dewey, who believed that education should be based on experiences in the classroom (Dewey, 1938).
The EQUIP rubric was developed to be able to assess the use of inquiry. It was developed as a tool for researchers and teachers to push inquiry beyond using student-centered activities to support “students critically and systematically engage in examining, interpreting and analyzing questions regarding the world around them and then communicate their findings, providing convincing arguments for their conclusions.” It is broken down into four sections: discourse, instruction, assessment, and curriculum (Marshall, Smart, & Horton, 2010).
One instructional model that facilitates the development and use of inquiry in the classroom is the 5E model. 5E stands for engagement, exploration, explanation, elaboration, and evaluation. Through the engagement process, teachers begin the lesson or unit with an activity that hooks the students’ interest and connects with their prior knowledge. Through exploration, students learn and discover new concepts and ideas through activities such as labs or simulations. Afterwards, is the explanation process where students show what they have discovered and learned through the prior processes. Elaboration is where the extension of students’ learning is occurring through activities such as classroom discourse. Finally, the learning is evaluated. (Bybee et al., 2006).
Inquiry is used in the classroom in three different ways, “scientific inquiry” with respect to how scientists do science, “inquiry learning,” referring to the students engaged roles in inquiry-based instruction, and “inquiry teaching” which refers to the pedagogical choices by the instructor. Through Crawford’s chapter that focuses on inquiry in the classroom, she notes that inquiry goes beyond hands-on activities in the classroom. It involves doing science as a scientific practitioner. Inquiry involves students being able to also asking questions, designing experiments, developing
25 models argumentation from evidence, such as what is recommended through the Next Generation Science Standards(Crawford, 2014).
Diversity
A qualitative study by Jean Anyon (1980) investigated how schoolwork compared amongst students of different social classes and to see if there was a more hidden curriculum underlying the schoolwork. To collect data, she performed observations, interviews with fifth grade students, teachers, principals, district administrators, and analyses of curriculum and materials. Throughout her research, she broke down the schools that were part of the study into categories based on the socioeconomic status of the families that typically attend each school: “working-class,” “middle-class,” “affluent professional,” and “executive elite.” In these schools, she found there was a hidden curriculum that was preparing the students to the type of work typical of the class they were raised in (Anyon, 1980). This shows that though many people talk about the social mobility of the American Dream, schools have been aiding students in staying in the class they were raised in, instead of aiding in upward mobility.
Oakes and Guiton (1995) conducted a qualitative research study to investigate how tracking decisions are made in high schools. They looked at case studies of four high schools with similar state aide and standards, yet different compositions of students. Researchers looked at handbooks, course offerings, and enrollment procedures in addition to interviews and observations at each school. They interviewed students, faculty, and administrators. They found that though faculty and staff viewed that their tracking systems were fair and equitable for all students, they appeared to be favoring White and Asian middle-class students. Students who had equal grades seemed to be tracked differently based on the SES and racial background. They discovered that the issue was much more complex. Students who were Latino were taking lower level courses because they were
26 not being provided with the academic supports that they needed, and many African American students and students with a low socioeconomic status were taking vocational courses because it appeared to lead to more job stability. Parents of white middle-class students would take advantage of a waiver that would allow them to sign their children up for more advanced courses even if they had not gotten the grades required for those courses. Students also have the option to take classes based on their interest, and many students opted out of high level courses even though they were eligible for them (Oakes & Guiton, 1995). This research shows how nuanced and complex the issues around curriculum and tracking are in the schools.
In science classrooms, it is important to support the inquiry for all students, including our female students. In some many science classrooms when students are split into groups, the male students are doing the science, while female students are filling in the data tables. In other cases, female students are charged with traditionally caretaking roles in the classroom by aiding students catch up who were absent.(Scantlebury, 2014). This pulls students away from the main classroom instruction and opportunity to engage and explore scientific practices.
Methodology Research Question
In our investigation of beginning and intermediate science teachers we posed the following overarching research question: What is the contribution from teaching experience, the teacher preparation program, the classroom level, the gender of the students, and the diversity of the students to the level of inquiry enacted in the classroom? Specifically, does the teacher preparation program with higher levels of SMK make a difference to the level of inquiry-based science lessons? Do middle and high school teachers implement inquiry-based lessons at the same level? And
27 finally, does the diversity of students affect the level of inquiry-based science lessons that teachers provide?
Context
There were 61 participants in this study, all graduates of a large, 4-year university in the Midwest’s teacher education program. Of the 656 lessons, 209 were taught by graduates with a BA in secondary science education who met the minimum state requirements for either a single-subject or a general science teaching endorsement and 447 lessons were taught by graduates with a MA in education who all had at least an undergraduate degree in an area of science and were all certified in at least one single-subject (i.e., biology, chemistry). In the sample, 481 lessons were taught in middle schools and 175 lessons were taught in high schools. Teachers’ experience ranged from their first-year teaching through their sixth year of teaching, with an average experience of 2.8 years in the classroom and standard deviation of 1.45.
The data for this study was gathered over the course of multiple academic years, 2015-16 through 2017-18. During the classroom observations, field notes were taken by a member of the research team, which were later coded using the EQUIP rubric. The observations were conducted by the PI and five graduate students. To ensure reliability specific points throughout the year, the researchers conducted a calibration. During this process, they observed videos of science lessons, discussed their coding, observed teachers in all possible pairs for multiple lessons. In these
conversations the observers compared and discussed their results from the EQUIP rubric to come to consensus prior to making observations alone.
Research Approach
A quantitative approach to investing the teachers’ use of inquiry-based instruction. A multiple regression was conducted on each of the EQUIP rubric items using the following factors:
28 (a) program (BA/MA), (b) classroom level (MS/HS), (c) teacher’s years of experience, (d) gender of the students, and (e) diversity index of the classroom. Multiple regressions were also run on the aggregated assessment, instruction, curriculum, and discourse scales, in addition to an aggregated total of the entire EQUIP using the same factors listed above.
In the field notes for each observed science lesson, observers also counted the number of students, did their best to determine sex and race. Without further IRB approvals we were not able to determine SES for individual students and were only able to use publically-available school-level data, specifically free and reduced lunch participation as a proxy for SES. We entered these data as metadata for each science lesson in our spreadsheets for analysis.
Results Descriptive Statistics of the Data
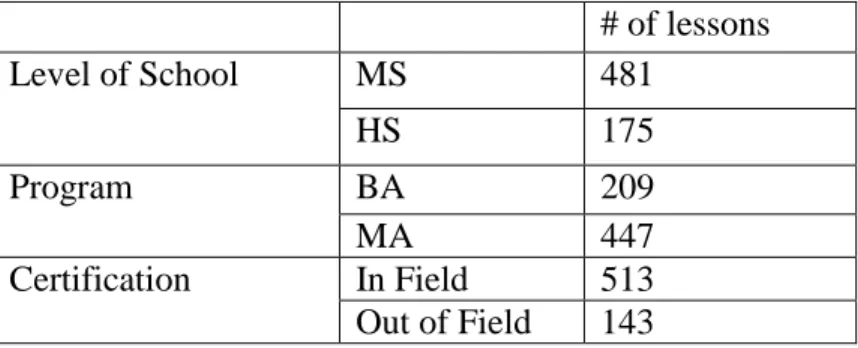
The table below gives the break down for the number of lessons for each teacher-level characteristic out of the 656 total lessons.
Table 1. Number of lessons for each of the teacher-level characteristics for this analysis
# of lessons Level of School MS 481 HS 175 Program BA 209 MA 447 Certification In Field 513 Out of Field 143
The table below shows the number of teachers observed each year in the study. There were 23% of teachers participated for one year, 36% of teachers participated for two years, and 41% of teachers participated for all three years.
29 Table 2. Teachers observed by year of study
2015-16 2016-17 2017-18
40 teachers from both programs were recruited (2:1 MAst to undergrad program)
234 classroom observations
38 teachers from both programs were recruited (2:1 MAst to undergrad program)
268 classroom observations
42 teachers from both programs were recruited (2:1 MAst to undergrad program)
241 classroom observations
Calculation of the Diversity Index
To calculate and compare the levels of classroom diversity we used a generalized variance approach or the Absolute Diversity Index. In this method, diversity was calculated using the following equation: 𝐺𝑉 = 1 −∑𝐶𝑖=1𝑃𝑖2, where 𝑃𝑖 values are the percentages of different
demographic groups in the classrooms (Budescu & Budescu, 2012; Summers, Jackson, Woodward, Jones, & Dryer, 2011; Tam & Bassett, 2004). This system for measuring diversity has been
commonly used in a range of fields including psychology and medicine. Regression Analyses
A multiple regression was completed on the raw total scores of the EQUIP, the results showed that the predictors accounted for 10.5% of the variance (R2 = 0.105, F(5,649) = 15.18, p < 0.001). The predictors teaching experience ( = 0.230, p < 0.01), teaching level ( = -0.210, p < 0.001), teacher preparation program ( = 0.203, p < 0.001), and student sex ( = -0.122, p < 0.01) all significantly contributed to the model. The diversity index of the students ( = -0.041, p > 0.1) did not contribute to the model.
A regression analysis was also completed on each of the regression analyses were found to be significant at a p-value of 0.000. On the assessment factors scale items A1, A3, and A5 were unable to be analyzed with multiple regression analyses due to the limited variability of the data.
30 This was also the case for one item on the instructional factors scale I5, and one item on the
discourse factors scale D1. Specifically, these EQUIP rubric items referred to: prior knowledge (A1), student reflection (A3), the role of assessing (A5), knowledge acquisition (I5), and the questioning level employed (D1).
The diversity index of the classroom was only found to be significant with C4 in the EQUIP, which refers to the flexibility of how students record and organize information. In all other analyses of the EQUIP items, the diversity index of the classroom was found to be non-significant. This means that in most cases, the diversity index of the classroom had no impact on the level of inquiry the teachers in the study used in their classrooms.
The teacher preparation program was found to be significant in all items and aggregate totals, except for C4 (the flexibility of how students record and organize information). This means that teachers prepared through a MA degree enacted higher levels of inquiry in their classroom than teachers with a BA in secondary science education who only had minimal (i.e., a minor’s worth) science content knowledge with respect to the remaining testable items in the EQUIP.
We found that the level of the classroom, middle school vs. high school to be significant with respect to most items on the EQUIP. It was only found to be non-significant for A2 and C4, which were items that concerned “conceptual development” and “organizing and recording information.” In other words, inquiry was found more often in middle school classrooms than implemented by teachers teaching high school students in twelve items for the EQUIP.
The results for teaching experience was found to be significant on seven out of the fourteen testable EQUIP items. Out of the four possible discourse items, teaching experience was significant in all of them. When teaching experience was found to be significant, teachers with more
31 experience tended to enact more robust inquiry-based instruction in the classroom, especially with respect to incorporating more inquiry-based discourse.
We also investigated the potential effect of students’ sex on the teachers’ classroom instruction. Out of the fourteen testable EQUIP items, the sex of the students was significant for eight items. For these items, we found that classrooms with fewer female students had more inquiry-based strategies.
Discussion
From the results of the analysis, the diversity of the students’ race did not correlate to the use of inquiry-based instruction in the classroom. This may be related to the fact that the
participants in this study were strategically placed in high needs locations throughout their field placements and student teaching experiences.
The results showed that teaching experience overall was found to be significant in the EQUIP total raw score, as well as for many of the individual EQUIP items, especially with respect to the discourse scales. This will require more investigation to see how teachers develop and evolve their use of inquiry with respect to discourse over time in the classroom.
The analysis showed that middle schoolers experienced more inquiry-based lessons than high schoolers. This will also require further investigation to make sure that these results are not be confounded with teaching in-field and out of field. The analysis will be run in the future with the middle school lessons broken down into the disciplines of physics, biology, chemistry, and earth science.
Sex was found to be a significant factor in the overall EQUIP raw score regression, as well as, for most of the EQUIP items. This result requires further analysis to see if this is due to student
32 sex, or if it was related more to the subject matter. If a subject such as physics was using more inquiry than biology, it would confound the results.
Program was found to be a significant factor for almost all of the EQUIP items. These results hold true with prior analysis (Lucas & Lewis, 2017). Participants with a master’s in education also have a bachelors in their subject matter, such as physics, biology, or chemistry. Their subject matter knowledge gives them more flexibility in their ability to incorporate more reform-based teaching practices. The students who graduated with a bachelor’s in science teaching have an equivalent of a minor in their chosen subject matter. As they do have the same depth of knowledge, they tend to incorporate less inquiry practices into the classroom.
Conclusions
As with previous studies, this analysis showed the importance of teachers have a strong understanding of their content knowledge in order to be able to incorporate more inquiry-based instruction into their classroom.
For future research, we will be running analysis without the lessons that are out of field for the teachers based on their certification area to reduce confounds. We also will be running the analysis with the middle school lessons disaggregated into disciplines. By including the disciplines into the analysis, we aim to get a fuller picture about how student sex correlates with inquiry-based practices. We also aim to expand the analysis to see how diversity in the classroom relates to the implementation of science and engineering practices.
Some limitations of the research are that as this was a sample of convenience, the teachers were graduates of the same university and approximately 90% of them teach in the same state. This could impact the generalizability. The undergraduates of the teacher preparation program have not had any training of working with English language learners, which could add a confound. The
33 observations were targeted towards lessons that were taught in field, there was a lack of access to student level data per IRB so all student-level characteristics were estimated.
Acknowledgements
The data from this analysis was a part of an NSF funded grant. I would like to thank Beth Lewis, Amy Tankersley, Lyrica Lucas, and Ana Rivero who also aided the collection and analysis of the data.
34 Paper #3: Validation of the Discourse in Inquiry Science Classrooms (DiISC) Instrument
Lyrica Lucas, Brandon Helding, & Elizabeth Lewis Abstract
Measuring inquiry-based science instruction is a relevant project to the science education reform movement as the new science education standards outline the practices that promote learning through an inquiry approach. In this paper, we propose that the Discourse in Inquiry Science
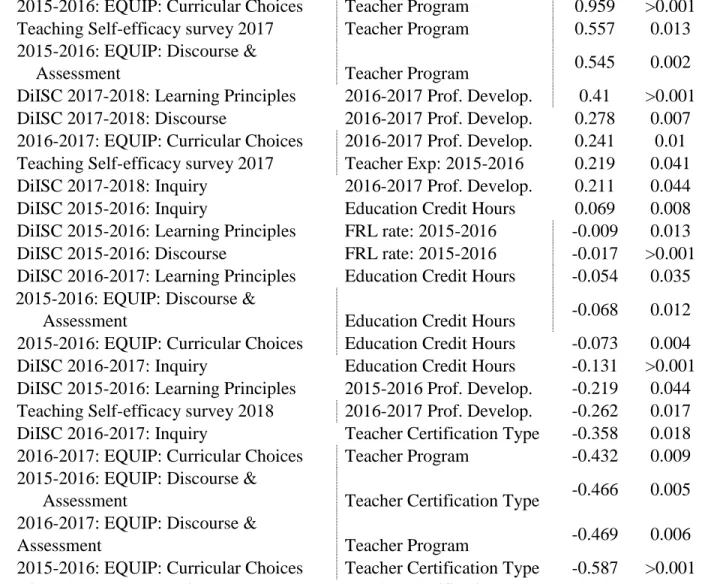
Classrooms (DiISC) instrument can contribute to research in inquiry-based science instruction by addressing latent constructs on inquiry, oral discourse, writing, academic language development, and use of learning principles. Since the DiISC was developed within a specific professional development program, we present new evidence associated with aspects of a validity argument for the instrument. We used 660 coded science lessons to analyze the factor structure of the DiISC and to investigate its correlation with the Electronic Quality of Inquiry Protocol (EQUIP). A semi-structured interview of four raters of a video recorded lesson was used to collect and analyze data pertaining to substantive validity evidence.
Introduction
Observation and assessment instruments must be associated with strong validity and reliability arguments in order for researchers who use those measures to produce consistent,
replicable, and generalizable results (AERA, APA, & NCME, 2014). This is particularly important as reform-based initiatives in science education emphasize the need for high quality, inquiry-based instruction and the research that undergirds it. As a consequence of using measures without
adequate validity or reliability measures, researchers’ efforts in studying classroom instruction are inevitably limited.
We attempted to address this need in our longitudinal study on beginning science teachers, using the Electronic Quality of Inquiry Protocol (EQUIP), an instrument with an established
validity argument, to analyze the quality of teachers’ inquiry-based classroom instruction (Marshall, Smart, & Horton, 2010). We are improving our investigation of inquiry-based science instruction by another assessment entitled the Discourse in Inquiry Science Classrooms (DiISC). We are using the DiISC to investigate a variety of instructional, inquiry-based factors that are not addressed with only the EQUIP measure.
35 Literature Review
Research instruments with high quality validity arguments are required for the high-quality research needed to study inquiry-based instruction. In this effort, the DiISC was developed by Baker’s team (2008) for the Communication in Science Inquiry Project (CISIP) to measure
teachers’ fostering science classroom discourse communities. (Lewis, Baker, Bueno Watts, and van der Hoeven Kraft, 2016; Lewis, Baker, and Helding, 2015). The DiISC is a classroom observation instrument designed to measure teachers’ practices in creating a science classroom discourse community through inquiry, oral and written discourse, academic learning strategies and learning principles. In this project we will use multiple measurement instruments, as well as present a modern validity argument for the use of the DiISC instrument that draws on the already-validated EQUIP instrument. Each are described below.
Electronic Quality of Inquiry Protocol (EQUIP) Instrument
In order to better understand teacher behaviors associated with inquiry-based instruction, we investigated the correlations between the DiISC and EQUIP. EQUIP measures the quality of inquiry in an observed science lesson. The instrument consists of 19 items that measure inquiry-based instruction based on four factors: (a) instructional strategies, (b) discourse, (c) assessment practices, and (d) curricular features.
The Discourse in Inquiry Science Classrooms (DiISC) Instrument
The DiISC was initially developed at Arizona State University (ASU) and focuses on observing teachers’ instructional strategies that employ inquiry, discourse (oral and written), academic language development, and learning principles (Baker, et al., 2008). Since the DiISC was developed and validated within the context of a specific PD program, it is program-specific and requires further scrutiny and development of an external validity argument for widespread use. This
36 work aims to establish elements of that validity argument to correspond with aspects of a larger, emerging validity argument (Kane, 1990).
Inquiry in Classrooms and Measurement
While both the EQUIP and DiISC instruments claim to measure constructs associated with inquiry-based instruction, these latent constructs are described by different observed variables. For example, DiISC items describe teachers’ behavior and the instructional strategies they implement to support inquiry, oral discourse, writing, academic language development, and use of learning principles. Similarly, EQUIP items describe observed behaviors of teachers and students to assess the level of inquiry-based instruction in the areas of instruction, discourse, assessment, and curriculum. Unfortunately, the EQUIP instrument does not attend to issues of academic language development, related to equity issues for English language learners (Lee, 2017).
Traditional View of Validity
The classic notion of validity is it that is in the test itself. It is, therefore, part of how the test is used whenever it is used. This inherent validity is typically based on three validity issues
(sometimes referred to in psychometric colloquialism as the ‘holy trinity’ of validity). It is based on content, construct, and criterion validity. This has traditionally drawn on content analyses, factor analyses, and correlations with extant criteria. In the last 30 years the very idea of validity has shifted toward it being an interpretive argument that is made of an instrument, associated with how it is used, and then adopted or not by other researchers when they choose to use that instrument in other studies and for other purposes (Kane, 1992; Messick, 1987, 1995).
Unitary Concept of Validity
The modern view of validity (or unitary concept of validity) reframes validity as an interpretive body of evidence, or preponderance of evidence, that suggests the appropriateness of
37 using a measurement instrument for a particular purpose. In particular, validity is no longer a checklist, an inherent property of a measurement instrument, and is established through an ongoing data collection and analysis process. The aspects of modern or unitary validity include content, external, generalizability or predictability, structural, substantive, and consequential validity. Messick (1994, pg. 9) describes them below.
The content aspect of construct validity includes evidence of content relevance, representativeness, and technical quality. . . . The substantive aspect refers to theoretical rationales for the observed consistencies in test responses, including process models of task performance. . . , along with empirical evidence that the theoretical processes are actually engaged by respondents in the assessments tasks. The structural aspect appraises the fidelity of the scoring structure to the structure of the construct domain at issue. . . . The generalizability aspect examines the extent to which score properties and interpretations generalize to and across population groups, settings, and tasks . . . , including validity generalization of test-criterion relationships. . . . The external aspect includes convergent and discriminant evidence from multitrait-multimethod comparisons . . . , as well as evidence of criterion relevance and applied utility . . . The consequential aspect [included in a broader view of validity discussed below appraises the value implications of score interpretation as a basis for action as well as the actual and potential consequences of test use, especially in regard to sources of invalidity related to issues of bias, fairness, and distributive justice.
Specifically, in this paper with the DiISC, potentially enhances the way in which we are able to capture inquiry-based, teacher practices, academic language development, and learning
principles. Multiple types of evidence are used and analyzed in varied ways to build, support, and establish a strong validity argument (Kane, 1990), including recommendations for fairness and fidelity in testing and interpreting results. Aspects of a validity argument include evidence for content, external, generalizability, structural, substantive, and arguably consequential validity of an assessment. Our purpose was to provide partial evidence for an emerging validity argument for the DiISC instrument.
38 The DiISC measures the creation of science classroom discourse communities (SCDC) to address communication in science and the language needs of all students. The SCDC model is one of situated learning (Lave & Wegner, 1992; Wegner, 1998) in which learning how to talk and write in science contributes to making meaning and the development of structured, coherent ideas (Kelly, 2007; Klein, 1999; Rivard & Straw, 2000 Yore, Hand & Prain, 1999). The DiISC also measures language principles and theories of Carrasquillo and Rodriquez (1996) and the Cognitive Academic Language Approach (Chamot & O’Malley, 1987) for academic language development.
The SCDC model is also based in social constructivism and emphasizes inquiry as a way to build knowledge (National Research Council, 1996). Within inquiry, there is an additional focus on the nature of scientific communication emphasizing text structures, and patterns of argumentation (Halliday & Martin, 1993). As teachers learn in the professional development about building a science classroom discourse community, there has also been a strong focus on learning for understanding science. Consequently, the DiISC was also designed to measure teachers’
implementation of learning principles (Bransford, Brown, & Cocking, 2000; National Research Council, 2005). We present more of the key literature that has undergirded science education reforms in the last 20 years since the first national science education standards were published in 1996 (NRC, 1996).
Scales on the DiISC Teacher Observation Instrument Inquiry Scale
Reform movements and the National Science Education Standards identify inquiry as essential to effective science teaching and student learning (National Research Council, 1996). In addition, the Inquiry scale addresses all of the practices of scientists and engineers describe in the Next Generation Science Standards (NGSS) Framework (i.e., asking questions, planning and
39 carrying out investigations, analyzing and interpreting data, constructing explanations, engaging in argument from evidence, developing models and using mathematics) (National Research council, 2012). Employing inquiry requires teachers to create an environment within which students engage in a set of complex cognitive processes (Windschitl, 2004). The Inquiry scale on the DiISC teacher observation instrument reflects the essential features of inquiry and measures the degree to which inquiry-based instruction takes place in a student-centered classroom where students explore the natural world with varying degrees of independence. The major consideration in developing items for this scale was to identify observable behaviors found in inquiry-oriented classrooms, including, but not limited to, aspects of the 5E instructional model (Bybee, 2009).
Oral Discourse Scale
The Oral Discourse scale measures the degree to which teachers’ instruction bridges students’ everyday experiences and scientific discourse to create a science classroom discourse community. The scale focuses on whether the teacher is providing students with opportunities to build scientific vocabulary and engage in peer-to-peer discussions that support the construction of scientific arguments. It also focuses on whether the teacher is providing opportunities for students to explore the nature of scientific communication.
Scientific discourse in classrooms has been defined as knowing, doing, talking, reading, and writing (Moje, Collazo, Carillo, & Marx, 2001), or as the combination of scientific ways of talking, knowing, doing and using appropriate form of evidences (Lemke, 1990). Scientific discourse provides a vehicle for the social and cultural construction of knowledge (Alexopoulou & Driver, 1996; Kelly & Crawford, 1997; Kelly & Green, 1998; Kittleson & Southerland, 2004) through negotiation of meanings. Newton, Driver, and Osborne (1999) argue that in addition to conceptual understanding, discourse creates a scientific community in classrooms.