Cite this article as: Zawawa, G., Naghawi, H. (2019) "Evaluation of the Operational Performance of Continuous Green T-Intersection under Different Levels of Congestion", Periodica Polytechnica Transportation Engineering. https://doi.org/10.3311/PPtr.14032
Evaluation of the Operational Performance of Continuous
Green T-Intersection under Different Levels of Congestion
Ghayda Zawawa1, Hana Naghawi2*
1 Department of Consruction of Healthcare Sectore Buildings, Ministry of Public Works and Housing, Airport Road- King Abdullah
II Bin Al-Hussien Street, 11118 Amman, Jordan
2 Department of Civil Engineering, School of Engineering, The University of Jordan, Queen Rania Street, 11942 Amman, Jordan * Corresponding author, e-mail: [email protected]
Received: 16 March 2019, Accepted: 05 April 2019, Published online: 05 July 2019
Abstract
The main objective of this paper is to evaluate and compare the operational efficiency of a conventional signalized T-intersection with an unconventional Continues Green T-intersection under different congestion levels. The analysis was performed using Synchro.8 micro-simulation software. A total of 48 hypothetical scenarios, 24 scenarios for each design, were created by changing the approach volumes and turning percentages on the major / minor intersecting roadways to reflect different levels of congestion that may occur
on any urban intersection. Total intersection delay, Level of Service, maximum queue length and volume-to-capacity ratio (v/c) were
the measures of effectiveness used for comparison purposes. These performance measures were selected because they demonstrated the overall efficiency of the intersection design. The simulation results showed that the Continuous Green T-intersection operates the best under stable traffic conditions and that it is not an effective solution for signalized T-intersections under heavy traffic volume. Keywords
Continuous Green T-intersection, microscopic simulation, Synchro.8, unconventional intersection design
1 Introduction
Efficiency of intersections contributes significantly to the efficiency and performance of highway net-works. Each intersection involves through, left and right turning movements between intersecting roadways. These movements create dangerous conflict points among motorized and non-motorized interacting road users (Zheng et al., 2014). These conflicts and the unexpected heavy traffic volumes are the main source of traffic conges-tion, which often results in increased probability of crashes. The National Highway Traffic Safety Administration (Choi, 2010) reported that 36 percent of crashes in the United States occured at intersections. Most common intersections have three or four legs depending on the number of intersecting roadways (Chandler et al., 2013). Three-leg or T-intersections are formed when one road meets another at right or close to a right angle, one of the legs is generally a minor road connecting to a major road. Three-leg signalized intersections perform well under low to moderate traffic volumes but they poorly per-form under heavy traffic volume. Transportation engi-neers have suggested many conventional measures to
enhance the operational performance of three-leg signal-ized intersections such as signal timing optimization, wid-ening on intersections, and grade separation, but the use of these conventional measures have diminishing results (Stamatiadis and Kirk, 2011). In an attempt to improve the operational efficiency and safety characteristics of the three-leg signalized intersections, the Federal Highway Administration (FHWA) (Rice and Znamenacek, 2010) proposed an unconventional intersection design named Continuous Green T-intersection (CGT-intersection). The main objective of the CGT-intersection design is to reduce the severity of potential conflicts. The CGT-intersection is a signalized CGT-intersection which can only be applied at T-intersections. The general concept of the CGT-intersection is to manage traffic through:
1. providing free-flow operations in one direction on the major arterial road while the other movements are controlled with a three phases traffic signal, 2. providing auxiliary acceleration lane on the major
arterial road that are separate from the through movement for the crossroad left-turn movement.
Fig. 1 shows traffic movements on CGT-intersection. This paper evaluates and compares the operational per-formance of an unconventional Continuous Green T-intersection (CGT-intersection) to a conventional signal-ized three-leg signalsignal-ized intersection under different con-gestion levels. For this purpose, two hypothetical intersec-tion designs were created and simulated using Synchro.8 microscopic traffic simulation software.
2 Literature review
2.1 Continous Green T-intersection
Many previous studies have evaluated the safety and oper-ational efficiency of four-leg unconventional intersec-tion designs (Hochstein et al., 2009; Moon et al., 2011; Naghawi and Idewu, 2014; Tarko et al., 2008). Few research-ers studied the three-leg unconventional intresearch-ersection design or CGT-intersection. Most CGT-intersection design studies were based on real traffic data. Jarem (2004) eval-uated safety and operational performance of implementing five CGT-intersection designs in Orlando, Florida. He found that the delay was improved which implies economic ben-efits of the CGT-intersection design, also crashes that were considered to be directly related to CGT-intersection design ranged from 8 % to 24 % out of all crashes at the studied intersections. Also, Sando et al. (2011) assessed the safety benefits of nine CGT-intersections in Florida. It was found that crashes due to merging and diverging maneu-vers are more severe than other crash types at conventional T-intersections. Rice and Znamenacek (2010) published a FHWA safety evaluation report of GCT-intersection. A before and after study was conducted on a two CGT-intersection designs in Colorado. The report stated very positive safety benefits of the design; however, conclu-sions were formed through a very narrow scope of anal-ysis and did not consider other intersection performance aspects. In another FHWA report, safety effects 30 CGT-intersections and 38 conventional signalized T-CGT-intersections from Florida, in addition to 16 CGT-intersections and 21 conventional signalized T-intersections from South Carolina were evaluated and compared. The results showed
that there was a small but statistically insignificant benefit associated with the CGT-intersection relative to the con-ventional signalized T-intersection (Donnell et al., 2016). Finally, Litsas and Rakha (2013) compared the CGT-intersection with the conventional T-CGT-intersection. It was found that the use of CGT-intersection decreased the total delay, fuel consumption and CO2 emission compared to the conventional T-intersection.
2.2 Synchro
Synchro studio is a microscopic simulation software. It is used widely for signal optimization. It implements the Intersection Capacity Utilization (ICU) method for determining inter-section capacity. Synchro.8 supports the Highway Capacity Manual (TRB, 2010) methodology for signalized intersec-tions and roundabouts. Due to its simplicity, traffic models are built within days (Trafficware, 2014).
Synchro has been extensively used by many researchers in analyzing the operational performance of many uncon-ventional intersection designs. Hildebrand (2007) com-pared five unconventional intersection designs including the Bowtie, Continuous Flow, Jughandle, Median U–turn and the Superstreet using Synchro. Naghawi et al. (2018a) used Synchro and Vissim to analyze and compare the oper-ational performance of an existing four-leg signalized intersection design to a proposed superstreet unconven-tional intersection design. Moon et al. (2011) used Vissim, Synchro, and Ssam simulation softwares to evaluate the operational performance and safety benefits of imple-menting superstreet unconventional intersection design. Naghawi et al. (2018b) used Synchro.8 to evaluated and compared the operational performance of three uncon-ventional arterial intersection designs including Median U-turn, Superstreet, and Single Quadrant Intersection using real traffic data. The effect of implementing each of the proposed designs was not only evaluated on the iso-lated signalized intersection, but also on the arterial road including both surrounding intersections.
3 Methodology
Since constructing a live Continuous Green T-intersection and conventional T-intersection for evaluation purposes is a massive undertaking and not feasible in many cir-cumstances. Modeling and simulation of a conventional signalized T-intersection and an unconventional CGT-intersection was carried out using Synchro.8, a micro-simulation software. Synchro. 8 was used as a platform to achieve two things. First, signal optimization of both inter-section designs. Second, as a traffic simulation tool.
Fig. 1 Traffic Movements on Continuous Green T-intersection (Hughes et al., 2009)
3.1 Geometric Design
Bowen et al. (2014) highlighted the importance of the correct design and implementation of the CGT-intersection. For this purpose, both conventional signal-ized T-intersection and unconventional Continuous Green T-intersection had the following geometric elements:
• Both intersections were three-leg intersections formed by two roadways, arterial and collector, crossing at a 90-degree angle.
• Both intersections were eight-lane divided arterial road intersecting with a four-lane undivided collector road. • Each leg of the intersection was considered to be level. • The design of each leg was extended approximately
1000 feet from the center of the intersection.
• Each intersection was designed in accordance with the Policy on Geometric Design of Highways and Streets (AASHTO, 2004) standards for a passenger car and a design speed of 45 mph.
• Lane width was considered to be 12 ft and shoulder width was considered to be 4 ft.
• The main intersection, in both designs, was con-trolled by a three-phase traffic signal.
• The design was completed using computer aided design (CAD) software then it was imported into Synchro.8 simulation software.
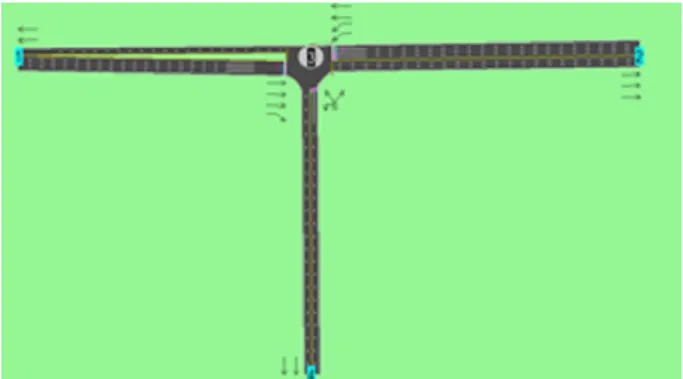
Fig. 2 and Fig. 3 show Synchro.8 model for the con-ventional T-intersection and the unconcon-ventional CGT-intersection respectively.
3.2 Simulation scenarios
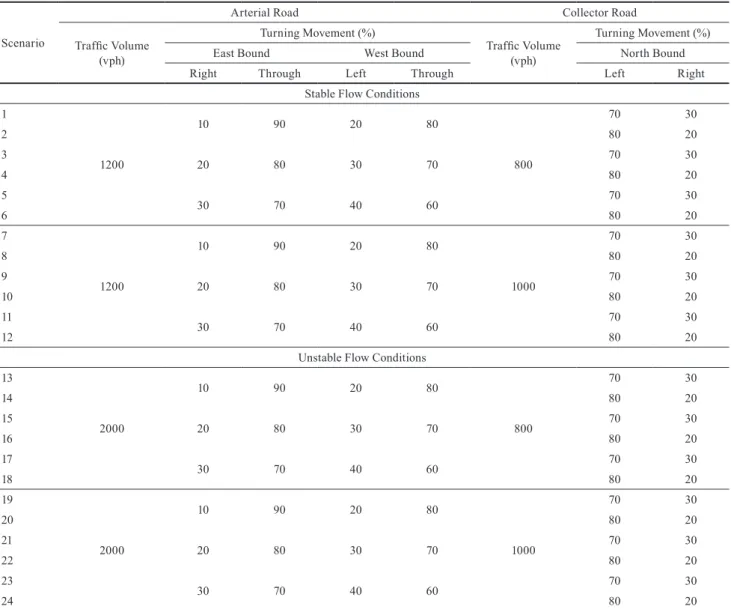
To enable the comparison of conventional T-intersection with the CGT-intersection under different levels of con-gestion. A total of 48 hypothetical scenarios, 24 scenarios for each design, were created by changing the approach volumes and turning percentages on the major arte-rial / minor collector intersecting roadways to reflect dif-ferent levels of congestion that may occur on any urban intersection. These volumes include both stable and unsta-ble volume conditions, where a staunsta-ble scenario represents a case of traffic volumes of 1200 vph on the arterial road and an unstable scenario represents a case of traffic vol-ume of 2000 vph on the arterial road. These volvol-umes were tested with 800 vph and 1000 vph volumes on the col-lector road. Also, the impact of increasing left-turn vol-ume on the intersection performance was considered by modeling the arterial volumes with 20 %, 30 % and 40 % left-turn volume on the West Bound direction, 10 %,
20 % and 30 % right-turn volume on the East Bound direc-tion. Also, the collector road volumes were considered with 70 % and 80 % left-turn volume. Table 1 presents a summary of all traffic volumes tested in this study. 4 Results
Four important measures of effectiveness (MOE) extracted from Synchro.8 output results namely intersection delay, level of service (LOS), maximum queue length and the vol-ume-to-capacity ratio (v/c) were used to evaluate the effi-ciency of the hypnotized conventional T-intersection and the unconventional CGT-intersection designs under differ-ent traffic conditions. These performance measures were selected because they demonstrated the overall efficiency of the intersection design.
4.1 Intersection control delay
Intersection delay is the main measure of effectiveness that evaluates the intersection operational performance, it describes the excess time spent on the intersection due to high traffic volumes and increased cycle lengths, it is used to measure the intersection level of service. The HCM (TRB, 2010) defines LOS as a qualitative measure describ-ing the operational conditions within a traffic stream, based on service measures such as speed and travel time, freedom to maneuver, traffic interruptions, comfort, and
Fig. 2 Conventional T-intersection Model
convenience. For signalized intersections level of service is defined in terms of control delay for the entire intersec-tion. Intersection delay more than (80 sec) indicates forced traffic conditions with LOS F.
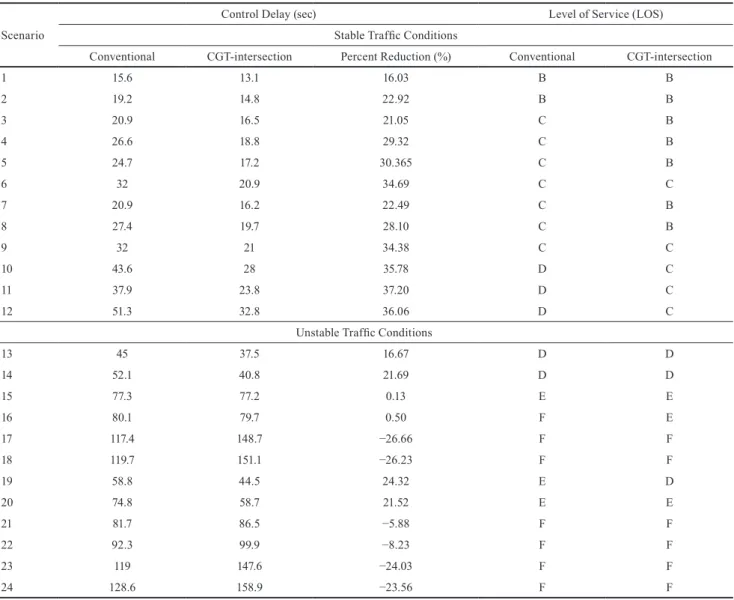
Table 2 shows the comparison results of the Synchro.8 analysis for the conventional signalized T-intersection and the unconventional CGT-intersection using the inter-section control delay (sec) and LOS under stable and unstable traffic conditions.
Table 2 shows that the CGT-interesection generally reduced intersection delay by 16 % to 37 % under all stable traffic condition scenarios, which was reflected on improving the intersection LOS. As for the unstable traffic conditions scenarios, the CGT-intersection slightly reduced the intersection delay in scenarios 15 and 16 which represent moderate left turn traffic from the arterial road with moderate traffic volume on the collector road.
Also, the CGT-intersection slightly increased intersec-tion delay in scenarios 21 and 22 which represent moder-ate left turn traffic from the arterial road with high traffic volume on the collector road. Finally, Table 2 shows that the CGT-intersection significantly increased intersection delay by up to 26 % in scenarios 17, 18, 23 and 24 which represent high left turn volume from the arterial road. These results corresponded to breakdown conditions with LOS F. This indicates that the CGT-intersection operates the best under stable traffic conditions.
4.2 Queue length
In this research, the maximum queue length was also used as a performance measure of effectiveness for evaluating the performance of the unconventional CGT-intersection design when compared to a conventional signalized T-intersection. The FHWA defines queue as the storage of
Table 1 Summary of Tested Scenarios Scenario
Arterial Road Collector Road
Traffic Volume (vph) Turning Movement (%) Traffic Volume (vph) Turning Movement (%)
East Bound West Bound North Bound
Right Through Left Through Left Right
Stable Flow Conditions 1 1200 10 90 20 80 800 70 30 2 80 20 3 20 80 30 70 70 30 4 80 20 5 30 70 40 60 70 30 6 80 20 7 1200 10 90 20 80 1000 70 30 8 80 20 9 20 80 30 70 70 30 10 80 20 11 30 70 40 60 70 30 12 80 20
Unstable Flow Conditions 13 2000 10 90 20 80 800 70 30 14 80 20 15 20 80 30 70 70 30 16 80 20 17 30 70 40 60 70 30 18 80 20 19 2000 10 90 20 80 1000 70 30 20 80 20 21 20 80 30 70 70 30 22 80 20 23 30 70 40 60 70 30 24 80 20
excess vehicles upstream of the bottleneck location when demand exceeds the capacity of the facility during some given time period (Hale et al., 2016).
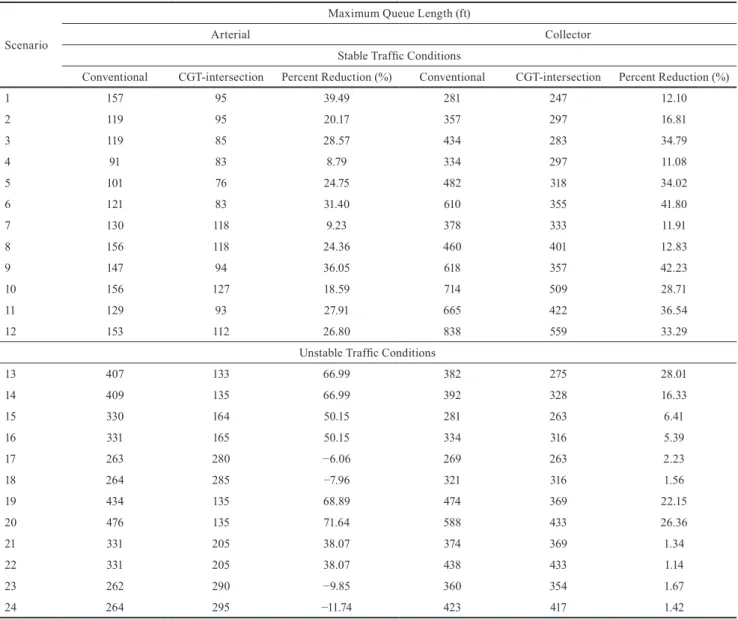
Table 3 shows the comparison results of the Synchro.8 analysis for the conventional signalized T-intersection and the unconventional CGT-intersection using the max-imum queue length on the major arterial and the minor collector roads.
Table 3 shows that on the major arterial road, the CGT-intersection design reduced maximum queue length by almost 10 % to 40 % under all stable traffic condi-tions scenarios. It also shows that, under unstable traf-fic conditions, the CGT-intersection reduced maxi-mum queue length, on the arterial road, in all scenarios except scenarios 17, 18, 23 and 24 which represent high left turn volume from the arterial road. This is consis-tent with the increased intersection delay under these
scenarios. Also, Table 3 shows that on the minor collector road, the CGT-intersection reduced the maximum queue length on the collector road by 11 % to 37 % under all sta-ble traffic condition scenarios. It also shows that, under unstable traffic conditions, the CGT-intersection signifi-cantly reduced maximum queue length on the collector road by up to 28 % in scenarios 13, 14, 15, 16, 19 and 20, but the maximum queue length in scenarios 17, 18, 21, 22, 23 and 24 was slightly reduced which represent high left turn volume from the arterial road.
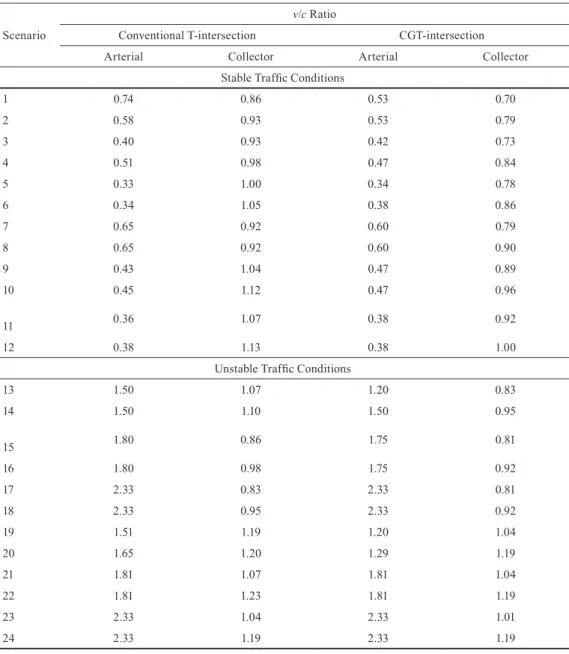
4.3 Volume-to-capacity ratio
Volume-to-capacity ratio (v/c) is the primary performance measure for highway facilities associated with deter-mining how well a roadway is performing. It compares roadway demand (volume) with roadway supply (capac-ity). Generally, it is reported as decimals, according to
Table 2 Intersection Delay and LOS Scenario
Control Delay (sec) Level of Service (LOS)
Stable Traffic Conditions
Conventional CGT-intersection Percent Reduction (%) Conventional CGT-intersection
1 15.6 13.1 16.03 B B 2 19.2 14.8 22.92 B B 3 20.9 16.5 21.05 C B 4 26.6 18.8 29.32 C B 5 24.7 17.2 30.365 C B 6 32 20.9 34.69 C C 7 20.9 16.2 22.49 C B 8 27.4 19.7 28.10 C B 9 32 21 34.38 C C 10 43.6 28 35.78 D C 11 37.9 23.8 37.20 D C 12 51.3 32.8 36.06 D C
Unstable Traffic Conditions
13 45 37.5 16.67 D D 14 52.1 40.8 21.69 D D 15 77.3 77.2 0.13 E E 16 80.1 79.7 0.50 F E 17 117.4 148.7 −26.66 F F 18 119.7 151.1 −26.23 F F 19 58.8 44.5 24.32 E D 20 74.8 58.7 21.52 E E 21 81.7 86.5 −5.88 F F 22 92.3 99.9 −8.23 F F 23 119 147.6 −24.03 F F 24 128.6 158.9 −23.56 F F
the HCM, capacity deficiency occurs when v/c value exceeds 0.90 (TRB, 2010).
Table 4 shows the comparison results of Synchro.8 analysis for conventional signalized T-intersection and the unconventional CGT-intersection using volume-to-capac-ity ratio on arterial and collector roads under stable and unstable traffic conditions.
Table 4 shows that the v/c ratio values on the arterial road were below 0.90 for all stable traffic condition sce-narios. Also, they were slightly improved under all stable traffic conditions on the collector road. While v/c ratio values indicated capacity deficiency on the arterial road and in most scenarios on the collector road under the undatable traffic conditions which implies system failure at the intersection and that the CGT-intersection fail to serve heavy traffic.
5 Conclusion
This main objective of this paper is to evaluate and com-pare the operational efficiency of a conventional signal-ized T-intersection with an unconventional Continues Green T-intersection using Synchro.8 simulation software. For this purpose, two Synchro.8 models depicting the CGT-intersection and a conventional T-CGT-intersection were devel-oped and tested. Several scenarios were created by chang-ing the approach volumes and turnchang-ing percentages on the arterial / collector intersecting roadways to reflect differ-ent congestion levels resulting in a total of 48 scenarios, that's 24 for each model. Also, Synchro.8 was used as for signal optimization of both intersection designs. Each sce-nario had its own independent output, and the most per-tinent variables were extracted from the output and used in the analysis. The variables considered to be of primary
Table 3 Maximum Queue Length Scenario
Maximum Queue Length (ft)
Arterial Collector
Stable Traffic Conditions
Conventional CGT-intersection Percent Reduction (%) Conventional CGT-intersection Percent Reduction (%)
1 157 95 39.49 281 247 12.10 2 119 95 20.17 357 297 16.81 3 119 85 28.57 434 283 34.79 4 91 83 8.79 334 297 11.08 5 101 76 24.75 482 318 34.02 6 121 83 31.40 610 355 41.80 7 130 118 9.23 378 333 11.91 8 156 118 24.36 460 401 12.83 9 147 94 36.05 618 357 42.23 10 156 127 18.59 714 509 28.71 11 129 93 27.91 665 422 36.54 12 153 112 26.80 838 559 33.29
Unstable Traffic Conditions
13 407 133 66.99 382 275 28.01 14 409 135 66.99 392 328 16.33 15 330 164 50.15 281 263 6.41 16 331 165 50.15 334 316 5.39 17 263 280 −6.06 269 263 2.23 18 264 285 −7.96 321 316 1.56 19 434 135 68.89 474 369 22.15 20 476 135 71.64 588 433 26.36 21 331 205 38.07 374 369 1.34 22 331 205 38.07 438 433 1.14 23 262 290 −9.85 360 354 1.67 24 264 295 −11.74 423 417 1.42
importance were intersection control delay, level of service, maximum queue length and volume-to-capacity ratio since these measures directly affect the intersection's perfor-mance and traffic operation. Among the general findings of this research was the CGT-intersection design consistently showed evidence of decreased delay time, improved LOS, descreased maximum queue length and improved vol-ume-to-capacity ratio when compared to the conventional
design under stable traffic conditions. The percent reduc-tion in the intersecreduc-tion delay ranged from 16 to 37 per-cent, this delay reduction was associated with up to 40 and 37 percent reduction in maximum queue length expe-rienced on the arterial and collector roads respectively. But unfortunately, the CGT-intersection design constantly showed capacity deficiency and system failure at the inter-section under heavy traffic loading.
Table 4 Maximum Volume-to-Capacity Ratio Scenario
v/c Ratio
Conventional T-intersection CGT-intersection
Arterial Collector Arterial Collector
Stable Traffic Conditions
1 0.74 0.86 0.53 0.70 2 0.58 0.93 0.53 0.79 3 0.40 0.93 0.42 0.73 4 0.51 0.98 0.47 0.84 5 0.33 1.00 0.34 0.78 6 0.34 1.05 0.38 0.86 7 0.65 0.92 0.60 0.79 8 0.65 0.92 0.60 0.90 9 0.43 1.04 0.47 0.89 10 0.45 1.12 0.47 0.96 11 0.36 1.07 0.38 0.92 12 0.38 1.13 0.38 1.00
Unstable Traffic Conditions
13 1.50 1.07 1.20 0.83 14 1.50 1.10 1.50 0.95 15 1.80 0.86 1.75 0.81 16 1.80 0.98 1.75 0.92 17 2.33 0.83 2.33 0.81 18 2.33 0.95 2.33 0.92 19 1.51 1.19 1.20 1.04 20 1.65 1.20 1.29 1.19 21 1.81 1.07 1.81 1.04 22 1.81 1.23 1.81 1.19 23 2.33 1.04 2.33 1.01 24 2.33 1.19 2.33 1.19 References
American Association of State Highway and Transportation Officials (AASHTO) (2004) "Geometric Design of Highways and Streets", 5th ed., American Association of State Highway and Transportation Officials, Washington, D.C., USA.
Bowen, A., Eubank, M., Kaiser, J., Plattner, D., Richards, G., Smith, B., Steckler, B. (2014) "Intersection Decision Guide", version 1.1, Indiana Department of Transportation (INDOT), Indiana, USA. [online] Avalilable at: https://www.in.gov/indot/files/ROP_ IntersectionDecisionGuide.pdf [Accessed: 03 December 2018]
Chandler, B. E., Myers, M. C., Atkinson, J. E., Bryer, T. E., Retting, R., Smithline, J., Trim, J., Wojtkiewicz, P., Thomas, G. B., Venglar, S. P., Sunkari, S., Malone, B. J., Izadpanah, P. (2013) "Signalized Intersection Information Guide", 2nd ed., Federal Highway Administration (FHWA), U.S. Department of Transportation, Washington, D.C., USA, Rep. FHWA-SA-13-027. [online] Available at: https://safety.fhwa.dot.gov/intersection/conventional/signalized/ fhwasa13027/fhwasa13027.pdf [Accessed: 21 November 2018] Choi, E.-H. (2010) "Crash Factors in Intersection-Related Crashes:
An On-Scene Perspective", Mathematical Analysis Division, National Center for Statistics and Analysis, National Highway Traffic Safety Administration, U.S. Department of Transportation, Washington, DC, USA, Rep. DOT HS 811 366.
Donnell, E., Wood, J., Eccles, K. (2016) "Safety Evaluation of Continuous Green T Intersections", Federal Highway Administration (FHWA), U.S. Department of Transportation, Washington, D.C., USA, Rep. FHWA-HRT-16-036. [online] Available at: https://www.fhwa.dot.gov/publications/research/ safety/16036/16036.pdf [Accessed: 21 November 2018]
Hale, D., Jagannathan, R., Xyntarakis, M., Su, P., Jiang, X., Ma, J., Hu, J., Krause, C. (2016) "Traffic Bottlenecks: Identification and Solutions", Federal Highway Administration (FHWA), U.S. Department of Transportation, Washington, D.C., USA, Rep. FHWA-HRT-16-064. [online] Available at: https://www. researchgate.net/profile/Jia_Hu15/publication/311667537_ Tr a f f ic _ Bot t le ne ck s _ Id e nt i f ic at ion _ a nd _ Solut ion s / links/58ea530aaca2729d8cd59878/Traff ic-Bottlenecks-Identification-and-Solutions.pdf [Accessed: 11 January 2018] Hildebrand, T. E. (2007) "Unconventional Intersection Designs
for Improving Through Traffic along the Arterial Road", MSc Thesis, Florida State University.
Hochstein, J. L., Maze, T. H., Welch, T. M., Preston, H., Storm, R. (2009) "J-Turn Intersection: Design Guidance and Safety Experience", In: Transportation Research Board 88th Annual Meeting,
Washington, DC, United States, Paper Numbers: 09-0474, [DVD]. Hughes, W., Jagannathan, R., Sengupta, D., Hummer, J. (2009) "Alternative
Intersections / Interchanges: Informational Report (AIIR)", Federal Highway Administration (FHWA), U.S. Department of Transportation, Washington, D.C., USA, Rep. FHWA-HRT-09-060. [online] Available at: https://www.fhwa.dot.gov/publications/ research/safety/09060/ [Accessed: 13 September 2018]
Jarem, E. S. (2004) "Safety and Operational Characteristics of Continuous Green through Lanes at Signalized Intersections in Florida", In: ITE 2004 Annual Meeting and Exhibit, Lake Buena Vista, FL, USA, [e-book on CD-ROM] 112th record.
Litsas, S., Rakha, H. (2013) "Evaluation of Continuous Green T-Intersections on Isolated Undersaturated Four-Lane Highways", Transportation Research Record: Journal of the Transportation Research Board, 2348(1), pp. 19–29.
https://doi.org/10.3141/2348-03
Moon, J.-P., Kim, Y.-R., Kim, D.-G., Lee, S.-K. (2011) "The Potential to Implement a Superstreet as an Unconventional Arterial Intersection Design in Korea", KSCE Journal of Civil Engineering, 15(6), pp. 1109–1114.
https://doi.org/10.1007/s12205-011-1157-1
Naghawi, H. H., Idewu, W. I. A. (2014) "Analysing delay and queue length using microscopic simulation for the unconventional intersection design Superstreet", Journal of the South African Institution of Civil Engineering, 56(1), pp. 100–107.
Naghawi, H., AlSoud, A., AlHadidi, T. (2018a) "The Possibility for Implementing the Superstreet Unconventional Intersection Design in Jordan", Periodica Polytechnica Transportation Engineering, 46(3), pp. 122–128.
https://doi.org/10.3311/PPtr.11635
Naghawi, H., Jadaan, K., Al-Louzi, R., Hadidi, T. (2018b) "Analysis of the Operational Performance of Three Unconventional Arterial Intersection Designs: Median U-Turn, Superstreet and Single Quadrant", International Journal of Architectural, Civil and Construction Sciences, 12(3), pp. 387–395.
https://doi.org/10.5281/zenodo.1474325
Rice, E., Znamenacek, Z. (2010) "Intersection Safety Case Study: Continuous Green T-Intersections", Federal Highway Administration (FHWA), U.S. Department of Transportation, Washington, D.C., USA, Rep. FHWA-SA-09-016. [online] Available at: https://safety.fhwa.dot.gov/intersection/innovative/ others/casestudies/fhwasa09016/ [Accessed: 18 January 2018] Sando, T., Chimba, D., Kwigizile, V., Walker, H. (2011) "Safety Analysis
of Continuous Green Through Lane Intersections", Journal of the Transportation Research Forum, 50(1), pp. 5–17.
Stamatiadis, N., Kirk, A. (2011) "Improving Intersection Design Practices", Kentucky Transportation Cabinet, Frankfort, Kentucky, USA, Rep. KTC-10-09/SPR-380-09-1F.
Tarko, A. P., Inerowicz, M., Lang, B. (2008) "Safety and Operational Impacts of Alternative Intersections", Indiana Department of Transportation, Federal Highway Administration (FHWA), U.S. Department of Transportation, Washington, D.C., USA, Rep. FHWA/IN/JTRP-2008/23. [online] Available at: https://docs. lib.purdue.edu/cgi/viewcontent.cgi?article=2661&context=jtrp [Accessed: 13 December 2018]
Trafficware, LLC. (2014) "Synchro Studio 9 with Warrants and TripGen 2014: Getting Started and What's New in Version 9", Trafficware, LLC., Sugar Land, TX, USA. [online] Available at: http://online.trafficware.com/downloads/pdfs/GettingStarted.pdf [Accessed: 18 February 2018]
Transportation Research Board (TRB) (2010) "HCM 2010: Highway Capacity Manual", 5th ed., Transportation Research Board, National Academies, Washington, DC, USA.
Zheng, L., Ismail, K., Meng, X. (2014) "Traffic conflict techniques for road safety analysis: open questions and some insights", Canadian Journal of Civil Engineering, 41(7), pp. 633–641. https://doi.org/10.1139/cjce-2013-0558