I
NTERNATIONALR
ESEARCHJ
OURNALOFM
ULTIDISCIPLINARYT
ECHNOVATION(IRJMT)http://www.mapletreejournals.com/index.php/IRJMT
Received 21 August 2019 ISSN 2582-1040 Accepted 26 October 2019 2019; 1(6); 582-587 Published online 02 November 2019
Biogas Production from Fruit and Vegetable Solid Waste Co
Digested with Sugar Mill Waste Sludge
T. Velayutham 1,*, G. Karthikeyan 2
1 Assistant Professor in Civil Engineering, FEAT, Annamalai University, Annamalainagar – 608 002, Tamil Nadu,
India.
2 Lecturer in Mechanical Engineering, Govt. Polytechnic College, Korukkai, Tamil Nadu, India..
*Corresponding Author E-mail:[email protected]
Doi: https://doi.org/10.34256/irjmtcon83
ABSTRACT
Biogas (methane) production from batch anaerobic digesters containing varying concentration of sugar industry wastewater sludge as inoculums and organic fruit and vegetable market solid waste as a substrate was experimentally studied in this research. It was observed that biogas production was optimized with batch anaerobic digestion of fruit and vegetable solid waste. It was carried out for 60 days at room temperature with untreated sugar industry wastewater sludge as an inoculums with the varying concentration 10%, 20% and 30% of the working volume (Weight) of substrate. The performance of reactors was evaluated by measuring the daily biogas production at the room temperature and pH was maintained in the range of 6.8 to7.3 respectively. The maximum cumulative methane production is 597.66 ml/gVS. The biogas yields at the end of the 60days total cumulative biogas for R1, R2 and R3 was obtained as 382.48ml/gVS, 552.66ml/gVS and 597.66ml/gVS respectively from the reactors. At the end of the 60 days total cumulative biogas for Rc(control) was obtained as 196.85ml/gVS. It was observed that the methane content of the biogas generated from the reactors was in the range of 47–56% in control reactor and that forR1, R2and R3 were 56-61%, 60-67% and 65-74% respectively.
Keywords: Anaerobic digesters, solid waste, waste sludge, cumulative biogas, inoculum.
INTRODUCTION
Bio Gas production by using anaerobic digestion (Bio-mechanisation) for the treatment of the Fruit and Vegetable market waste organic fraction, is getting very attractive from the environmental and the economical points of view. It consists of a biological degradation of the organic matter, under anaerobic conditions, where a biogas, mainly methane (CH4) is evolved, and hence providing a renewable source of energy which may be used in the production of electricity and heat. Municipal solid waste generation is rapidly increasing in Indian urban areas and started creating enormous waste disposal problems in the recent past. Anaerobic digestion of source sorted and shredded garbage can is an attractive option for both energy generation as well as waste disposal. Though anaerobic digestion of cattle dung has been the commercial biogas energy production technique for many years, application of anaerobic digestion to other wastes such as municipal garbage is yet to obtain commercial acceptance in India. India has established industries like Sugar industry, Milk and dairy products factory, petroleum refinery, soap and detergent, breweries, textiles, food and beverage industries. The various effluents produced by these industries are discharged into the environment. Treatment of all kinds of wastewater before
discharging into the environment is essential to prevent the pollution of water bodies where it is most likely to be discharged. These toxicants and pathogens when not sufficiently reduced cause a lot of diseases and premature deaths. Batch and semi-continuous anaerobic digestion systems are two widely used techniques for bioenergy conversion of organic fraction of wastes in developing countries like India. Batch digestion systems are the simplest ones to use due to their ease of application, operation, and low investment and associated maintenance costs. Several studies have been made on the bioconversion of biomass by different researchers, for example Mata-Alvarez et al., 1992 carried out experiments on Barcelona’s central food market organic wastes, Lane, 1984 and Prema Viswanath et al., 1992 on fruit and vegetable wastes, Krishna N et al., 1991 on canteen wastes, Ranade et al., 1987 on market waste and Cho et al., 1995 on Korean food wastes. Webb and Hawkes, 1985 have studied the gas yield–organic loading relationships for anaerobic digestion of poultry litter. Rao et al., 2000 have studied the ultimate bioenergy production potential of municipal garbage in batch reactors. There is a large number of factors which affect biogas production efficiency such as environmental conditions like pH, temperature, type and quality of substrate, mixing Molnar and Bartha, 1989 process inhibitory parameters like high organic loading, formation of high volatile fatty acids, inadequate alkalinity etc. This paper deals with the experimental study carried out by means of laboratory scale plant to generate biogas from the Municipal Solid Waste The literature contains a number of interesting reports dealing with the application of co-digesting sewage sludge with other substrates such as crude glycerol Fountoulakis et al., 2010 animals manure Hassan, 2014 as well as agriculture wastes Komatsu et al., 2007; Rughoonundun et al., 2012. While anaerobic co-digestion has been studied and practiced for a broad range of sewage sludge, however very few studies have been conducted on the co-digestion of sewage sludge and municipal solid waste as a co-substrate Gomez et al., 2006; Agdag et al., 2007; Lebiocka and Piotrowicz, 2012. To bridge the existing gaps in the field of study, this work investigated the combined anaerobic digestion of industrial sewage sludge as inoculum and municipal organic waste as a substrate on the overall stability and efficiency of the process. The objective of this study was to obtain the optimal conditions for biogas production from anaerobic digestion of municipal solid waste (MSW) using various concentration of inoculums from sources like an untreated Sugar industry Wastewater. The study of these parameters will help us to establish a biogas system with available substrate and utilize different types of available organic waste for biogas production.
MATERIAL AND METHODS
The experiments were carried on batch Scale laboratory reactor (acrylic bottle) with total capacity of 20 L. The reactor was made of acrylic sheet with bottom sampling outlet. The bottles were closed by rubber stoppers equipped with glass tubes for gas removal and for adjusting the pH. The effective volume of the reactor was maintained at 13L. Biogas production from the reactors was monitored daily by water displacement method. The volume of water displaced from the bottle was equivalent to the volume of gas generated. The reactors were operated at room temperature. The study had been carried out with the two different inoculums sources in an anaerobic condition using Untreated Sugar Industry Waste water sludge . The percentage of inoculum for fermentation of the organic wastes is approximately 10%, 20% and 30% of the working volume (Weight) of substrate. The inoculum was collected and kept at 4°C until used, which contains all the required microbes essential for anaerobic digestion process. Fresh combined FVW were used as feed to the bio rector. The organic FVW consists of food waste, fruit waste, vegetable waste from nearby vegetable market and house hold. The wastes were sorted and shredded, then mixed several times in laboratory and kept at 4°C until used. All reactors were loaded with raw feed stock and inoculated with Untreated Sugar industry Wastewater sludge was added to obtain the desired total solid concentration.
A. Experimental procedure
The study is programmed to evaluate the co-digestion of Fruit and Vegetable market waste(FVW)with sugar industry waste water sludge at three different initial concentrations 10,20 and,30% of weight of (FVW). The substrate concentration was expressed as weight of solids/total volume of solids plus water, assuming that the density of the solids is approximately equal to the density of water. Four reactors (R1, R2, R3) and one control (Rc) without inoculum(as shown in fig -1)were operated at a volume of 20L and 13L (10kg) effective volume at continuous condition with different inoculums concentrations of 10%, 20% and 30% of weight solids respectively. All the reactors were fed with municipal garbage, tap water and Untreated Sugar industry Waste (inoculum), used as the starter in the reactors. The research was carried out in triplication. The data obtained from the study then is averaged and the cumulative volume of biogas production was observed during 60 days.
B. Analytical methods
The parameters analysed for the characterization of substrates were as follows: Total Solids (TS), Volatile Solids (VS), pH, Volatile fatty acid (VFA), Total Organic Carbon (TOC).Following quantities were monitored during the digestion process: pH, VFA, alkalinity, Ammonia nitrogen (NH3-N), COD and production of biogas. All analytical determinations and gas production were estimated according to the procedures recommended in the Standard methods for examination of water and waste water. Gas production was measured at a fixed time each day by the water displacement method, with water prepared as specified in standard methods (APHA, 1989). Gas samples were collected by gas sampling injectors and a sample of 100lit was used for each run. The biogas composition (CH4+CO2) was determined using a Gas Chromatograph (Chemito GC model 7610) equipped with a thermal conductivity detector and stainless steel column of length 6 ft, OD 1/4 in., ID 2 mm, Porapak Q 100 having mesh range 80–100. The carrier gas used was H2 and the analysis was carried out at a carrier gas flow rate of 30 ml/min with the injector, column and detector temperatures maintained at 120, 90 and 120ͦ respectively. The gas quality was checked once a week
RESULTS AND DISCUSSION
A. Substrate characteristics and co substrate (Inoculum) characteristics
The characteristics of the substrate and co substrate (inoculums) untreated sugar industry wastewater sludge were shown in the Table.1 and 2 The experiments were done for 60 days.
Table 1. Characteristics of Substrate – Chidambaram Town Fruit and Vegetable Market waste
S.No. Parameters Value/weight fraction (%)
1. Moisture (%) 80.5
2. pH 5.13
3. Total solids (%) 19.5
4. Total volatile solids (%)* 90.3
5. Ash content (%)* 12.55
6. Total organic carbon (%)* 20.35
7. Total nitrogen (%)* 1.03
8. Chemical oxygen demand (ppm) 3952
Degradation of substrate started steadily in the reactors; it took about 5- 6 days for initiation of biogas production.
Table.2 Characteristic of Inoculum – Untreated Sugar Industry Waste sludge
Sl.no Pollution indicators Mean values
1 COD (mg/l) 1360-2,000
2 BOD (mg/l) 300-2,200
3 Total suspended solids (mg/l) 870-1950
4 pH 6.5-8.8
5 Chlorides (mg/l) 18-40
6 Nitrate (mg/l) 6.2
7 Phosphate (mg/l) 0.8
B. Performance Study of inoculums
To study the effect of co substrate concentration on the performance of the anaerobic co-digestion process FVW as substrate with initial untreated sugar industry waste water sludge taken as inoculums at the concentrations of 0%, 10%, 20%, 30% (Rc, R1, R2, R3) of the weight of substrate. The TS content was presented in term of dry matter and the cumulative biogas maintained at room and ambient temperature along. The digestion was characterized without fluctuation of biogas production at the beginning. Degradation of substrate started almost immediately and proceeded without problems in all digestions and biogas production is significantly increased due to exponential growth of microorganisms and to their higher adaptation to the change of the concentration of inoculums. Figure 2 indicates the cumulative biogas production for 4 reactors (Rc, R1, R2 & R3). The biogas production was low in the beginning which was due to the log phase. After 15 days observation, biogas production for all samples tends to increase and this is due to exponential growth of microorganisms’ stationary phase of microbial growth. The daily biogas yield, biogas produced per gram organic solids (volatile solids) for different concentrations of inoculums over a 60 day digestion time at room temperature (32°C) is shown in Figure 3. The rates of biogas production differed appreciably according to the TS concentration. Furthermore, as shown in Figure 2, the maximum cumulative biogas production obtained for Rc was 196.85ml/gVSml/gVS in 60th day. At the end of the 60days total cumulative biogas for R1, R2 and R3 was obtained as 382.48ml/gVS, 552.66ml/gVS and 597.66ml/gVS respectively. The lower biogas yield indicated that there was an inhibition of methanogenic bacteria. It can be observed from Figure 2, that the bulk of substrate degradation takes place up to a period of 50-55 days suggesting that the digesters should preferably be run at a digestion time close to 50-55 days for optimum energy yield
The pH was constantly checked and variation in pH was observed in all the three cases with R3 showing more pronounced effect. The pH was corrected to 6.9-7.2 in all the reactors by adding 4M-NaHCO3 solution occasionally. The change in pH at R3 was shown in Figure 4. In an anaerobic system, the acetogenic bacteria convert organic matter to organic acids, possibly decreasing the pH, reducing the methane production rate and the overall
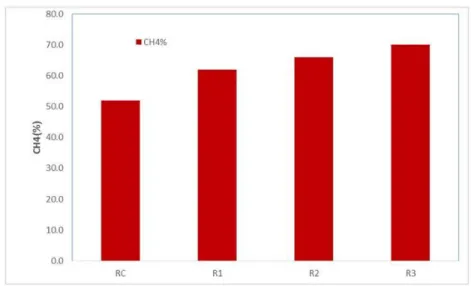
anaerobic digestion process unless the acids were quickly consumed by the methanogens. pH in the range of 6.8 to 7.4 should be maintained in the anaerobic digestion process, which is the optimum range for methanogens growth. A decrease in pH was observed during the first few days of digestion due to the high volatile fatty acids formation; hence the pH was adjusted to 7 using 4M-NaOH solution. The methane production occurs at pH (6.9-7.4) with maximum value of (597.66/gVS). From this Figure 5 shows the methane content of the biogas generated from the reactors, was in the range of 47–56% in control reactor and that forR1, R2and R3 were 56-61%,
60-67% and 65-74% respectively. The biogas generated from the reactors was in the range of 62– 72% obtained by Rao M.S., and S.P. Singh (2004). In our study the methane content of the biogas generation was high to compare to the other researchers. This is due to influence of co digestion substrate.
Fig. 1 Batch Reactors
Figure 2. Cumulative Gas Productions FVW co-digested with Untreated Sugar Waste water sludge
Figure 3. Daily Gas Productions FVW co-digested with Untreated Sugar Waste water sludge
Figure 5. Percentage Methane Content in Reactors
The biogas production was decreased after 55days due to lack of amount of substrate. CONCLUSIONS
In today’s energy consumption life style, converting waste to energy technique co digestion of Fruit and Vegetable market Solid Waste (MSW) with sugar industry waste water sludge proves to be renewable source of energy in the form of biogas. Anaerobic digestion of FVW with Untreated Sugar industry Waste water sludge inoculums reactors increased the cumulative biogas yield. After studying the various parameters of all the different inoculums concentration substrates of FVW it was observed that the methane generation was lowest in control reactor (Rc). Study revealed that the gas generation directly depends on the co-substrate concentration and initial characteristics of the substrates. The results indicate that the Untreated Sugar industry Waste water sludge is the best co substrate source of methane generation due to its microorganism biodegradation capacity. Biogas production from FVW could be enhanced by adopting biotechnological applications. And further study could be carried by various pre-treatments of above substrates to gain maximum methane gas production. At the end of the 60days digestion about 597.66ml/gVS biogas was produced.
REFERENCES
[1] Agdag, O.N. and Sponza, D.T, Co-digestion of mixed industrial sludge with municipal solid
wastes in anaerobic simulated land filling bioreactors. J. Hazardous Materials vol. 140, pp. 75- 85, 2007.
[2] Apha, Standard Methods for the Examination of Water and Wastewater, 17th ed. Washington,
DC., 1989.
[3] Gomez, G., Cuetos, M.J., Cara J., Moran, A., Garcia, A.I. Anaerobic co-digestion of primary
sludge and the fruit and vegetable fraction of the municipal solid wastes: Conditions for mixing and evaluation of the organic loading rate. Renewable Energy, vol. 31, pp. 2017- 2024, 2006.
[4] Hartmann, H., and Ahring, B.K. Anaerobic digestion of the organic fraction of municipal solid waste: Influence of co-digestion with manure. Water Research, vol. 39 (8), pp. 1543-1552, 2005.
[5] Hassan, R. Anaerobic digestion of sewage sludge and cattle manure for biogas production:
influence of co-digestion. Int. Water Technol. J., vol. 4 (2), pp. 107 – 113, 2014.
[6] Igoni, A.H., Ayotamuno, M.J., Eze, C.L., Ogaji, S.O.T., Probert, S.D. (2008) Designs of
anaerobic digesters for producing biogas from municipal solid-waste. Applied Energy, vol. 85, pp. 430–438, 2008.
[7] Komatsu, T., Kudo, K., Himeno, S. Anaerobic Co-digestion of Sewage Sludge and Enzyme
Pretreated Rice Straw. J. of Japan Sewage Works Association, vol. 44, pp. 139-150, 2007.
[8] Krishna Nand, Sumithra Devi, S., PremaViswanath, S., Somayaji Deepak, Sarada, R.,
Anaerobic digestion of canteen wastes for biogas production: process optimisation. Process Biochemistry vol. 26, pp. 1–5, 1991.
[9] Lane, G., Laboratory scale anaerobic digestion of fruit and vegetable solid waste. Biomass
vol. 5, pp. 245–259, 1984.
[10] Lebiocka, M., Piotrowicz, A. Co-digestion of sewage sludge and organic fraction of municipal
solid waste. a comparison between laboratory and technical scales. Environ. Protect. Eng., vol. 38 (4), pp. 157 – 162, 2012.
[11] Mata-Alvarez, J., Llabres, P., Cecchi, F., Pavan, P., Anaerobic digestion of the Barcelona
central food market organic wastes: experimental study. Bioresource Technology vol. 39, pp. 39–48, 1992.
[12] Mata-Alvarez, J., Mtz-Viturtia, A., Llabres-Luengo, P., Cecchi, F., Kinetic and performance
study of a batch two-phase anaerobic digestion of fruit and vegetable wastes. Biomass and Bioenergy vol. 5 (6), pp. 481–488, 1993.
[13] Molnar, L., Bartha, I., Factors influencing solid-state anaerobic digestion, Biological wastes
vol. 28, pp. 15–24, 1989.
[14] PremaViswanath, S., Sumithra Devi, S., Krishna Nand, Anaerobic digestion of fruit and
vegetable processing wastes for biogas production. Bioresource Technology vol. 40, pp. 43– 48, 1992.
[15] Ranade, D.R., Yeole, T.Y., Godbole, S.H., Production of biogas from market waste. Biomass
vol. 13, pp. 147–153, 1987.
[16] Rao, M.S., Singh, S.P., Bioenergy conversion studies of organic fraction of MSW: kinetic
studies and gas yield-organic loading relationships for process optimization. Bioresour. Technol., vol. 95, pp. 173–185, 2004.
[17] Rao, M.S., Singh, S.P., Singh, A.K., Sodha, M.S., Bioenergy conversion studies of the organic
fraction of MSW: assessment of ultimate bioenergy production potential of municipal garbage. Applied Energy vol. 66, pp. 75–87, 2000.
[18] Richards, B.K., Cummings, R.J., White, T.E., Jewell, W.J., Methods for kinetic analysis of
methane fermentation in high solids biomass digesters. Biomass and Bioenergy vol. 1 (2), pp. 65–73, 1991.
[19] Rughoonundun, H., Mohee, R, Holtzapple, M.T., Influence of carbon-to-nitrogen ratio on the
mixed-acid fermentation of wastewater sludge and pretreated bagasse. Bioresource Technol., vol. 112, pp. 91-97, 2012.