Introduction
1.
Software has become an indispensible technology field for the FUJIFILM to provide highly functional, high-performing products in various areas including medicine. The importance of software development is increasing even more because of the advancement of the technology used in products and the increase in the complexity of systems. This has made higher-than-ever competence in skills, know-how and quality management necessary for managing software development.
With the situation being like this, FUJIFILM Corporation and the FUJIFILM Software Co., Ltd. together introduced and carried out project management for the enhancement of software development capability.
We acquired project management skills based on the Capability Maturity Model Integration (CMMI) model, which is widely used all over the world as a project management technique for the purpose of improving quality and lowering cost and delivery time (QCD), established performance baselines and performance models, and then implemented our own statistical project management system with features such as controlling the speed of reviewing for defect detection.
As a result, we could reduce the number of defect corrections needed in the last phase of the project by improving the defect detection rate at earlier phases, and achieve improvement in QCD due to the reduction in the delay in delivery and in the man-hours required for defect corrections.
We report on the project management technique that we practiced and the benefit obtained.
Limit of the Existing Project Management
2.
Techniques
The project management technique that has been used in the Fujifilm provides guarantees for product quality by first defining the standard development process of an organization, and then running the project on the basis of this standard process. In this way, the development process and the finished product are managed.
Moreover, we have established a system where the development data of all projects are stored in a database shared by the whole organization, so that the experience of the past can be used as references for planning and cost estimation.
However, in order to make sure that QCD is improved and to make contributions to the organization, it is necessary to quantify the QCD objective for a project and to be able, over the whole duration of the project, to control the project statistically and to predict whether or not the objective is reachable or not. Since the existing project management process does not include a framework for managing projects in such a way, there are limits to the management that can be carried out with the existing system. The process based on statistical data that we explain in the next section is indispensible for advanced project management.
Details of the Process Based on Statistical
3.
Ddata
For a process based on statistical data, it is required that the following two process areas are covered: “Organizational Process Performance”, in which action is chiefly taken as a
Introduction and Practice of Statistical Project Management
Technique in Software Development
Masashi AISO**, Kouki YUASA**, and Keiichi SUZUKI*
Abstract
We implemented innovative project management in order to strengthen software development technology. We acquired project management skills based on CMMI (Capability Maturity Model Integration) which is used as a model for QCD (Quality, Cost and Delivery) improvement all over the world, and practiced statistical project management (eg. establishing process performance baselines and models, controlling reviewing speed to thoroughly discover software defects and so on). As the result, we improved QCD, reducing the number of times to correct defects by increasing the defect discovery rate in the early phases of development.
Original paper (Received December 1, 2010) * Software Research & Development Center
Research & Development Management Headquarters FUJIFILM Corporation
Shin-yokohama, Kouhoku-ku, Yokohama, Kanagawa 222-0033, Japan
** Business Process Re-engineering Division Software Corporate Engineering Division FUJIFILM Software Co., Ltd.
Shin-yokohama, Kouhoku-ku, Yokohama, Kanagawa 222-0033, Japan
group to make progress in project management and process improvement, and “Quantitative Process Management”, chiefly comprising activities of the development project1).
Organizational Process Performance
3.1
T he pu r pose of def i n i ng orga n i zat ional process performance is to understand quantitatively the performance of current processes in order to meet the QCD objective. Specifically, the following activities are required:
(1) Process Performance Data
The performance data of the project is analyzed, and then the data for each process are analyzed and compiled.
(2) Process Performance Baseline
This is a statistical index that indicates the process capability. Used as a benchmark for comparing the actual and expected process performance.
(3) Process Performance Model
A st at ist ical model is created f rom t he process performance data and used for predicting the future results of the process.
Quantitative Project Management
3.2
The purpose of the quantitative project management is to achieve the QCD objective set by the project by managing the major processes in the development project using a statistical method. Specifically, the following activities are required:
(1) Setting the Quantitative Oobjective of the Project
A quantitative objective regarding the QCD of the project is set.
(2) Selection of the Processes to be Statistically Managed
Processes that are important for achieving the objective are selected and statistical management methods are used for them.
(3) Abnormality Detection and Correction
The focused processes are managed statistically and any abnormality in the data that may hinder achievement of the objective should be detected and corrected.
(4) Prediction on Objective Aachievement
The state of the project is analyzed statistically and predictions on the possibility of achieving the objective are made. The process perfor mance baseline and the process perfor mance model that were established during the organizational process performance evaluation activities are used for the activities listed above.
Application to a Project
4.
We applied the process based on statistical data to the medical console development organization.
Story-making for Introducing the Project
4.1
Management Technique Bbased on
Statistical Data
In order to introduce a process based on statistical data, we set up a story of project management for achieving the
organizational target. Then, we analyzed the data of the medical console development organization in the past and identified what needs to be improved, and considered the entire story up to predicting the results of the changes.
Analysis of the Number of Man-hours Required 4.1.1
for Defect Corrections
Although in any development project, delivery of high quality products as scheduled is set as a target, the reality is that not all projects are always successful in delivering on schedule.
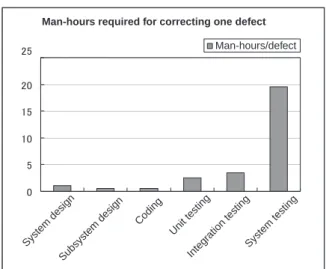
As a result of the analysis of data on the medical console development organizations in the past that we conducted to identify the cause of failing to meet the deadline, we found out that the number of man-hours required for defect corrections is highest in the very last system testing phase, and is the biggest factor in delaying the delivery.
As seen in Fig. 1, the result of the analysis shows that the man-hours required for one defect correction is about twenty times more in the last system testing phase than in an early system design phase.
This led us to think that, by finding out defects in an early system design phase and the coding phase, we can reduce the number of defects that occur in the last system testing phase, which will lead to the decrease in the overall man-hours required and help prevent delay in delivery.
0 5 10 15 20 25 System design Subsystem design Coding Unit testing Integ ration testing System testing Man-hours/defect
Man-hours required for correcting one defect
Fig. 1 Relative time necessary to correct one defect in each phase.
Analysis of Reviewing Speed and Defect Density 4.1.2
For the purpose of working out measures for finding defects in the earlier phases such as designing and coding and reducing defects occurring in the last system testing phase, we analyzed the correlation between the defect density (the number of defects found relative to the size of the delivered software) and the reviewing speed (the size of software reviewed per hour) in the data obtained from the past medical console development organizations.
As shown in Fig. 2, we thus found out that in both the designing phase and the coding phase, the effect of reviewing speed on defect density changes at a certain reviewing speed.
Based on this we introduced a policy that, during the reviewing in the design phase and the coding phase, the reviewing speed should be controlled appropriately so that the reviewer is able to find out as many defects as possible. This is considered to reduce the number of defects found in the later phases and so contribute to the reduction of man-hours required for defect corrections in total.
Reviewing speed (pages/hour)
Def
ect density (per page)
Correlation between the reviewing speed and the defect density
Fig. 2 The correlation between reviewing speed and defect density.
Predicting the Effect to be Achieved 4.1.3
Based on the data obtained in the past on the defect density in each phase and the number of man-hours required for defect corrections, we calculated the effect of maintaining appropriate reviewing speed to find defects in the early designing phases and coding phase. It was thus estimated that the number of man-hours required for defect correction will be reduced by 56.6%.
Executing the Organizational Process
4.2
Performance Management
Establishing Performance Baseline 4.2.1
In order to find defects in the early designing phases and coding phase by controlling the reviewing speed, it is necessary to manage the defect density and the reviewing speed in each of the development phases.
Based on the data of medical console development organizations in the past, we used statistical techniques to establish performance baselines regarding the defect density, the reviewing speed and the number of man-hours required in defect correction, which enabled the comparison of the actual process performance and the expected process performance.
In establishing and applying the performance baselines we considered the following points:
(1) A baseline should consist of an average value and the standard deviation. This means that the actual performance of an organization is to be within a range distribution.
(2) The baselines are created for the purpose of continuous monitoring; and are updated in half-term cycles. Any such changes in baselines are monitored.
Establishing Performance Models 4.2.2
With the purpose of managing the product quality at each phase of the development, we established performance models for defect density and the number of man-hours used for defect correction, which made it possible to predict the defect density and the number of man-hours at the system testing phase, which is the very last phase of development.
The defect density prediction model is built by applying regression analysis on the data obtained from the medical console development orga n i zat ions i n the past. By substituting the values of accumulated defect density for each phase of a project under development in a regression formula, the predicted defect density in later phases can be obtained.
In the case of the prediction model for the number of man-hours used in defect correction, by using the data on the accumulated man-hours used in defect correction and the defect density in each phase of a project under development, it is possible to obtain a prediction of the man-hours required for defect correction in later phases.
Practicing Quantitative Project Management
4.3
Setting the Objective of the Project 4.3.1
In order to execute quantitative project management, it is necessary to select the processes to be quantitatively measured, and to set the product quality and performance objectives of the project, based on the organizational goal, the performance baselines, and the performance models.
An objective that the quantitative project management aims to achieve should satisfy the following two properties:
(1) It should be expressed in terms of a number (or numbers), with a range of a certain width
(2) It should be manageable with a statistical method during the course of the project.
Moreover, in order to make the quantitative project management actually possible, it is necessary to come up with a system by which the projects can be managed well even in the middle of a phase, for example, by setting intermediate objectives for each phase. Having considered all these aspects, the numerical objectives are set for each project.
Early Abnormality Detection and Correction 4.3.2
Using a Management Chart
Based on the organizational baselines and the project objectives, we prepared a management chart which shows the defect density and the reviewing speed in each of the development phases and made efforts to find abnormalities and correct them at an early stage2).
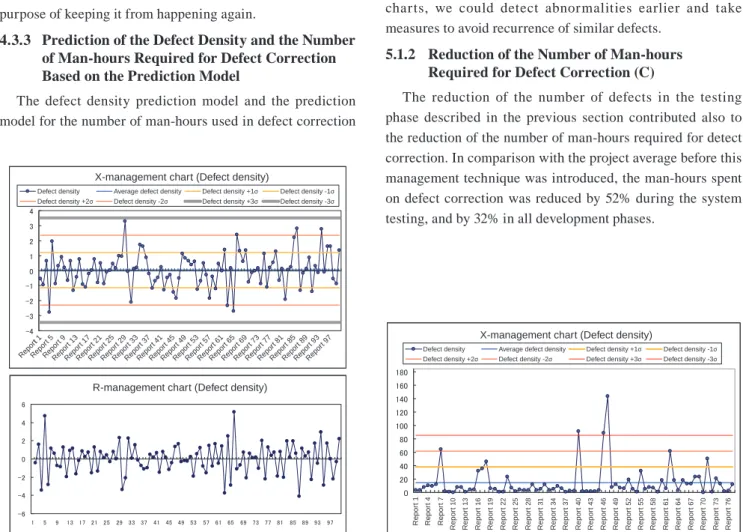
Fig. 3 shows an example of an X-R management chart. In the designing phases and the coding phase, one reviewing report is plotted as a point, while in the testing phase, the number of tests conducted per day and the number of defects found per day are recorded and the hourly and daily values of the defect density are calculated. This is plotted in the chart as one point.
By checking using the chart above, the judgment whether the process is deviating from its normal progress was made. The rules for making this judgment were defined by each organization, and when one of the conditions given below is satisfied, we considered that it is likely that the deviation may have happened. The possibility of any of the conditions given below happening should be very low, so when it is the case, it is possible that it was a phenomenon caused by some unusual factor:
(1) Eight consecutive points appear on the same side (2) Five consecutive points appear on the same side, and
four of those five are outside the 1σ line
(3) Three consecutive points appear on the same side, and
two of those three are outside the 2σ line (4) Any point appears outside the 3σ line
Fig. 4 shows an example of the case that there is a point
beyond the 3σ line. In a case like this, we analyzed the cause
of deviation and took some corrective measures, for the purpose of keeping it from happening again.
Prediction of the Defect Density and the Number 4.3.3
of Man-hours Required for Defect Correction Based on the Prediction Model
The defect density prediction model and the prediction model for the number of man-hours used in defect correction
established by the organization were applied to a project to predict the defect density and the number of man-hours required for defect correction at the point when the system testing phase is finished.
In each of the development phases of a project, the data for the defect density and the number of man-hours used in defect correction were substituted in a regression formula, and it was possible to estimate those values for the later phases. Such estimates were used in determining whether the product quality target may be achieved or not in each phase.
Results Achieved
5.
Improvement of the QCD
5.1
Reduction of the Number of Defects in the 5.1.1
Testing Phase (Q)
In the design phases and the coding phase, the reviewing speed was controlled appropriately so that it was possible to find many defects in these earlier phases. Consequently, the number of defects found in the later system testing phase was reduced. In comparison with the project average before this management technique was introduced, the defect density during the system testing was reduced by 41%.
Moreover, by exploiting the prediction models and by strengthening monitoring capability using management charts, we could detect abnormalities earlier and take measures to avoid recurrence of similar defects.
Reduction of the Number of Man-hours 5.1.2
Required for Defect Correction (C)
The reduction of the number of defects in the testing phase described in the previous section contributed also to the reduction of the number of man-hours required for detect correction. In comparison with the project average before this management technique was introduced, the man-hours spent on defect correction was reduced by 52% during the system testing, and by 32% in all development phases.
X-management chart (Defect density)
Repor t 1 1 Repor t 5 Repor t 9 Repor t 13 Repor t 17 Repor t 21 Repor t 25 Repor t 29 Repor t 33 Repor t 37 Repor t 41 Repor t 45 Repor t 49 Repor t 53 Repor t 57 Repor t 61 Repor t 65 Repor t 69 Repor t 73 Repor t 77 Repor t 81 Repor t 85 Repor t 89 Repor t 93 Repor t 97
Defect density Average defect density Defect density +1σ Defect density -1σ
Defect density +2σ Defect density -2σ Defect density +3σ Defect density -3σ
R-management chart (Defect density)
Fig. 3 X-R control chart.
0 Repor t 1 Repor t 4 Repor t 7 Repor t 1 0 Repor t 1 3 Repor t 1 6 Repor t 1 9 Repor t 2 2 Repor t 2 5 Repor t 2 8 Repor t 3 1 Repor t 3 4 Repor t 3 7 Repor t 4 0 Repor t 4 3 Repor t 4 6 Repor t 4 9 Repor t 5 2 Repor t 5 5 Repor t 5 8 Repor t 6 1 Repor t 6 4 Repor t 6 7 Repor t 7 0 Repor t 7 3 Repor t 7 6
X-management chart (Defect density)
Defect density Average defect density Defect density +1σ Defect density -1σ
Defect density +2σ Defect density -2σ Defect density +3σ Defect density -3σ
Reduction in the Delay in Delivery (D) 5.1.3
Due to the reduction of the man-hours required for defect correction in the system testing phase, which was the biggest factor in the delays in delivery, we could improve the degree of lateness of delivery of the project to be ±1.0%, close to delivery on time in each case, after introducing this new management technique, whereas the figure was ±18.6% before this technique was introduced.
Obtaining a CMMI Maturity Level 4 Rating
5.2
A formal appraisal of the medical console development organization of the FUJ IFILM Cor poration and the FUJIFILM Software Co., Ltd. was conducted in March 2010 by a CMMI lead appraiser certified by the Software Engineering Institute at Carnegie Mellon University. We were appraised to have a maturity level of 4. In Japan, only two companies have been appraised to have a maturity level rating of 4 or more, under the current CMMI-Ver. 1.2, and we are the third such company.
Conclusion
6.
In this report, FUJIFILM Corporation and FUJIFILM Software Co., Ltd. jointly worked on the introduction of a statistical project management scheme. For that purpose, we acquired project management skills and established performance baselines and performance models. Then, we implemented our own statistical project management, with features such as controlling the reviewing speed for efficient defect detection. As a result,
• We identified issues that need to be improved after
analysis of past data, and predicted quantitatively the improvement achieved by proposed measures.
• In order to realize quantitative project management,
which is the basis of statistical project management, we set numerical objectives and established our own performance baselines and performance models to be used for projects.
• The improvement achieved was demonstrated
quantitatively.
The results achieved by the introduction of this statistical project management technique were in the direction that the medical console development organization was striving. However, it is necessary to continue to work on improvement to enhance our software development competence further. We plan to improve our project management technique in software development and extend this technique to products and services other than medical consoles.
References
1) Sof t ware Engi neer i ng I nstit ute, Car negie Mellon University. CMMI for Development, Version 1.2 (in Japanese). Information-technology Promotion Agency, Japan, 2006.
2) Nakamura, Tatsuo. Management char t constr uction methods and utilization. Tok yo, Japan St andards Association. 1999, 154p.
(In this paper, “CMMI” is a registered trademark in U.S.A. of Carnegie Mellon University, U.S.A., and it refers to a scheme for assessing the process maturity of development organizations in terms of five maturity levels, developed by the Software Engineering Institute of Carnegie Mellon University.)