LifeTag: WiFi-based Continuous Location Logging for
Life Pattern Analysis
Jun Rekimoto1,2, Takashi Miyaki3, and Takaaki Ishizawa4 1
Interfaculty Initiatives in Information Studies, The University of Tokyo 7-3-1 Hongo, Bunkyo-ku, Tokyo 113-0033 Japan
2
Interaction Laboratory, Sony Computer Science Laboratories, Inc. 3-14-13 Higashigotanda, Shinagawa-ku, Tokyo 141-0022 Japan
3
Graduate School of Frontier Sciences, The University of Tokyo 7-3-1 Hongo, Bunkyo-ku, Tokyo 113-0033 Japan
4
Keio University Graduate School of Media and Governance 5322 Endo, Fujisawa-shi, Kanagawa 252-8520 Japan
Abstract. Continuous logging of a person’s geographical position is required for various “life-log” applications, such as memory aids, automatic blog generation, and life pattern analysis. GPS is one way of logging, but it is unable to track
movements indoors, and hence cannot track people’s ordinary activities. We
propose a WiFi-based location detection technology for location logging. It de-tects a device’s location from received WiFi beacon signals. It works indoors and outdoors, and its estimated accuracy is often comparable to that of GPS. We built WiFi-based location logging systems based on a smart phone and a keychain-like device using custom hardware. These prototypes record WiFi information every few minutes, and this information is converted into actual location logs. We de-scribe some life patterns created by analyzing these location logs. We also discuss various application examples and ideas for when continuous location logging be-comes commonplace.
1
Introduction
“Life-logging” or “reality mining” is a technology that records personal activities by using various sensing devices [6, 1, 5]. Such archived information can be used for sup-porting people’s memories, organizing information, and helping communications.
Of the various data types for life logging, one of the simplest and most usable is location data. If a person had a perfect record of time-stamped location logs, it would become possible to assign a location to any time-stamped data, such as pictures or voice notes. A location log can also represent personal preferences (e.g., frequently visited places), and activity patterns [4] (e.g., commuting from home to the office, working, and holidays). By accumulating the logs of many users, it would also become possible to detect communication patterns in a community.
The realization of location logging requires a technology that can precisely and continuously record person’s locations without too much effort from users. GPS (global positioning satellite) can track location, and there are already commercial GPS loggers, such as SONY GPS-CS1, and life-log projects using GPS [2]. However, we consider
that GPS is not adequate (or, at least not enough) for continuous location life-logging for the following reasons:
– People’s activities, especially in urban environments, are mostly indoors, and GPS works very poorly (or does not work at all) in indoor environments. Even outdoors, GPS’s accuracy becomes worse in urban areas with limited sky views and building signal reflections.
– GPS sensing requires a certain amount of time to starts from a “cold-start” mode. To periodically record a person’s location (e.g., every 5 minutes), the GPS device must always be “on” in order to track the GPS satellites. This feature consumes a lot of battery power and thus makes it difficult to construct a long-life logging device.
– For life-logging purposes, it is often not enough to record the latitude and longi-tude when a person is in a building. More precise information in a building, such as “floor” and “room” level information would often be required. Although GPS can detect height information, its accuracy is not enough to distinguish individual floors.
For these reasons, location logging using GPS is not always effective. In fact, the GPS-logger devices on a market are mainly designed for outdoor activities such as mountain climbing.
Instead of GPS-based solutions, we propose a WiFi-based location logging system called “LifeTag”. LifeTag uses a WiFi access point location database to detect its loca-tion [3, 8, 7, 9]. Unlike other WiFi-based posiloca-tioning systems, LifeTag simply records the nearby access points’ signal strength with access point IDs. Later, this recorded in-formation is converted into actual location inin-formation by referring to the access point location database. This feature greatly simplifies the location-logging device’s hard-ware, and makes it possible to develop a logging device as small as a keychain.
This paper presents the LifeTag device and its applications. First, we briefly intro-duce our WiFi-based location platform called PlaceEngine. Then we explain how the LifeTag device works and how recorded logs can be used for various applications.
2
PlaceEngine: Location Estimation using WiFi Signal Strength
We developed a WiFi-based location platform service called “PlaceEngine” [9]. This is a web service5that estimates a user’s location and sends him or her location information after receiving a query consisting of WiFi signal information (or WiFi “fingerprints”) including MAC addresses and the received signal strengths (RSSI) of nearby access points.
For this service, we also constructed an access point database that covers major cities in Japan. This database stores more than half a million access points and their es-timated locations. Access point locations are eses-timated by combining various methods, including:
– War Driving: Driving a car throughout the city, collecting WiFi signal fingerprints
and also recording GPS information as reference location information.
– Warwalking: WiFi signal fingerprint collecting by walkers who spot locations
indi-cated on maps.
– End User Register: End users of this system explicitly register locations by using a
map interface.
– Access Log Analysis: Analyzing end users query logs.
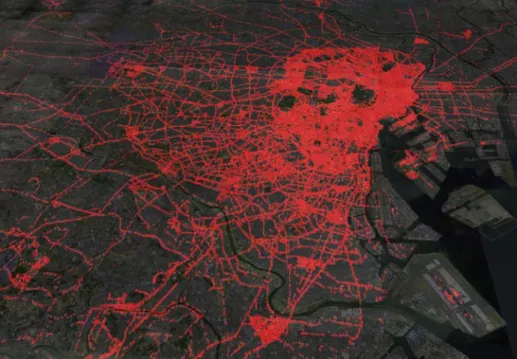
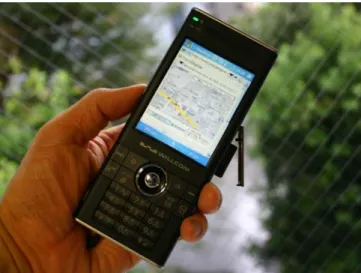
Figure 1 shows the results of access point database estimation around the Tokyo metropolitan area. As shown in this map, almost all of the downtown area is cov-ered by WiFi access points. Figure 2 shows a typical location-aware application using PlaceEngine.
Fig. 1. WiFi access point locations estimation (Tokyo metropolitan area). It contains information
on over half a million access points.
Position estimation using WiFi works both indoors and outdoors. Figure 3 compares the estimation results of GPS (Sony’s VGP-BGU1 GPS device) and WiFi (PlaceEngine) location logs. The accuracy of GPS estimation is affected by surrounding environments, such as building shadows or roofs. GPS accuracy is greatly reduced in indoor envi-ronments, whereas WiFi location estimation is not affected in building shadows and indoors.
PlaceEngine also provides a unique feature that estimates floor or room informa-tion. The idea is similar to social tagging. Each end user can attach symbolic tag names,
Fig. 2. Example of position sensing application using PlaceEngine WiFi location platform.
indoors
indoors
WiFi
GPS
Actual
1m
estimatedactual
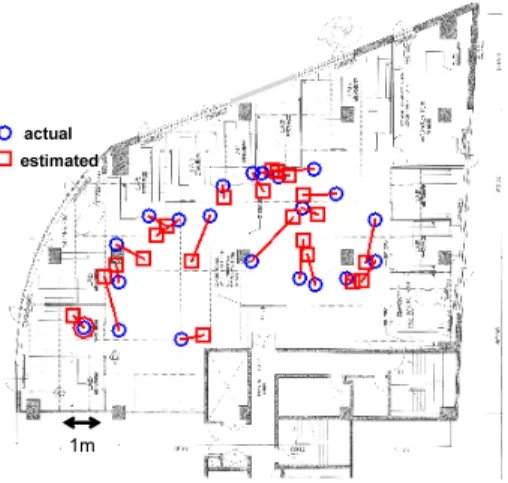
Fig. 4. Example of indoor position estimation.
such as “2F” or “meeting room A” to a particular location. The attached name infor-mation is stored with WiFi signal fingerprints in the database. Later, when a user asks for a location, the PlaceEngine service compares the current WiFi signal fingerprint and stored fingerprints in the database, and also conducts tag “voting” to determine which symbolic name is most appropriate for the current WiFi situation. When the first choice of voting is significantly stronger than the second choice, the system replies with the symbolic floor or room name as well as with the estimated geographical location (i.e., latitude and longitude) and address.
3
LifeTag Location Logging System
We developed a personal location-logging system called “LifeTag” that is based on the PlaceEngine location platform. The user of this system carries a small WiFi sensing device that periodically records surrounding WiFi fingerprint information (WiFi access point IDs and received signal strength). Later, this recorded information is converted into actual location logs by accessing the PlaceEngine’s WiFi location database. We think this approach is suitable for location life-logging, especially in urban areas, be-cause:
– It works both indoors and outdoors. It is also possible to detect the floor number of a building by analyzing WiFi signal information.
– The device only has to sense and record WiFi fingerprint information so it can be made simple and small. In particular, the logging phase does not require any net-work communication or access to a large database. Recorded information turns into actual locations (longitude, latitude, etc.) when the device connects to a network. – WiFi signal recording is quick. The device simply receives and records WiFi beacon
packet information for a short period (typically less than one second). Unlike GPS, there is no “cold-start” phase to find the satellites. This is a useful power saving
feature, because the device can normally be in a sleep mode and only has to wakeup periodically for signal logging.
– WiFi access points are already very densely deployed in many urban areas (Fig-ure 1). Thus, WiFi signals can almost always be detected in cities in order to track one’s location.
– While WiFi-location technology such as the PlaceEngine mainly focus on a WiFi access point managed by anonymous owners, careful calibrations with exact ac-cess point location information can give even better estimation accuracy (Figure 4). Since infrastructure often exists in offices or campus environments, location log for people in such areas will be extremely accurate.
WiFi Module
USB interface
Flash Memory
AVR microcontroller
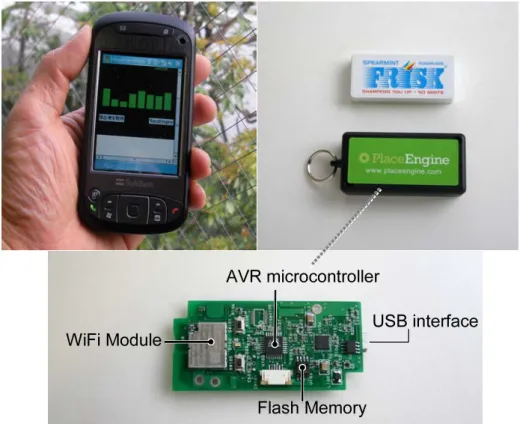
Fig. 5. LifeTag: two hardware configurations (left: smart phone version, right: keychain version
with custom logging hardware)
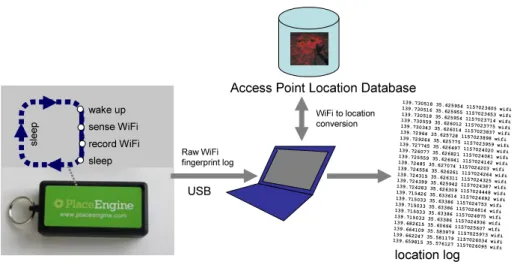
Based on the above design principles, we prototyped location logging devices with two hardware configurations. The first prototype uses an existing smart mobile phone with WiFi capability (Figure 5-left). The logging function is implemented as a software module. During the logging phase, this device is normally in a sleep mode. The soft-ware module periodically (typically in every 3 minutes) wakes up the device and records
sleep wake up sense WiFi record WiFi
USB
Access Point Location Database
139.730518 35.625954 1157023605 wifi 139.730516 35.625955 1157023653 wifi 139.730518 35.625954 1157023714 wifi 139.730559 35.626012 1157023775 wifi 139.730343 35.626014 1157023837 wifi 139.72964 35.625728 1157023898 wifi 139.729264 35.625775 1157023959 wifi 139.727745 35.626497 1157024020 wifi 139.726077 35.626821 1157024081 wifi 139.725559 35.626941 1157024142 wifi 139.72485 35.627074 1157024203 wifi 139.724556 35.626261 1157024264 wifi 139.724315 35.626311 1157024325 wifi 139.724399 35.625942 1157024387 wifi 139.724283 35.626309 1157024448 wifi 139.715426 35.633614 1157024692 wifi 139.715033 35.63386 1157024753 wifi 139.715033 35.63386 1157024814 wifi 139.715033 35.63386 1157024875 wifi 139.715033 35.63386 1157024936 wifi 139.682615 35.60666 1157025607 wifi 139.664109 35.583979 1157025973 wifi 139.662247 35.581179 1157026034 wifi 139.659815 35.576127 1157026095 wifi WiFi to location conversion Raw WiFi fingerprint log location log sl ee p
Fig. 6. LifeTag operation cycle: logged WiFi fingerprint data is translated into actual location logs
by referring to the WiFi access point location database.
nearby WiFi access point signal information. The entire logging phase takes 3 seconds and the device goes back into sleep mode after the signal information is recorded. Bat-tery power consumption is greatly reduced because of this intermittent feature. As a result, the device runs for 4 to 5 days without recharging.
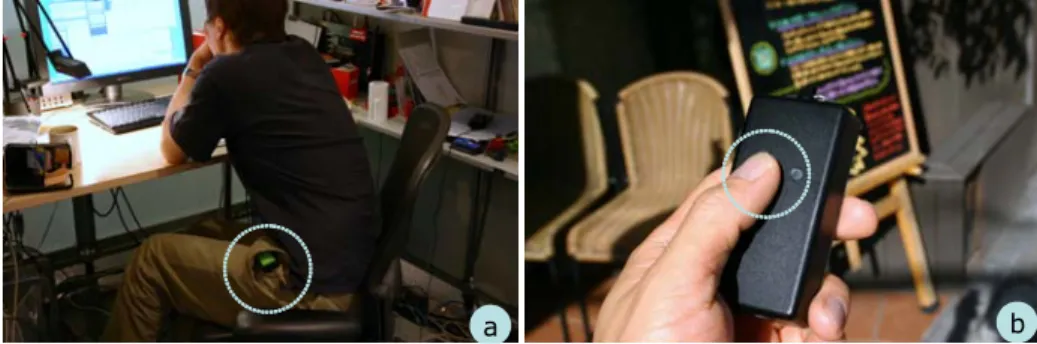
Figure 5-right shows the LifeTag keychain prototype built with our custom hard-ware. It consists of a WiFi module, flash memory, a real time clock, USB interface, and an AVR 8bit microcontroller. The device is significantly smaller than the smart phone version, and it intended to be used as an object like a keychain (Figure 7, left). Peo-ple simply carry this device in their pocket, and the device automatically records WiFi signal fingerprints.
The logged data of both prototypes is a list of timestamped WiFi signal fingerprints and is not itself a location log. This data is later translated into actual location infor-mation by referencing the PlaceEngine WiFi access point database. Figure 6 shows the overall architecture of the LifeTag system and sample location logs.
3.1 Location Bookmaking
The LifeTag keychain has an additional feature besides logging: a button to explicitly “bookmark” the place (Figure 7). The user presses the button when he/she would like to bookmark the current location, and the LifeTag wakes up and records the WiFi signal information. Later, this information can be used as a part of location history charted with special bookmark tags.
4
Location Logging Applications
The method and devices described in the previous section enable anyone to record very dense and continuous location logs. As an initial experiment, we asked three volunteer
a b
Fig. 7. Using LifeTag on a daily basis: (a) continuously logging locations in indoor and outdoor
environments. (b) manually bookmarking a place of interest.
users (including one of the authors of this paper) to carry devices and record location logs for about four months. The log interval varies from 1 minute to 5 minutes. The total number of location records was 271,000 (90,269 per person).6
This section explains various application possibilities of personal location logs.
4.1 Assigning location tags to time-stamped data and day playback
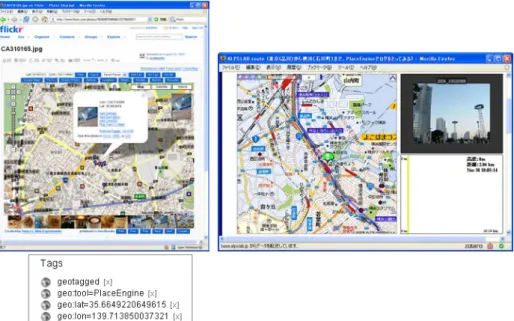
Figure 8 shows two typical applications using location log data. Figure 8 (left) is a photo sharing service (Flickr) with automatically assigned location tags (called “geotags”) to pictures. Pictures are taken with a digital camera, and a software module automatically matches the picture’s timestamp and location log’s time stamp and assigns a geotag to each picture. After that, pictures can be organized by location with a Flickr map services based on geotags. Although the camera itself has no location sensors, such as GPS, all the pictures can be given location tags.
Figure 8 (right) is a “day playback” application. This application takes location log data and plays it back by moving a map according to the log’s locations. This application also automatically shows pictures according to location by analyzing timestamps and geotags assigned to the pictures. This combination of map animation and pictures helps users to recall past activities.
4.2 Activity Pattern Visualizations
In addition, by analyzing the location information, a person’s activity patterns and pre-ferred places in the city can be ascertained. We generated map visualizations based on such location history patterns.
Figure 9 is a “heatmap” that represents a person’s probability density. In this map, frequently visited places, such as the office, become brighter than other areas. This map is a fingerprnt (life pattern) of the person’s overall activity.
6
The location bookmarking feature described in the previous section was not completely im-plemented during the trial phase. Thus, the discussion in this section focuses on automatic and implicit location logging.
Fig. 8. Two applications using location logs: (left) A Flickr photo browser enhanced by location
tags. (right) Route “playback” software to review activities of recent days.
Fig. 9. A heatmap based on a person’s probability density. The brightest spot is the user’s office,
A B
A B
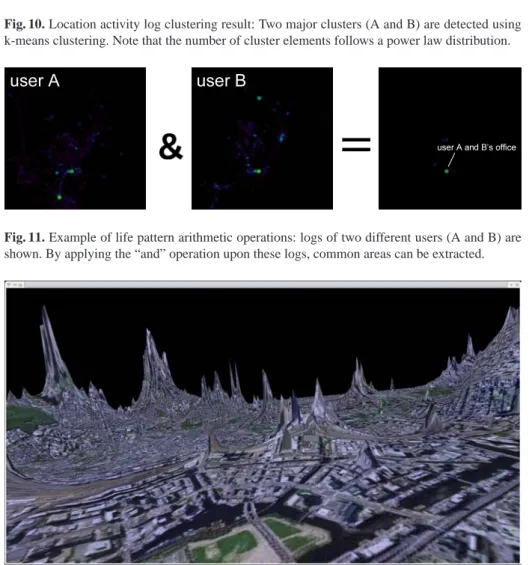
Fig. 10. Location activity log clustering result: Two major clusters (A and B) are detected using
k-means clustering. Note that the number of cluster elements follows a power law distribution.
&
=
user A
user B
user A and B’s office
Fig. 11. Example of life pattern arithmetic operations: logs of two different users (A and B) are
shown. By applying the “and” operation upon these logs, common areas can be extracted.
Fig. 12. Tokyo city landscape based on a person’s location history. The z-axis is not height, but
re-flects the probability density of person’s location. Frequently visited areas become hills or moun-tains.
Fig. 13. A person’s “cognitive” map based on his or her location history. Areas are distorted to
reflect the person’s location probability density. Frequently visited areas become larger on the map.
More precisely, Figure 10 shows the result of location log clustering. We used the k-means clustering algorithm and detected the clusters it gave. The two topmost clusters are marked “A” and “B”, and they represent this person’s home and office.
4.3 Life pattern arithmetic: comparison of two location logs
By analyzing the location logs of two persons, it is possible to find a “common place” for them. Figure 11 shows the result of performing an “and” operation on the location logs of two persons. The right map in Figure 11 represents places where both user A and user B exist at (almost) the same time. Since these two users work in the same office building, there is one brightest spot (marked as “user A and B’s office” in this map), while other smaller areas are also detected.
4.4 Personalized geographical visualization based on activity patterns
Figure 12 is a city map deformed with a person’s location history. The map’s height (z-axis) reflects the person’s probability density (how likely it is that this person is at this position in the city). If this person visits a particular place more frequently, that place is given a higher altitude. The resulting landscape may differ from person to person, and it reflecte each person’s activity pattern. Figure 13 also shows the location history by using a multiple fisheye deformation technique. In this case, the area’s size reflects the person’s location probability density. If we assume that the importance of a place can be determined from a person’s location density, such a visualization will resemble a “cognitive map” that people may have in their minds.
These views are our initial attempts on how a city view can be changed according to individual life patterns. As expected, these city views differ from person to person,
and it can be said they are visualizations of the lives of the persons in question. City views also reflect a person’s life status (daytime-map and night-map, or weekday-map and holiday-map are also quite different from each other).
5
Browsing Support for Location Logs
The previous section shows various visualization examples of location logs. These vi-sualizations are useful for getting overall impressions of activity patterns. On the other hand, browsing and searching of the location history is also useful for recalling activi-ties on a particular day.
Since the raw location log is merely a list of (timestamped) latitude and longitude values, it is not understandable without some system support.
5.1 Activity lists by reverse geocoding
Figure 14-a shows a simple location history using street addresses. Addresses are ob-tained from a reverse-geocoding database (a database that converts latitude and longi-tude values into street addresses). This is more readable than a list of latilongi-tudes and lon-gitudes, and by applying simple substitution rules, such as (Higashigotanda 3 chome, Shinagawaku to “Office”), the list can be made more understandable (Figure 14-b). These text logs can be automatically generated and used for searching and browsing. They are also useful for writing blogs.
00:00-12:25 Home
12:30 Kosugi Nakahara-ku Kawasaki-shi 12:35 Higashitamagawa Setagaya-ku Tokyo 12:45 Shimomeguro Meguro-ku Tokyo 12:50-13:25 Kami-Oosaki Shinagawa-ku Tokyo 13:30-15:15 Higashigotanda Shinagawa-ku Tokyo 15:30 Kamioosaki Shinagawa-ku Tokyo 15:35 Ebisu-nishi Shibuya-ku Tokyo 15:40 Jinguumae Shibuya-ku Tokyo 15:45 Tomigaya Shibuya-ku Tokyo 15:50-16:45 Tomigaya Shibuya-ku Tokyo 17:35-19:50 Higashigotanda Shinagawa-ku Tokyo 19:50-20:10 Higashigotanda Shinagawa-ku Tokyo 20:15 Kamioosaki Shinagawa-ku Tokyo 20:20 Kamioosaki Shinagawa-ku Tokyo 20:30 Okusawa Setagaya-ku Tokyo 20:35 Shinmaruko Nakahara-ku Kawasaki-shi 20:40 Hiyoshi Kohoku-ku Yokohama 20:45-23:55 Home
00:00-12:25 at home
12:30-13:30 commuting to office 13:30-15:15 Office
15:30-15:45 moving to Shibuya Office 15:50-16:45 Shibuya Office 17:35-19:40 Office 19:50-20:45 going home 20:45-23:55 at home (a) (b)
Fig. 14. Textual representation of location logs (a) Results of simple reverse-geocoding (b)
5.2 “Place Cloud”
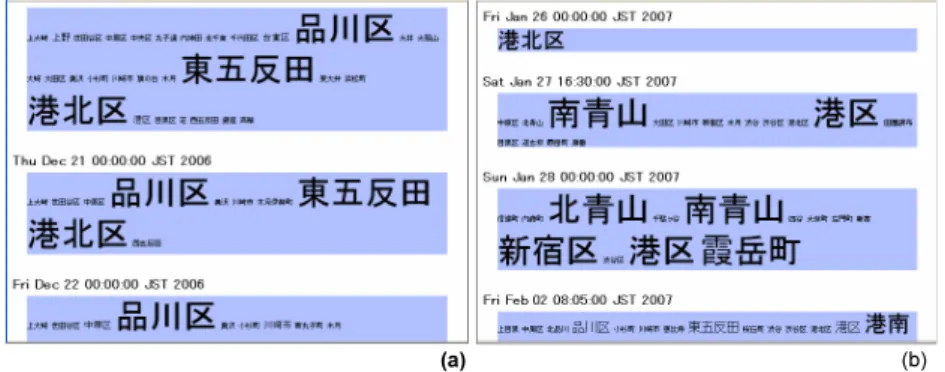
Figure 15 is another textual representation using a variant of a tagcloud. A tagcloud is a commonly used technique in social tagging applications. It shows the frequency of attached tag words by changing the word sizes.
(a) (b)
Fig. 15. PlaceCloud: a tagcloud variant of a location history. (a) tag size is determined simply by
duration spent at the location. (b) tag size is determined by TF/IDF
In our case, address words, such as “品川区(Shinagawa-ku)” or “東五反田 (Hi-gashigotanda)” are regarded as tags attached to days. We call this a “placecloud”. If a person stays in one place longer, the corresponding placetag frequency also increases. As a result, each day has placetags with frequency counts. Figure 15-(a) is a simple tagcloud based only on tag frequency. The tag size represents the time in which a per-son stays in a corresponding location. It is useful, but the same places, such as office or home, tend to constantly become bigger than other placetags, and the resulting visual-izations become similar over the course of many days.
Figure 15-(b) is a placecloud using “TF/IDF” [10] to determine tag importance. TF/IDF is a populartext mining technique to determine the importance of words based on word frequency and word distribution among documents. Using TF/IDF,wi,j, which is the weight (importance) of the wordjin documenti, can be determined as:
wi,j=tfi,j×log(N
dfi
) (1)
wheretfi,jis the number of occurrences of wordiin documentj,dfiis the number of documents containing wordi, andNis the total number of documents.
By applying the TF/IDF idea to location logs, we can regard “days” as “documents” and “places” as “words” and determine the weights of the places. Figure 15-(b) shows placeclouds based on TF/IDF weights. In this visualization, if a place commonly ap-pears in lists of many days, like a home or an office, the tag size becomes smaller even when a person stays a long time in these places. On the other hand, if a person visits an uncommon place, the corresponding tag size becomes bigger. Therefore, this TF/IDF placecloud shows notable places based on person’s location history.
Fig. 16. Automatic “Event” detection from personal history: dark areas represent unusual events
for this person.
5.3 “Event” Detection
By extending the idea of picking up notable days, it is also possible to detect a point in time that is “special” to each person. Normally, life is “routine”; we wake up at home, commute to the office, and go back home. By accumulating personal location logs, it becomes possible to predict a person’s location probability density. Thus, if the user is at an unlikely location at a particular time, it is likely that this is a special occasion for the person.
For example, it might be considered usual for a person to be in his/her office at 3 PM, but not in the same office at 3 AM. The unlikely situation would thus be an important event. It is possible to detect such “events” from the person’s location log automatically. Figure 16 visualizes such “events” in the form of a calendar. This event information can be used to assist memory and automatic creation of blogs.
6
Conclusion
We described a system that continuously and precisely records one’s location history. Unlike a GPS-based system, our system can detect and record indoor positions. This feature is essential for logging location histories because most daily activities are in indoor environments. The underlying WiFi location platform, called PlaceEngine, pro-vides a location estimation service using a database consisting of more than half a mil-lion estimated access point locations. It covers the major cities in Japan and it has proven to be useful for the life-logging purposes described in this paper.
Our LifeTag device is a keychain-like device that automatically senses and records WiFi fingerprint information around a user. We showed various applications and visu-alization techniques exploiting the obtained location logs.
Although we mainly focused on the uses of WiFi location detection technology, other location technologies such as GPS and UWB could be used as well. Using other kinds of sensors, such as motion or orientation sensors, to assist in life-logging is also possible, although there is a tradeoff between benefit and hardware complexity.
As described in this paper, it is now possible to record an accurate location history of a person’s whereabouts. This means any time-stamped data, such as digital pictures, can automatically be “location-stamped” by matching timestamps. Hence, it can be said that “when” and “where” data are now interchangeable. We may also be able to make “who” data interchangeable with “when” and “where” data, by analyzing the location logs of multiple users. It is often said that daily events have five main attributes of “when,” “where,” “who,” “why,” and “how”. Location logging is a simple but effective technology because it has a potential to merge three of the “W”s (when, where, and who) into one.
7
Acknowledgement
We thank Shigeru Tajima for his hardware design and construction supports.
References
1. CARPE 2004.
research.microsoft.com/CARPE2004.
2. Daniel Ashbrook and Thad Starner. Learning significant locations and predicting user
move-ment with GPS. In Proceedings of IEEE Sixth International Symposium on Wearable
Com-puting (ISWC02), 2002.
3. Paramvir Bahl and Venkata N. Padmanabhan. RADAR: An in-building RF-based user
loca-tion and tracking system. In INFOCOM (2), pages 775–784, 2000.
4. Brian Clarkson. Life patterns: structure from wearable sensors. Ph.D thesis, MIT Media
Laboratory, 2002.
5. N. Eagle and A. Pentland. Reality Mining: Sensing complex social systems. Personal and
Ubiquitous Computing, 10(4), 2006.
6. Jim Gemmell, Gordon Belland Roger Luederand Steven Drucker, and Curtis Curtis Wong.
MyLifeBits: Fulfilling the Memex vision. In ACM Multimedia 2002, pages 235–238, 2002.
7. Seigo Ito, Hiroshi Yoshida, and Nobuo Kawaguchi. Studies on collection method of access
point in metropolitan-scale 802.11 location systems. In 8th International Conference of
Ubiquitous Computing (Ubicomp2006), 2006.
8. Anthony LaMarca, Yatin Chawathe, Sunny Consolvo, Jeffrey Hightower, Ian Smith, James
Scott, Timothy Sohn, James Howard, Jeff Hughes, Fred Potter, Jason Tabert, Pauline Powledge, Gaetano Borriello, and Bill Schilit. Place Lab: Device positioning using radio beacons in the wild. In Proceedings of Pervasive 2005, 2005.
9. Jun Rekimoto, Atsushi Shionozaki, Takahiko Sueyoshi, and Takashi Miyaki. PlaceEngine:
A wifi location platform based on realworld-folksonomy. In Internet Conference 2006, pages 95–104, 2006. in Japanese.
10. Gerard Salton and Chris Buckley. Term weighting approaches in automatic text retrieval.