X-ray Diffraction and SEM Studies on the Effect of
Temperature on the Formation of Main Phase
Sr2MgSi2O7 Using a Wet and Dry Method for its
Preparation
Sabbagh Alvani, Ali Asghar *+ and Sarabi, Ali Asghar
Department of Polymer Engineering, Amirkabir University of Technology, P.O. Box 15875-4413, Tehran, I.R. IRAN
Moztarzadeh, Fathollah and Rabie, Mohammad
Faculty of Biomedical Engineering, Amirkabir University of Technology, Tehran, I.R. IRAN
Kamali, Mohammad Javad
Department of Chemical Engineering, Iran University of Science and Technology, Tehran, I.R. IRAN
ABSTRACT: A pure Silicate host namely Sr2MgSi2O7 as a support for a long-lasting afterglow when dopped with rare-earth elements was sought after. To this end the process of obtaining firing temperatures of the above mentioned phase in normal condition was carried out using suggested wet and dry methods. The degree of purity obtained in these preparatory methods as well as the different firing temperatures were studied by the aid of SEM and XRD techniques. It was found that for the wet method there exists a temperature beyond which the amount of impurity remained constant. There also existed a temperature at which both the wet and dry methods gave the same amount of impurity. Beyond this temperature the wet method would be preferred.
KEY WORDS: Silicate host, Main phase, Firing temperature, Wet and dry methods.
INTRODUCTION
Most phosphors are composed of a transparent microcrystalline host (i.e. the matrix) together with an activator (i.e. small amounts of intentionally added impurity atoms distributed within the host’s crystal structure).
The luminescence process therefore is subdivided into processes mainly related to the host and processes occurring around and within the activator. In recent decades, appropriate supports (i.e. superior hosts) giving different and special optical properties upon treatment
*To whom correspondence should be addressed.
with rare earth ions have interested researchers [1,3]. Alkaline earth silicates are useful luminescent hosts since they have stable crystal structure, high physical and chemical stability. They have also excellent weather resistance and exhibit blue to green emission under excitation with ultraviolet rays and/or visible light rays [6,7]. There are many investigations on rare earth ion activation of these hosts [8,9]. Hase has suggested that the main phase Sr2MgSi2O7 can potentially act as an
appropriate support for such purposes [2,4].
Generally, the afterglow and the colour spectrum are related to the treatment of such hosts with rare earth dopants.
In the present study the attainment of a pure host using different preparation methods was studied.
EXPERIMENTAL
Materials
The starting materials were of ANALAR grade and were as follows: SiO2, SrCO3, 4MgCO3 . Mg(OH)2 .
5H2O, Sr (NO3)2 , C2H2O4 . 2H2O, and twice distilled
water.
Procedure
Two different procedures for obtaining the main phase were carried out namely the dry and the wet techniques.
In the dry method the starting materials were milled for around 6 hours using a fast mill and maintained for further processing. In the wet method, Sr (NO3)2 and
C2H2O4 . 2H2O were seperately dissolved in distilled
water. They were then added together upon which a solid phase was instantaneously precipitated within the reaction media. The precipitate was seperated from the aqueous phase purified and dried in an oven. The resulting powder was fast milled for approximately 6 hours and maintained for further treatments. The resulting powders from the dry and wet methods were further homogenised by the aid of a vibration mixer.
Characterization
A scanning electron microscope (ie SEM-Cambridge Stereo Scan 360)was used to study the morphology of the main host Sr2MgSiO2O7. An X-ray diffraction instrument
(ie XRD - Siemens D-500) was also used inorderto study the presence of different phases in the main structure.
RESULTS AND DISCUSSION
Wet Method
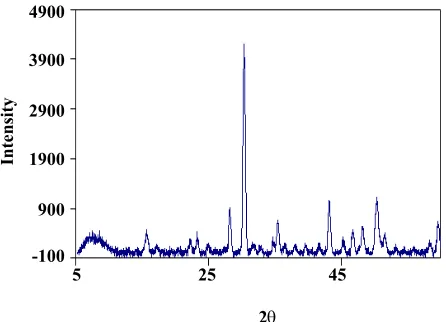
XRD spectra of host phase of sintered samples at different temperatures (i.e. 1220, 1300 and 1350oC) are
given in Fig. 1.
Based on the XRD reference cards (15-16JCPDS-1CDD) for host phase Sr2MgSi2O7 and
(10-75JPCDS-ICDD) for the impurity phase MgSr3Si2O8 the maximum
observed intensity for the impurity phase is at d=2.734
±
0.012 Ao. It is seen that by increasing the temperaturefrom 1220 oC to 1350 oC, the impurity disappeared from
the host phase. The SEM data shown in Fig. 2 gives secondary and backscattering photos of the same location in the host phase.
For the firing temperature of 1350 oC the
backs-cattering photos of SEM show that there exist only one homogeneous layer, evident of the existence of only one phase, (ie the host phase) in the system confirming the XRD data. In this way therefore it is possible to remove impurities from the host phase giving a pure host phase.
Dry Method
As it is discussed somewhere else [5] Similar XRD spectra for samples obtained from the dry method sintered at different temperatures are also given in Fig. 1. The maximum intensity for the impurity phase being again at d= 2.734
±
0.003 Ao for the dry method. Againincreasing the temperature to 1350 oC has made the
impurity to vanish, the SEM photos shown in Fig. 3 once more confirms the XRD data.
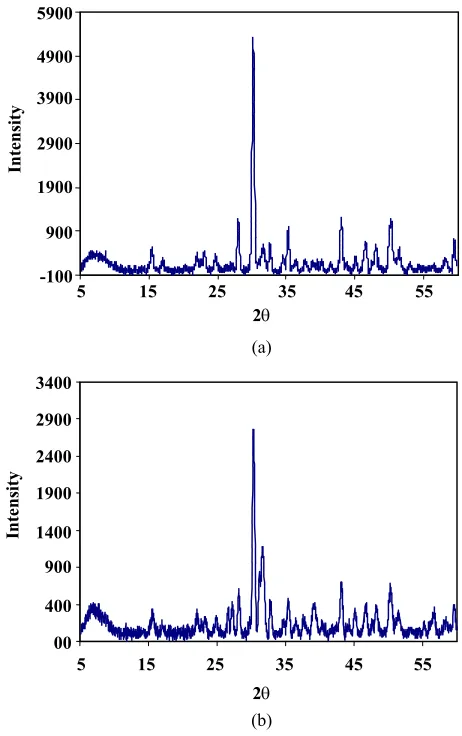
Comparison of the wet and dry methods
Comparing the results for the two methods show that the quantity of impurity obtained in the dry method is less than that obtained in the wet method. This is evident from their peak intensity I=500 at d=2.733 for the dry compared to I=800 at d=2.746 for the wet method both at 1220oC firing temperature as shown in
Fig. 4.
Fig. 1-1-a: X-Ray Diffraction profiles of host phase in wet method at 1220 oC.
Fig. 1-1-b: X-Ray Diffraction profiles of host phase in dry method at 1220 oC.
Fig. 1-2-a: X-Ray Diffraction profiles of host phase in wet method at 1300 oC.
Fig. 1-2-b: X-Ray Diffraction profiles of host phase in dry method at 1300 oC.
Fig. 1-3-a: X-Ray Diffraction profiles of host phase in wet method at 1350 oC.
Fig. 1-3-b: X-Ray Diffraction profiles of host phase in dry method at 1350 oC.
5900
4900
3900
2900
1900
900
-100
5 25 45
Inte
nsity
2θ
5 25 45 3400
2900
2400
1900
1400
900
400
-100
Inte
nsity
2θ
5 25 45 4900
3900
2900
1900
900
-100
Inte
nsity
2θ
5 25 45 5900
4900
3900
2900
1900
900
-100
Inte
nsity
2θ
5 25 45 6900
5900 4900 3900
2900 1900
900
-100
Inte
nsity
2θ
5 25 45 4400
3900 3400 2900 2400 1900 1400 900 400 -100
Inte
nsity
Fig. 2: Secondary and Back scattering Scanning Electron Micrograph of host phase in the wet method (a) 1220 °C (b) 1350 °C.
Fig. 3: Secondary and Back scattering Scanning Electron Micrograph of host phase in the dry method (a) 1220 °C (b) 1350 °C.
(a-1) Secondary
(a-2) Backscattered
(b-1) Secondary
(b-2) Backscattered
(a-1) Secondary
(a-2) Backscattered
(b-1) Secondary
Fig. 4: X-Ray Diffraction profiles of host phase in 1220 ºC (a) wet method (b) dry method.
Fig. 5: X-Ray Intensity as a function of temperature.
intensity of the impurity at three relevant temperatures for the wet and dry methods.
In the wet method, an initial high intensity at the lower temperature is decreased sharply by increasing the temperature to 1300oC (zone (i) in Fig. 5). Further
increases in temperature however has little effect on the intensity of the impurity. In other words there exists a temperature beyond which the amount of impurity in the host phase will not be affected (i.e. zone (iii) in Fig. 5). In the dry method, there is an initial lower intensity of impurity compared to the wet method. This intensity decreases less steeply with increasing temperature up to a temperature where the intensity of the impurity from both the wet and dry method will be identical (i.e. zone (ii) in Fig. 5). Further increases in temperature for the dry method however will increase the amount of impurity (i.e. zone (iii) in Fig. 5). This means that there exist a temperature beyond which the amount of impurity begins to accumulate in the host phase.
Comparison of the two methods in regions below 1300 oC shows two separate regions in zone (i), the dry
method has a relative advantage giving less impurity. In zone (ii) the wet method gains this relative advantage. Between these two zone (i.e. zone (i) and zone (ii)) there would be an unique temperature (say the balance temperature) at which there would be little difference between the two methods since the same quantity of impurity will be made by both methods. Beyond 1300oC
(i.e. zone (iii) in Fig. 5) there would be an increasing advantage in the wet method.
CONCLUSION
The effect of temperature on the formation of the main phase (i.e. Sr2MgSi2O7) of a phosphorescent
compound (i.e. Sr2MgSi2O7: Eu.Dy) were studied. Wet
and the dry method was used, both leading to the same solid host phase. XRD and SEM studies were carried out to obtain the relative advantages of the two methods. These studies showed that for the wet method there exists a temperature beyond which the amount of impurity remains constant. For the dry method there also exists a temperature beyond which the amount of impurity increases. There also exists a temperature (i.e. the balance temperature) at which both the wet and the dry methods give the same quantity of impurity. It could be concluded that below the balance temperature it may be better
to
Inte
nsity
Zone iii Zone
ii
Intensity wet method Intensity dry method
1240 1260 1280 1300 1320 1340 1360
T (°C) 900 800 700 600 500 400 300 200 100 0
5 15 25 35 45 55
5900 4900 3900 2900 1900 900 -100 Inte nsity 2θ (a)
make use of the dry method, however above the balance temperature preferential use of the wet method would be advantageous.
Acknowledgment
All characterizations were carried out at the Iranian Institute for Research on Materials and Energy for which special thanks are due.
Received : 1st November 2004 ; Accepted : 22th February 2005
REFERENCES
[1] Thomas, L., Barry and et al., US patent, No. 3, 544, 482 (1970).
[2] Ranajit, US patent, No. 3, 676, 361 (1979). [3] Hase, et al, US patent, No. 5, 950, 915 (1999). [4] Lin, Y.,Tang , Z., Zhang, Z., et al., Materials Science
and Engineering B, 86, 79 (2001).
[5] Sabbagh Alvani A. A., Moztarzadeh F., and Sarabi A. A., European Powder Diffraction Conference IX, Prague, Czech Republic, Sep. (2004).
[6] Blasse,G. and Wanamaker,W. L.,et al., Fluorescence of Eu+2 activated silicates, Philips Res. Repts, 23, 189
(1968).
[7] Yamazaki, K., Nakabayashi, H., Kotera, Y. and Ueno, A., Fluorescence of Eu+2 activated binary alkaline
earth silicates, J. Electrochem. Soc., 133, 657 (1986). [8] Sabbagh Alvani A. A., Moztarzadeh F., Sarabi A. A.,
Effects of dopant concentrations on phosphore-scence properties of Eu/Dy doped Sr3MgSi2O8,
J. Luminescence, 114, 131 (2005).
[9] Sabbagh Alvani, A. A., Moztarzadeh, F., Sarabi, A. A., Preparation and properties of long afterglow in alkaline earth silicate phosphors co-doped by Eu2O3