Plasma-Wall Interaction Study towards the Steady State Operation
Mizuki SAKAMOTO, Yuta HIGASHIZONO, Hideki ZUSHI, Kazuo NAKAMURA,
Kazuaki HANADA, Hiroshi IDEI, Makoto HASEGAWA, Younosuke NAKASHIMA
1),
Masayuki TOKITANI
2), Mitsutaka MIYAMOTO
3), Kazutoshi TOKUNAGA, Shoji KAWASAKI,
Hisatoshi NAKASHIMA, Tadashi FUJIWARA, Aki HIGASHIJIMA, Naoaki YOSHIDA
and Kohnosuke SATO
Research Institute for Applied Mechanics, Kyushu University, 6-1 Kasuga-koen, Kasuga, Fukuoka 816-8580, Japan
1)Plasma Research Center, Tsukuba University, Ibaraki 305-8577, Japan
2)National Institute for Fusion Science, 322-6 Oroshi-cho, Toki, Gifu 509-5292, Japan
3)Department of Material Science, Shimane University, Matsue, Shimane 690-8504, Japan
(Received 21 December 2009/Accepted 29 March 2010)
Various phenomena of plasma-wall interactions during long duration discharges in TRIAM-1M are inves-tigated from macroscopic and microscopic viewpoints. It is found that the density dependence of the hydrogen neutral flux decay length is not very sensitive to the density (i.e. ¯n−0.2
e ). Neutral transport through the scrape-off layer is important for structural formation of hydrogen recycling. The hydrogen retention in the co-deposited layer, which was obtained using a material probe during long duration discharges, is consistent with the global wall pumping rate estimated from particle balance analysis. The wall temperature and co-deposition play im-portant roles on hydrogen re-emission and hydrogen absorption, respectively. Oxygen impurities should affect the erosion and deposition properties of the plasma-facing wall as well as the hydrogen retention property of the co-deposited layer. The co-deposition of hydrogen with molybdenum and the oxygen impurities both play important roles in the hydrogen recycling.
c
2010 The Japan Society of Plasma Science and Nuclear Fusion Research
Keywords: plasma-wall interaction, steady state operation, tokamak, hydrogen recycling, co-deposition DOI: 10.1585/pfr.5.S2009
1. Inroduction
Plasma-wall interaction (PWI) issues are strongly re-lated to plasma performance and stable operation, and are especially critical for a steady state operation (SSO) of fu-sion plasma [1–3]. PWI phenomena contain processes over a wide range of time and length scales. The time scale characteristics of PWI extend from 10 ps (radiation dam-age) to≤ms (hydrogen diffusion in material), order of 10’s seconds (recycling variation) and order of 102-103seconds (wall saturation) up to order of 106(life time of plasma-facing components). On the other hand, the characteris-tics of the PWI length scale range from the nm order (mi-crostructure) to tens of m order (global particle balance) withμm (dust) and cm (hot spot) orders in between. There-fore, PWI phenomena must be comprehensively investi-gated from multiscale viewpoints because the scale length phenomena are interrelated.
In TRIAM-1M, which has SSO capability, plasma-wall interaction experiments have been carried out ex-tensively from microscopic and macroscopic viewpoints [4–17]. In this paper, various phenomena of PWI are in-vestigated focusing on their length scales, which are clas-sified according to the length from the order of a diameter of the torus to that of the microstructure of the deposits on
author’s e-mail: [email protected]
the wall.
2. Experimental Setup
TRIAM-1M is a superconducting tokamak. Sixteen superconducting toroidal field coils composed of Nb3Sn were installed. The toroidal magnetic field was up to 8 T and in the steady state. The poloidal field coils of Cu were mounted on a vacuum vessel with a D-shaped cross-section, a horizontal length of 0.26 m, and the ver-tical length of 0.38 m. The major radius of the center of the vacuum vessel was 0.84 m. The entire machine was installed inside a shaped vacuum vessel (i.e. a bell-jar) for thermal insulation. Extension ports connected the plasma vacuum vessel and the bell-jar.
The plasma-facing components were made of highZ
materials: three fixed poloidal limiters (PLs) and divertor plates were made of molybdenum, and the vacuum ves-sel (i.e. main chamber) was stainless steel as shown in Fig. 1. A movable limiter (ML) with a front edge made of molybdenum was installed in the same section as the fixed poloidal limiter and the pumping port. The ML was ther-mally insulated from the main chamber, and had a good cooling capability. A lowZ material coating was not ap-plied. Wall conditioning was performed just prior to the
c
2010 The Japan Society of Plasma
Plasma and Fusion Research: Regular Articles Volume 5, S2009 (2010)
Fig. 1 Cross-sectional view of the main chamber at the section of the movable limiter and the fixed poloidal limiter.
experimental campaign. The extension ports were initially heated to 100◦C for∼2 days, and then electron cyclotron resonance discharge cleaning for∼2 days was carried out to clean the plasma-facing components [18, 19]. To avoid a thermal load to the cryogenic system, the plasma vac-uum vessel was not heated. The main chamber was evacu-ated using a turbo-molecular-pump with an effective pump speed of 550 l s−1.
The plasma current was initiated by ohmic heating (τ ∼0.2 s), and then sustained by a lower hybrid current drive (LHCD) with a frequency of 2.45 GHz or 8.2 GHz. The hydrogen gas fueling was controlled by feedback to match the Hα intensity at the central chord with a refer-ence signal. It should be noted that all the results reported herein were obtained from hydrogen discharges with a lim-iter configuration.
3. Experimental Results and
Discus-sion
3.1
Hydrogen recycling
In TRIAM-1M, the recycling coefficient (R) was eval-uated by using a particle balance equation inside the plasma [6]. The value ofRincreased with the discharge duration and approached to unity. In the first one minute, there existed two time constants of the increase inR: one was a few s and the other was∼30 s. These time constants may relate to implantation of hydrogen into the wall and diffusion of hydrogen in the wall, respectively. It was also found the third time constant for the variation of hydrogen recycling that was∼30 min or longer (i.e. nearly infinity). The third time constant is explained in the section 3.3.
3.2
Neutral behavior
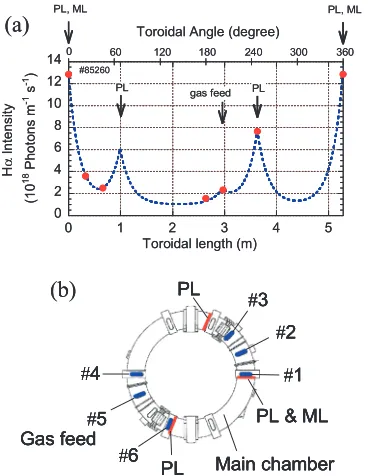
Figure 2 (a) shows a toroidal profile of the Hα inten-sity (IHα), which was measured at 120 s after plasma initi-ation. The plasma was sustained by 8.2 GHz LHCD with
Fig. 2 (a) Toroidal profile of Hαline intensity and (b) top view of the main chamber. Three sets of the poloidal limiters (PL) are installed. Movable limiter (ML) is installed in section #1. Hydrogen gas is injected under the torus in section #5. Hαintensity measured in sections #1-#6.
a power of 40 kW. The line averaged electron density (¯ne) was∼0.6×10¹⁹m−3. It was found thatIHαat the PL and the ML became rather high. As shown by the broken line in Fig. 2 (a), the profile is well reproduced according to the following fitting equation:
IHα(x)=Pmc+ 4
i=1
Piexp
− |x−xi| λ
, (1)
wherexis the toroidal length. Pmcis the contribution of main chamber recycling, and is assumed to be homoge-neous in the toroidal direction. The second term in the right-hand side represents the contribution of the limiters and gas feed. λis the decay length ofIHαfrom the source of hydrogen neutrals, and denotes the mean-free path of hydrogen neutral flux in the torus.Pmc,Piandλare deter-mined as the profile of eq. (1) agrees with the experimental data that are shown by red closed circles in Fig. 2 (a). In the case of Fig. 2 (a),λis 0.21 m. The contribution ratio of the main chamber, the ML&PL section, other PLs, and gas feed toIHα were 34%, 32%, 31%, and 3%, respectively. It was found that hydrogen recycling in the main cham-ber and the limiters dominated, and the contribution of the gas feed was negligible because the recycling ratio became higher as the discharge duration increased [6].
Figure 3 (a) shows the dependence ofλ on ¯ne. The value ofλ gradually decreased as ¯ne increased (i.e. λ ∝ ¯
n−0.2
DE-Fig. 3 (a) Density dependence of the decay length of the Hα in-tensity estimated using the equation (1). Closed triangles and squares are decay lengths estimated by DEGAS sim-ulation using cylindrical models (b) and (c), respectively.
GAS simulation [20] using a cylindrical model, model-A in Fig. 3 (b), where the neutral source is located on the wall. Typical profiles of the plasma density and temperature in 2.45 GHz LHCD were used for the DEGAS simulation. Temperature of the scrape offlayer (SOL) is assumed to be 30 eV in each density in Fig. 3 (a). One candidate of a reason of the weak dependence ofλon ¯nemay be that the mean-free path of the neutral hydrogen becomes substan-tially extended due to increase in charge exchange neutrals with higher energy than Frank-Condon energy as the den-sity increases.
In contrast, another model, model-B in Fig. 3 (c), where the ring limiter is set around the plasma did not reproduce the density dependence of λ as indicated in Fig. 3 (a). In model-B, the ring limiter blocked neutral transport through SOL. In the case of TRIAM-1M, al-though the recycling neutral flux was mainly due to the limiters as shown in Fig. 2 (a), a sufficient space existed be-tween the plasma and the limiter (Fig. 1). Hence, the neu-tral particles can be transported through the space during recycling, indicating that the transport of neutrals through SOL and the plasma periphery plays an important role in structure formation of hydrogen recycling.
3.3
Global particle balance
Hydrogen recycling in long duration discharges has been studied using global particle balance analysis [6, 9, 21–24]. The global particle balance in the main chamber can be written as:
dNH0
dt +
dNHp
dt =Γfuel−Γpump−Γwall, (2)
whereN0His the total number of neutral hydrogen atoms
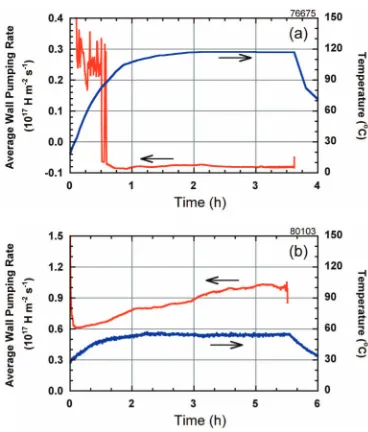
Fig. 4 Time evolution of the average wall pumping rate and wall temperature in ultra-long duration discharges (a) with and (b) without a movable limiter. Plasma density is deduced to be∼1×10¹⁸m−3for both discharges. RF power is∼7 kW and∼6 kW for the discharges of (a) and (b), respec-tively.
in the chamber. NHp is the total number of hydrogen ions in the plasma.Γfuelis the fueling rate,Γpumpis the pump-ing rate by the external pump-unit, andΓwallis the net wall pumping rate. Under steady state conditions,Γwallcan sim-ply be obtained by the balance betweenΓfuel and Γpump because the left-hand side becomes zero. Figure 4 shows the time evolution of the average wall pumping rate and the wall temperature for two types of long duration dis-charges. The major difference between discharges was the wall temperature. In the discharge of Fig. 4 (a), the ML was not employed, and the wall temperature increased partly up to 120◦C due to the heat load from the plasma. On the other hand, in the discharge of Fig. 4 (b), the increase in the wall temperature was suppressed to less than 60◦C us-ing the ML. Calorimetry measurements revealed that ML deals with 34% of the entire heat load. The wall tempera-ture was measured at a back side of the main chamber us-ing thermocouples. It should be noted that the temperature distribution of the main chamber ranged from room tem-perature to the maximum value shown in Fig. 4. This inho-mogeneous temperature distribution is attributed to geom-etry of the cooling water pipes, which are welded on the back side of the main chamber, as well as heat load distri-bution from the plasma. The maximum temperature was measured at a bellows part of the main chamber that was not directly cooled.
parti-Plasma and Fusion Research: Regular Articles Volume 5, S2009 (2010) cle source during discharge. The change of the wall’s role
from a particle sink to source is called “wall saturation.” Aftert∼17 min a process of fueling and no fueling was re-peated to keep the Hαintensity constant by feedback. This seems to mean that the wall approached the global satu-ration although the average wall pumping rate was almost constant before the global wall saturation occurred. It is noted that the wall saturation does not always mean the whole wall cannot absorb the hydrogen. The wall pump-ing rate means an integral of a balance between a hydro-gen absorption rate (Γab) and a re-emission rate (Γre) and is written as
Γwall=
S
Γab−Γreda, (3)
whereS is a whole wall surface. The wall can locally ab-sorb hydrogen even though the wall saturation occurs glob-ally. In the case of Fig. 4 (a), the global wall saturation seems to be attributed to the increase in the re-emission of hydrogen from the wall due to the increase in the wall tem-perature. Due to the increase in the re-emission, the Hα in-tensity slowly increased with the time constant of∼1000 s with no external fueling aftert∼30 min.
In contrast, as shown in Fig. 4 (b), the wall contin-ued to absorb hydrogen until the end of the discharge (t∼5 h 16 min) when the ML was inserted into the plasma edge. In this discharge, the average wall pumping rate was ∼8.6×10¹⁶H m−2s−1, which is 3.6 times higher than that in Fig. 4 (a). This means that the hydrogen re-emission from the wall is suppressed due to a smaller temperature increase observed in Fig. 4 (b). As discussed in the sub-sequent section, this continuous wall pumping should be attributed to the co-deposition of hydrogen with Mo sput-tered from the divertor plates.
3.4
Impurity behavior
As mentioned in the previous section, the co-deposition of hydrogen with molybdenum may play an im-portant role on the continuous wall pumping in a long du-ration discharge. In order to study the properties of erosion and deposition of plasma-facing materials, a real time, in situ measurement system for erosion and deposition has been developed in TRIAM-1M [17]. This system is based on light interference on a thin semi-transparent layer of redeposited material on the substrate [25]. A 4 mm thick sapphire window was used as a substrate, which was also used for Thomson scattering measurement. The window was about 75 mm from the last closed flux surface of the plasma that was at the center of the poloidal limiter. A fiber optic bundle, which was composed of 450 optic fibers with a 100μm diameter, was attached to the air side of the win-dow. The optic fibers were mixed statistically. The fiber optic bundle was pushed on the window surface by spring action to avoid a gap between the bundle and window due to vibrations during the plasma production. Half of the optic fibers were used to illuminate the substrate with laser
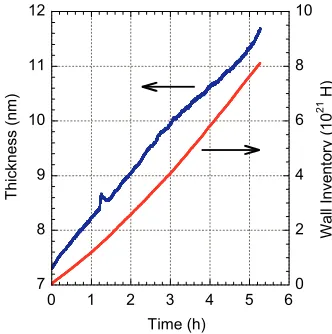
Fig. 5 Time evolution of deposition layer growth for Mo atoms sputtered on the divertor plate and the wall inventory.
light (λ∼635 nm), while the other half guided the reflected light back to a photodiode. In order to avoid plasma light, an interference filter was mounted in front of the photodi-ode. The intensity of the laser light was monitored by the other photodiode.
Figure 5 shows the time evolution of growth of the deposited layer and the wall inventory in the 5-h discharge shown in Fig. 4 (b). The wall inventory was obtained by temporal integration of the wall pumping rate shown in Fig. 4 (b). The average growth rate of the deposited layer was∼2.3×10⁻⁴nm s−1, i.e.∼1.5×10¹⁶Mo m−2s−1. The wall inventory reached∼8×10²¹H. Both the wall inven-tory and growth of the deposition layer indicated a sim-ilar tendency. Although the spatial deposition profile on the plasma-facing component is necessary for quantitative analysis, the monotonic increase of the deposited layer suggests that continuous wall pumping is attributed to the co-deposition of hydrogen with sputtered Mo atoms.
Fig. 6 (a) Mo deposition pattern on the sapphire window after the last experimental campaign in 2005. (b) Diagram of the angular distribution of sputtered Mo atoms from the divertor plate superimposed on the cross-section of the vacuum vessel.
corresponds to the number of molybdenum atoms capable of reaching the wall through the SOL plasma. Because the molybdenum atoms, which reach the upper part of the win-dow, must pass through a higher density and higher tem-perature region and its pass length becomes longer, fewer molybdenum atoms can reach the upper part of the win-dow. This may be the reason for the up-down asymmetry of the deposition pattern. As for the toroidal direction, the deposition pattern was weighted toward the ion drift side, suggesting anisotropic sputtering in the toroidal direction.
The net erosion and deposition rate on the window de-pended on the discharge conditions, and ranged between −2×10⁻³nm s−1 to 2×10⁻³nm s−1for long duration dis-charges (0.1×10¹⁹m−3 ≤ n¯
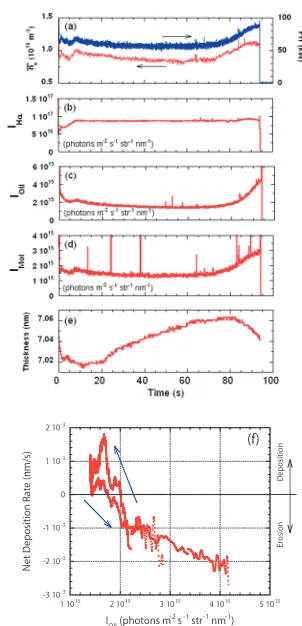
e ≤1×10¹⁹m−3). The posi-tive and negaposi-tive signs indicate deposition and erosion, re-spectively. Figure 7 shows a typical result in a high power and high density discharge in 8.2 GHz LHCD. In the lat-ter phase of the discharge, the plasma density increased due to enhanced PWI, although the gas feed was termi-nated. The net RF power simultaneously increased because the RF coupling with plasma improved due to the increase in the SOL density. In addition, the reflected power de-creased. The OII line intensity and MoI line intensity also increased during the latter phase, but the Hαline intensity remained constant. This suggests that the number of
sput-Fig. 7 Time evolution of (a) the line average electron density, (b) Hαline intensity, (c) OII line intensity, (d) MoI line intensity, (e) thickness of deposited layer, and (f) deposi-tion rate as a funcdeposi-tion of OII line intensity.
tered molybdenum atoms was increased by oxygen sputter-ing. It was found that the thickness of the deposited layer decreased in earlier and latter phases of the discharge (i.e., erosion phase), but increased in the middle phase of the discharge (i.e., deposition phase), as shown in Fig. 7 (e). Figure 7 (f) shows the deposition rate as a function of OII line intensity, which is considered to be related to oxygen flux. It seems that oxygen impurities affected the erosion and deposition properties, and a critical value exists for the oxygen flux during the transition from deposition to ero-sion, and vice versa. The deposition on the window may be expected to increase due to enhancement of sputtering on the divertor plate but simultaneously sputtering on the window also takes place. In addition, increase in SOL den-sity prevents the transport of the molybdenum sputtered on the divertor plate. In a low density discharge (i.e., low oxy-gen amount), the deposition rate seems to depend on the ratio of molybdenum fluxΓMo to hydrogen fluxΓH, i.e. ΓMo/ΓH[17].
3.5
Material analysis
ex-Plasma and Fusion Research: Regular Articles Volume 5, S2009 (2010)
Table 1 Summary of the results of the material probe experiments and comparison between wall pumping rate,ΓMP
wall, esti-mated by ERD, and global wall pumping rate,ΓGPB
wall, esti-mated by global particle balance analysis.
posed to long duration plasma. Then the following param-eters were analyzed. The chemical composition and thick-ness of a deposited layer were estimated using Rutherford backscattering spectrometry (RBS), whereas the hydrogen concentration retained in the deposited layer was estimated using elastic recoil detection (ERD). The microstructure of the deposits was observed using transmission electron mi-croscopy (TEM).
Table 1 summarizes the results [12–14]. The major el-ement in the deposits was molybdenum. The grain size of the deposits was 1-2 nm or 10-20 nm, but it depended on the setting position of the specimen as well as the plasma condition. It is found that H/Mo of the co-deposits was rather higher than that of Mo bulk. The wall pumping rate, ΓMP
wall, which was estimated from the total amount of hydro-gen retention in the co-deposits on the specimen and the discharge duration, seems to be consistent with the wall pumping rate estimated from the global particle balance ΓGPB
wall using equation (1). Γ MP
wall is the so-called static re-tention because it is estimated after the plasma discharge. On the other hand, ΓwallGPB represents the dynamic reten-tion. Again, co-deposition of hydrogen with molybdenum is recognized as a possible candidate for the continuous wall pumping in long duration discharges.
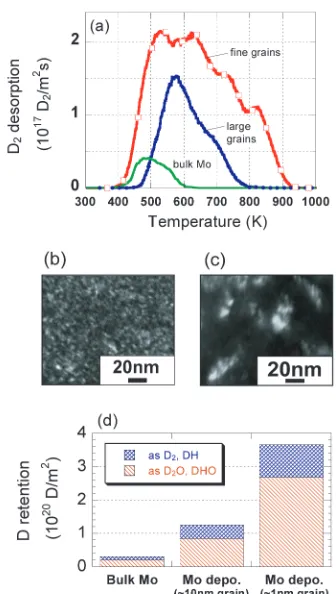
The capability of the deposits to absorb hydrogen is correlated to the structure of the deposits [13]. Figure 8 (a) shows the thermal desorption spectra from the following three types of specimens: (i) Mo bulk, (ii) Mo deposits with fine grains shown in Fig. 8 (b), and (iii) Mo deposits with large grains shown in Fig. 8 (c). D+3 with the energy of 6 keV was implanted into each specimen at room tem-perature and the fluence was 1×10²¹D/m2. Figure 8 (d) shows the deuterium retention of each specimen, which was estimated from the thermal desorption spectra. As the grain size became smaller, the retention capability be-came higher. In deposits with fine grains, numerous ef-fective trapping sites for hydrogen atoms, including grain boundaries or lattice defects, should be present. It should be noted that deposits with fine grains of Fig. 8 (b) were made under a vacuum condition with a little oxygen. As
Fig. 8 Thermal desorption spectra from the molybdenum bulk and molybdenum deposits with fine grains and large grains. Dark field images of the microstructure of (b) fine grains and (c) large grains. (d) Deuterium retention of the three types of specimens.
reported in reference [4], the microstructure and grain size of the deposits are strongly affected by oxygen impurities. The oxygen atoms in the deposits seem to suppress free migration as well as crystallization of the deposited molyb-denum atoms.
4. Conclusion
In TRIAM-1M, PWI extensive experiments were con-ducted and analyzed with an emphasis on the behaviors of hydrogen, molybdenum, and oxygen atoms from macro-scopic and micromacro-scopic viewpoints. It is found that al-though the plasma density changes one order of magni-tude, the change in the hydrogen recycling structure (i.e. toroidal profile of Hαintensity) does not change so much. The characteristic decay length of the hydrogen recycling flux in the toroidal direction depends on ¯n−0.2
dur-ing discharge. However, in the case of a low temperature wall, wall saturation is not observed until an ultra-long dis-charge with a duration of 5 h 16 min. At this time, contin-uous growth of the deposited layer is observed from real time, in situ measurements of erosion and deposition. The microscopic approach using a material probe indicated that the major element in the deposits is molybdenum with a grain size of 1-2 nm or 10-20 nm. The hydrogen absorption rate of the deposits is consistent with the wall pumping rate estimated from particle balance analysis. Continuous wall pumping during a long duration discharge is attributed to the co-deposition of hydrogen with molybdenum. Oxygen impurities should affect the erosion and deposition proper-ties on the wall as well as the hydrogen retention property of the deposited layer. The co-deposition of hydrogen with molybdenum and the oxygen impurity flux play important roles in the hydrogen recycling.
Acknowledgements
This work has been partially performed under the framework of joint-use research in RIAM Kyushu Uni-versity and the bi-directional collaboration organized by NIFS. This work is partially supported by a Grant-in-Aid for Science Research from the Ministry of Education, Cul-ture, Sports, Science and Technology.
[1] M. Shimadaet al., J. Nucl. Mater.337-339, 808 (2005). [2] V. Philipps, Physica ScriptaT123, 24 (2006).
[3] E. Tsitrone, J. Nucl. Mater.363-365, 12 (2007). [4] T. Hiraiet al., J. Nucl. Mater.283-287, 1177 (2000). [5] T. Hiraiet al., J. Nucl. Mater.290-293, 94 (2001). [6] M. Sakamotoet al., Nucl. Fusion42, 165 (2002). [7] M. Sakamotoet al., J. Nucl. Mater.313-316, 519 (2003). [8] Y. Hirookaet al., J. Nucl. Mater.313-316, 588 (2003). [9] M. Sakamotoet al., Nucl. Fusion44, 693 (2004). [10] H. Zushiet al., Nucl. Fusion45, S142 (2005). [11] K. Hanadaet al., Fusion Eng. Des.81, 2257 (2006). [12] M. Miyamotoet al., J. Nucl. Mater.313-316, 82 (2003). [13] M. Miyamotoet al., J. Nucl. Mater.337-339, 436 (2005). [14] M. Tokitani et al, J. Nucl. Mater.367-370, 1487 (2007). [15] M. Ogawaet al., J. Nucl. Mater.363-365, 1364 (2007). [16] R. Bhattacharyayet al., Nucl. Fusion47, 864 (2007). [17] M. Sakamotoet al., J. Nucl. Mater.363-365, 233 (2007). [18] E. Jotaki and S. Itoh, Fusion Eng. Des.36, 447 (1997). [19] K. Hanadaet al., Fusion Eng. Des.54, 79 (2001). [20] D. Heifetz, D. Post, M. Petravicet al., J. Comput. Phys.46,
309 (1982).
[21] E. Tsitrone et al., Plasma Phys. Control. Fusion44, 701 (2002).
[22] T. Loareret al., Nucl. Fusion47, 1112 (2007). [23] T. Nakanoet al., J. Nucl. Mater.363-365, 1315 (2007). [24] T. Nakanoet al., Nucl. Fusion48, 085002 (2008). [25] F. Weschenfelder, P. Wienhold and J. Winter, J. Nucl.