© Universiti Tun Hussein Onn Malaysia Publisher’s Office
IJIE
Journal homepage: http://penerbit.uthm.edu.my/ojs/index.php/ijie
The International
Journal of
Integrated
Engineering
ISSN : 2229-838X e-ISSN : 2600-7916
Desalination of Groundwater Using Marble Filter
Muhammad Fitri Mohd Akhir
1, Noor Aida Saad
1,*, Nor Azazi Zakaria
1, Khong
Ling Xin
2, Ainul Afeeqah Athirah
21River Engineering and Urban Drainage System Research Centre, Engineering Campus,
Universiti Sains Malaysia, 14300 Pulau Pinang, MALAYSIA
2School of Materials and Mineral Resources Engineering, Engineering Campus,
Universiti Sains Malaysia, 14300 Pulau Pinang, MALAYSIA
*Corresponding Author
DOI: https://doi.org/10.30880/ijie.2019.11.01.012
Received 31 Mei 2018; Accepted 21 September 2018; Available online 30 April 2019
1.
Introduction
Groundwater resources are one of the major sources of drinking water and cleaning agent around the world. In European countries, such as Denmark, Austria, Belgium, Hungary, Romania and Iceland, more than 70% of their water supply comes from underground reservoirs [1], [2]. In the United States, groundwater is used to supply potable water for more than 96% of its inhabitants in rural areas [3]. In Asia, groundwater is also widely used for their water supply for example 80% in India’s interior, 80% in the Maldives and more than 60% of water supply in the Philippines and Nepal comes from groundwater sources [3].
On the other hand, groundwater in Malaysia accounts for more than 90% of the country’s water resources and is spatially distributed all over the country [4]. Kura et al. [4] reported that over the last three decades, there has been an increase in freshwater demand due to Malaysia’s great economic and infrastructure development. According to, Manap et al. [5], it is estimated that the groundwater demand in Malaysia has been rising by 63% from 2000 to 2050 particularly as an alternative water sources in urban areas.
However, the presence of salinity is inevitable when the water table in groundwater mixes with seawater. Salinity is defined as the concentration of salts in water or soil. It is classified in 3 forms and causes i.e. primary, secondary and tertiary salinity [6]. Primary salinity is called natural salinity. It is caused by natural processes such as from weathering of rocks and salt accumulation in the rainfall for thousands of years. Therefore, the small amount of salt in soil and water can be transferred to streams, rivers and groundwater. Secondary salinity is called dryland salinity where the accumulation of primary salinity brings salt to the surface through increased groundwater level. The discharging saline from groundwater can saturate the area with saline and leave salt crystals during dry season. This area is called salt
Abstract: The world has changed tremendously in terms of human development, population growth, and climate change. An in-depth study of groundwater treatment is necessary to ensure water crisis such as water scarcity, industrial pollution, natural contamination and high-water demand can be handled in the future. Salinity problem is one of the most vital issues that needs to be taken care of. Instead of using membrane technology as the main filter, marble filter gives more contribution as low cost physical filtration treatment of saline groundwater (5.1±0.1ppt). The marble filter acts as the main filter and has been tested for two media sizes i.e. pebble and sand size. This filtration is free from chemical usage. Desalination results for marble in sand size at flowrate 0.011 l/s and temperature above 29oC shown very impressive results with 97.48% salinity removal. The retention time is
approximately 1 hour 3 minutes. Both marble filter sizes efficiency reduced after 30 minutes of filtration.
scald. The tertiary salinity occurs when saline groundwater is pumped for agriculture. The water is infiltered into the groundwater and the water is pumped back from the tube well for reuse. High salinity can be generated from multiple cycles of reuse.
In this area of study, salinity is formed from primary salinity product. Seawater moves into underground and mixes with fresh groundwater. Based on the water quality standards in Malaysia, the salinity of fresh water is below 0.5ppt. The mixture of seawater and fresh water is called brackish water where its salinity ranges from 0.5 to 35 ppt. Whereas, the level of seawater concentration is above 35 ppt. The closer the location of water table to the sea, the higher the salinity contains in groundwater.
Regarding to the location of the study area taken at Universiti Sains Malaysia, Nibong Tebal, Malaysia, it is 8km far from the coastal line. Tawnie et al. [7] reported that the saline can extend over 10 km from the coastal line. Salinity taken during dry and rainy season was 5.1±0.1 ppt. Referring to the classification of salinity status in (Table. 1), the groundwater is saline and useful for most livestock as in agriculture. However, it cannot be used for domestic use and drinking water. Many plants can endure higher salinity for a short period but cannot survive for a long period [8].
Therefore, to overcome the consequences, there has been much research done on the desalination process. Desalination has been widely used in the Middle East, North America, Europe, Asia, Africa, South America and Australia to fulfill their water demand [9]. Typically, granular filters such as mineral and activated carbon have been used as pre-treatment in the desalination ranging from marginal to brine before continuing the membrane filtration process. The famous technology of electrolysis and membrane filtration such as electrodialysis, microbial electrolysis, reverse osmosis (RO), membrane distillation (MD), forward osmosis (FO), microfiltration (MF) ultrafiltration (UF) and nanofiltration (NF) could not be denied in removing salt [10]-[19], [20]. However, the amount of capital, maintenance and operating costs are very expensive [21]-[23]. The higher the salinity, the higher the membrane maintenance [24]. Therefore, in order to address the cost problem, this research has come out a study of marble according to pebble and sand size as the main filter in removing salinity of brackish groundwater instead of making it as pre-treatment.
Table 1 - Salinity status classification [6]
Salinity Status
Salinity
(ppt) Description
Fresh <0.5 Drinking and all irrigation
Marginal 0.5-1 Most irrigation and adverse effects on ecosystem become apparent
Brackish 1-2 Irrigation certain crops only but useful for most stock Saline 2-10 Useful for most livestock
Highly saline
10-35 Very saline groundwater and limited use for certain livestock
Brine >35 Seawater and some industrial discharge
2.
Theoretical Concept
2.1
Oxidation of Calcium
In electrochemical series, calcium (Ca) is the third highest in contributing oxidation. Based on the nature of high reducing agent properties, Ca oxidizes salt to reduce salinity [25], [26]. For example, iron (II) sulfate (FeSO4) in Eq. (1)
can be oxidized by calcium carbonate (CaCO3) and separate iron (II) from sulfate. Thus, it will diminish and remove
the salinity.
CaCO3 + FeSO4→CaSO4 + FeCO3 (1)
2.2
Retention Time
A good retention time can be managed by adjusting the flow rate and the volume of the filter media as shown in Eq. (2). Each filtration process has optimum retention time to produce sufficient time to remove particles.
V T
F
= (2)
2.3
Volume of Void
The void volume is calculated using the formula in Eq. (3), Eq. (4) and Eq. (5). Column mass, column mass with dry filter media and volume of filter media are taken as the data for void volume.
v T s
V =V −V (3)
s s
s w
M V
G p
= (4)
s
s s w
s
M
p G p
V
= = (5)
where, Vv= void volume, VT= total column volume, Vs= sample volume, Ms= sample mass, Gs= sample specific gravity, ps= sample density, and pw = water density.
3.
Materials and Methods
3.1
Site Description
The site is located at Universiti Sains Malaysia, Engineering Campus, Nibong Tebal, Malaysia. This campus area was an oil palm plantation. Palm trees can still be seen inside the campus and were planted well. In the campus, there is a tube well with a diameter of 6 inches and a depth of 60 meters is used for groundwater studies. In this research study, samples were taken for a depth of only 10 meters.
3.2
Sampling Method
Groundwater was pumped for 3 hours with a 2.5 l/s flowrate to exceed multiple well volume for fresh groundwater [27].
3.3
Monitoring Water Quality
By controlling the valve, the required flowrate can be achieved with exact flowrate and some is nearly to the flowrate. All the column was put with the same flowrate. Therefore, the flowrate can be stabilized according to the required flowrate. There is also a limit level of water in top tank where the flowrate cannot be achieved due to head pressure decreasing. Thus, the level has been dotted to ensure the experiment is run before the water level reaching the limit where the flowrate cannot be achieved. Water sample was taken after the flow rate was stable in each filter. Ysi ProDSS was used to monitor the salinity and the other parameters for water quality. The reading was taken after the value was nearly or exactly the flowrate needed.
3.4
Crush and Sieve
Marble was obtained from ZANTAT Sdn Bhd quarry at Simpang Pulai, Perak, Malaysia. The size of marble was above 30mm with density 2.7 kg/m3. The marble was crushed via jaw crusher and cone crusher. The jaw crusher
produces particle size lower than 20 mm. Meanwhile, the cone crusher can produce particle size lower than 4 mm. Then the procedure was followed by sieving process according to the different sizes that are required using Gilson sieve. The Gilson sieve is done for 3 times in 2 minutes each to prevent particle loss. The marble was placed to cover less than half of the sieve container to prevent excessive particles from blocking smaller particles to pass through the mesh.
3.5
XRF
3.6
Backwashing
Water was pumped or flushed back from outlet to inlet [28]. Granular bed filter requires periodic backwashing to remove particles accumulated in the media. Because of low water pressure, 30 minutes backwash was applied by stirring to produce abrasion to remove trapped particles.
3.7
Experimental setup
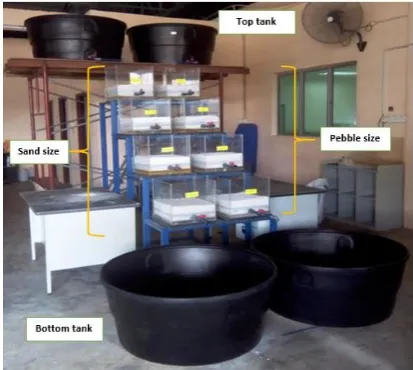
By using the concept of physical treatment, the high purity of calcium carbonate (>97%) from marble is chosen as a filter media. There are 8 square columns based on the size of filter media that differ from the medium grain of pebbles size to the medium grain of sand size as shown in Fig. 1.
The first row of four compartments contains pebbles grain size consisting of medium (10 mm–14 mm), medium-fine (6 mm–10 mm), medium-fine (4 mm–6 mm) and very medium-fine grain (2 mm–4 mm) while second row from four compartments containing sand grain size of very coarse (1 mm–2 mm), coarse (0.6 mm–1 mm), coarse-medium (0.4 mm–0.6 mm) and medium grain (0.3 mm–0.4 mm). Those sizes are based on the Wentworth scale for the particle size reference [29].
Filter was sorted by stairs using the concept of cascade where the flow is generated by gravity. Groundwater is stored in a portable storage tank taken from the tube well and transferred to the top tank. Both marble sizes simultaneously run on the same day. The groundwater is released into the column using gravity. Each square column flowrate needs to be the same and controlled by the valve. The flowrate is adjusted over time (s-1). Time is 30s, 60s,
90s, 120s and 150s per test.
The total volume of filter media was set constant in each filter column with a value of 10.401 liter. The filtered sample is taken in the last column filter as a result of filtration. This result shows the quality of filtration of marble in pebble size and marble in sand size.
Fig. 1 - Marble filter experimental setup
4.
Results and Discussion
XRF was repeated 3 times as shown in Table 2 to ensure the CaCO3 content in marble media was above 97%.
Table 2 - XRF result of CaCO3
Test Compound Weight Percentage (%)
Sample 1 CaCO3 98.32
Sample 2 CaCO3 98.38
Sample 3 CaCO3 97.43
Based on those sizes of marble, preliminary test for the lowest marble particle size can be used as media filter was tested. Below than 0.3 mm made the marble agglomerated and cemented. The marble became impermeable. Thus, 0.3 mm is the size limit to make as media filter.
The efficiency of removal of marble in sand size is very high as membrane filtration. Both marble in pebble size and marble in sand size obtained the highest salinity removal at a flowrate of 0.011 l/s. However, both marble filters efficiency reduced after 30 minutes of filtration. Thus, the total water volume filtered for the highest salinity removal is 19.8 liter for 30 minutes
Fig. 2 - Percentage of salinity removal based on flowrate of marble filter outlet (pebble size)
Fig. 3 - Percentage of salinity removal based on flowrate of marble filter outlet (sand size)
4.1
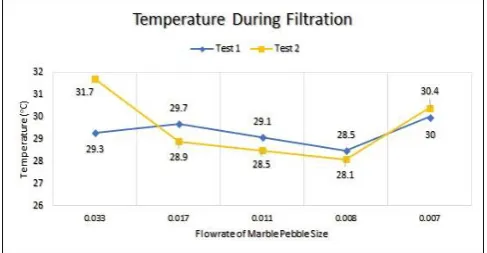
Temperature Influence
Based on the graphs in Fig. 2 and Fig. 3, two tests of marble in pebble size and marble in sand sizes were shown fluctuation graph on salinity removal. By referring to the graph in Fig. 4 and Fig. 5, the percentage of salinity removal was affected by the temperature changes. The declination of temperature was giving impact to the performance of salinity removal. The temperature was different due to the rainy season and dry season. Ahmed et al. [30] has reported that temperature affects the crystalline growth of salt. This is concluded that the ion exchange has been disturbed when the temperature is decrease.
At flowrate 0.011 l/s of marble in sand size in Fig. 3 and Fig. 5, for test 1, salinity removal still had shown highest removal although the temperature was lower than the flowrate 0.017 l/s and 0.007 l/s. Similarly, in test 2, flowrate 0.011 l/s can also maintain performance in removing salinity even though the temperature was lower than the flowrate 0.033 l/s, 0.008 l/s and 0.007 l/s. Marble in pebble size also had shown the same result as 0.011 l/s which the highest in removing salinity. This shown optimum flowrate for this study is 0.011 l/s.
Fig. 5 - Temperature changes in marble filter (sand size)
From the Table 3 and Table 4, pH has gradually decreased. Referring to flowrate and temperature results in Fig. 2, to Fig. 5, there was no correlation in pH reduction. It is thought that the increase in pH may be due to the presence of marble powder that remains among the marble in pebble size and marble in sand size. Marble powder is highly soluble. It can dissolve in the water and increase the pH of water. The repetition of the experiment possibly made the marble filter media slowly dissolved and might increase the pH of water filtered.
Table 3 - pH result in test 1
Sample Flowrate
(l/s)
pH before removal
pH after removal
Pebble 30s 0.033 7.21 7.95
Pebble 60s 0.017 7.16 7.83
Pebble 90s 0.011 7.12 7.75
Pebble 120s 0.008 7.14 7.70
Pebble 150s 0.007 7.07 7.57
Sand 30s 0.033 7.21 8.50
Sand 60s 0.017 7.23 8.31
Sand 90s 0.011 7.19 8.15
Sand 120s 0.008 7.24 7.84
Sand 150s 0.007 7.06 7.26
Table 4 - pH result in test 2
Sample Flowrate
(l/s)
pH after removal
pH after removal
Pebble 30s 0.033 7.11 7.58
Pebble 60s 0.017 7.15 7.55
Pebble 90s 0.011 7.14 7.83
Pebble 120s 0.008 7.19 7.75
Pebble 150s 0.007 7.07 7.57
Sand 30s 0.033 7.12 7.76
Sand 60s 0.017 7.25 7.33
Sand 90s 0.011 7.22 8.02
Sand 120s 0.008 7.22 7.77
The larger the size of the marble, the greater the size of the void volume. Marble in sand size had shown to be better in removing salinity compared to pebble size as referred in Fig. 2 and Fig. 3. Based on Table 6, the pore size of the marble in sand size is very small and capable to trap salt. In contrast to marble in pebble size in Table 5, the pore size is larger than the marble sand size and causes a low potential to trap salt.
Table 5 - Void percentage of marble in pebble size
Particle Size (mm)
Void Volume (m3)
Void Percentage
(%)
10-14 0.0051 49.44
6-10 0.0049 47.30
4-6 0.0048 45.88
2-4 0.0045 43.03
Table 6 - Void percentage of marble in sand size
Particle Size (mm)
Void Volume (m3)
Void Percentage
(%)
1-2 0.0043 40.89
0.6-1 0.0040 38.40
0.4-0.6 0.0037 35.55
0.3-0.4 0.0034 32.35
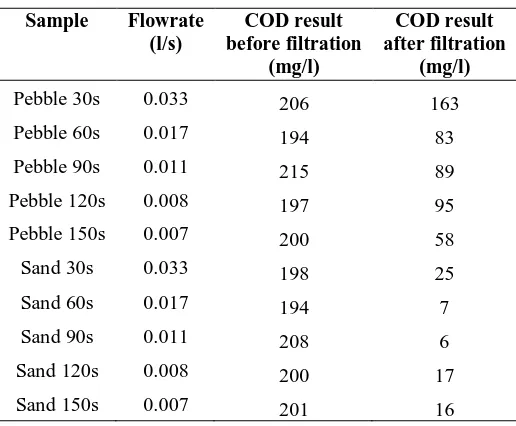
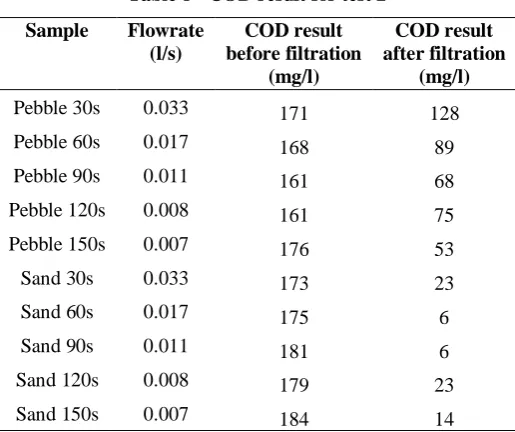
Based on the COD result, it described the capability of marble in trapping salt. In Table 7 and Table 8, marble in sand size had shown a very impressive result of filtration with value 6 mg/l element content in water treated. Meanwhile, marble in pebble size only reached 53 mg/l and 58 mg/l of COD result at the flowrate of 0.007 l/s. Thus, it is found that the marble in pebble size cannot trap salt well either in lower or higher flowrate and shows less efficiency in removing salinity.
Table 7 - COD result for test 1
Sample Flowrate
(l/s)
COD result before filtration
(mg/l)
COD result after filtration
(mg/l)
Pebble 30s 0.033 206 163
Pebble 60s 0.017 194 83
Pebble 90s 0.011 215 89
Pebble 120s 0.008 197 95
Pebble 150s 0.007 200 58
Sand 30s 0.033 198 25
Sand 60s 0.017 194 7
Sand 90s 0.011 208 6
Sand 120s 0.008 200 17
Table 8 - COD result for test 2
Sample Flowrate
(l/s)
COD result before filtration
(mg/l)
COD result after filtration
(mg/l)
Pebble 30s 0.033 171 128
Pebble 60s 0.017 168 89
Pebble 90s 0.011 161 68
Pebble 120s 0.008 161 75
Pebble 150s 0.007 176 53
Sand 30s 0.033 173 23
Sand 60s 0.017 175 6
Sand 90s 0.011 181 6
Sand 120s 0.008 179 23
Sand 150s 0.007 184 14
5.
Summary
In many cases, groundwater provides a secure, adequate, cost-effective, and often more reliable water supply than traditional surface water-based supplies. However, groundwater, as with surface water, is increasing in demand due to human development, population growth, increased dependence on groundwater, and climate change.
It is important to know that once the groundwater resources are contaminated, it is very difficult and costly to restore the resources. Thus, instead of using membrane technology as a main filter, this research is very helpful in improving the low-cost filtration treatment in saline groundwater (5.1-±-0.1ppt) using marble filter without any chemical use.
Marble filter acts as the main filter and was tested for two different sizes of pebble and sand. The desalination results at the flowrate 0.011 l/s had shown very impressive results with 97.48% and 96.3% salinity removal in test 1 and test 2. The highest removal for marble in pebble size is 58.45% and 57.96% at flowrate 0.011 l/s and 0.007 l/s. It has found that the marble in pebble size could not trap salt well and shown less efficiency in removing salinity. COD result for marble in sand size had shown 6 mg/l water element content after treated. Meanwhile, marble in pebble size only can reach 53 mg/l and 58 mg/l. This is because the pore size and void volume of marble in pebble size is larger than the marble in sand size. In addition, higher temperature also gives a better result for salinity removal.
The retention time for both sizes are approximately 1 hour and 3 minutes. Both the efficiency of the marble filters has been reduced after 30 minutes of filtration. Thus, the total water filtered for the highest salinity removal is 19.8 liter for 30 minutes. Temperature has shown a correlation to the removal of salinity. Ion exchange is interrupted when the temperature is decrease.
As a conclusion, marble in sand size filter gives a better result when used as a desalination filter. This filter is highly recommended instead of using membrane technology due to its high removal efficiency, low cost technology and environmentally friendly products.
References
[1] Gudmund, L., and Reitan, E. P. (2008). Annual report. Trondheim: Geological Survey of Norway.
[2] Vyas, S. Godhasara, A. Ram V., Tank, S., and Raval, J. (2018), Physicochemical characteristics of Mundra Taluka of Kachchh District groundwater. International Journal of Current Trends in Science and Technology, 8, 20505-20519.
[3] Sharma, S.K., Petrusevski, B., and Schippers, J. C. (2001). Advance groundwater treatment. Retrived on October, 2018 at http://www.bvsde.paho.org/bvsacd/congreso/iron.pdf
[4] Kura, N. U., Ramli, M. F., Sulaiman, W. N. A., Ibrahim, S., and Aris, A. Z. (2018). An overview of groundwater chemistry studies in Malaysia. Environmental Science and Pollution Research, 25, 7231-7249.
[5] Manap, M. A., Sulaiman, W. N. A., Ramli, M. F., Pradhan, B., and Surip, N. (2013). A knowledge-driven GIS modeling technique for groundwater potential mapping at the upper Langat Basin, Malaysia. Arabian Journal of Geosciences, 6, 1621-1637.
[7] Tawnie, I., Sefie, A., Normi Idris, A., Shamsuddin, M. K. N., and Mohamed, A. (2016), Overview of groundwater contamination in Malaysia. The 12th International Symposium On Southeast Asian Water Environment, pp. 28-30.
[8] Barrett-Lennard, E. G. (2003). The interaction between waterlogging and salinity in higher plants: Causes, consequences and implications. Plant Soil, 253, 35-54.
[9] Sharon, H., and Reddy, K. S. (2015). A review of solar energy driven desalination technologies. Renewable and Sustainable Energy Reviews, 41, 1080-1118.
[10] Pangarkar, B. L., Sane, M. G., and Guddad, M. (2011). Reverse osmosis and membrane distillation for desalination of groundwater: A review. Materials Science, 2011, 1-9.
[11] Touati, K., Alia, E., Zendah, H., Elfil, H., and Hannachi, A. (2018). Sand filters scaling by calcium carbonate precipitation during groundwater reverse osmosis desalination. Desalination, 430, 24-32.
[12] Jamaly, S., Darwish, N. N., Ahmed, I., and Hasan, S. W. (2014). A short review on reverse osmosis pretreatment technologies. Desalination, 354, 30-38.
[13] Ha, T. D., Thi, D., Huyen, T., Hoa, N. Q., Thi, N., and Tinh, H. (2017). Brackish water treatment reasearch in pilot scale using dual-stage nanofiltration for domestic/drinking water supply in Thu Bon River Basin. Journal of Science and Technology of Civil Engineering, 11, 149-155.
[14] Banasiak, L. J., Kruttschnitt, T. W., and Schäfer A. I. (2007), desalination using electrodialysis as a function of voltage and salt concentration. Desalination, 205, 38-46.
[15] Roberts, D. A., Johnston, E. L., and Knott, N. A. (2010). Impacts of desalination plant discharges on the marine environment: A critical review of published studies. Water Research, 44, 5117-5128.
[16] Al-Mamun, A., Ahmad, W., Baawain, M. S., Khadem, M., and Dhar, B. R. (2018). A review of microbial desalination cell technology: Configurations, optimization and applications. Journal of Cleaner Production, 183, 458-480.
[17] Ye, B., Luo, H., Lu, Y., Liu, G., Zhang, R., and Li, X. (2017). improved performance of the microbial electrolysis desalination and chemical-production cell with enlarged anode and high applied voltages. Bioresources Technology, 244, 913-919
[18] Lu, Y. (2017). Formic acid production using a microbial electrolysis desalination and chemical-production cell. Bioresources Technology, 243, 118-125.
[19] Warsinger, D. M., Swaminathan, J., Guillen-Burrieza, E., Arafat, H. A., and Lienhard, V. J. H. (2015). Scaling and fouling in membrane distillation for desalination applications: A review. Desalination, 356, 294-313.
[20] Warsinger, D. M., Tow, E. W., Maswadeh, L. A., Connors, G. B., Swaminathan, J., and. Lienhard, V. J. H. (2018). Inorganic fouling mitigation by salinity cycling in batch reverse osmosis. Water Research, 137, 384-394. [21] Yeo, K. (2010). Cost analysis of membrane bioreactors to reverse osmosis filters. pp 1-9.
[22] Akgul, D., Çakmakci, M., Kayaalp, N., and Koyuncu, I. (2008). Cost analysis of seawater desalination with reverse osmosis in Turkey. Desalination, 220, 123-131.
[23] Park, K., Kim, D. Y., and Yang, D. R. (2017). Cost-based feasibility study and sensitivity analysis of a new draw solution assisted reverse osmosis (Dsaro) process for seawater desalination. Desalination, 422, 182-193.
[24] Tow, E. W. (2018). Comparison of fouling propensity between reverse osmosis, forward osmosis, and membrane distillation. Journal of Membrane Science, 556, 352-364.
[25] Patil, D. S., Chavan, S. M., and Oubagaranadin, J. U. K. (2016). A review of technologies for manganese removal from wastewaters. Journal of Environmental Chemical Engineering, 4, 468-487.
[26] Khatri, N., Tyagi, S., and Rawtani, D. (2017). Recent strategies for the removal of iron from water: A review. Journal of Water Process Engineering, 19, 291-304.
[27] Vail, J. (2013). Sesd operating procedure groundwater sampling. Georgia: Sesdproc-301-R3. [28] Satterfield Zane, P. E. (2005). Filter backwashing. Tech Br, 5, 1-4.
[29] Wentworth, C. K. (1922). A scale of grade and class terms for clastic sediments. Journal of Geology, 30, 377-392. [30] Ben Ahmed, S., Tlili, M., Ben Amor, M., Ben Bacha, H., and Elleuch, B. (2004). Calcium sulphate scale
![Table 1 - Salinity status classification [6]](https://thumb-us.123doks.com/thumbv2/123dok_us/8436542.1699698/2.595.182.415.364.540/table-salinity-status-classification.webp)