© Universiti Tun Hussein Onn Malaysia Publisher’s Office
IJIE
Journal homepage: http://penerbit.uthm.edu.my/ojs/index.php/ijie
The International
Journal of
Integrated
Engineering
Classification of EEG
M
ental
T
asks using
Multi-Objective Flower Pollination Algorithm for Person
Identification
Zaid Abdi Alkareem Alyasseri
1,2,*, Ahamad Tajudin Khader
1, Mohammed Azmi
Al-Betar
3, Joao P. Papa
4, Osama Ahmad Alomari
1, Sharif Naser Makhadmeh
11School of Computer Sciences,
Universiti Sains Malaysia, Pulau Pinang, Malaysia.
2ECE Department-Faculty of Engineering,
University of Kufa, Najaf, Iraq
3Depart. of information technology,
Al-Huson University College, Al-Balqa Applied University, Al-Huson, Irbid, Jordan.
4 Department of Computing,
San Paulo State University, Bauru, Brazil.
*Corresponding Author
DOI: https://doi.org/10.30880/ijie.2018.10.07.010
Received 8 September 2018; Accepted 19 November 2018; Available online 30 November 2018
1. Introduction
Electroencephalogram (EEG) is a graphical recording of brain electrical activity that is recorded from the scalp. This recording represents the voltage fluctuations resulting from ionic current flows within the neurons of the brain (Abdulkader et. al, 2015). Therefore, EEG signals can provide most of the required information about brain activity. EEG signals from the brain are captured using invasive or non-invasive techniques (Abdulkader et. al, 2015; Ramadan &
Abstract: In the modern life, the authentication technique for any system is considered as one of the most important
challenges task which must careful consideration. Therefore, many researchers have developed traditional authentication systems to deal with our digital world. Recently, The Biometric techniques have been successfully provided a high level of authentication, such as fingerprint, face recognition, and voice recognition. In this paper, a new authentication system has been proposed which is based on EEG signals with hybridizing wavelet transform and multi-objective flower pollination algorithm (MOFPA-WT). The main task of MOFPA is to find the optimal WT parameters for EEG signal denoising which can extract unique features form the EEG. The proposed method (MOFPA-WT) tested using a standard EEG database which has five different mental tasks, includes baseline, multiplication, rotation, letter composing, and visual counting. To classify the EEG signals using proposed method four classification methods are applied which are, neural network, decision tree, Naive Bayes, and support vector machine. The performance of the (MOFPA-WT) is evaluated using four criteria: (i) accuracy, (ii) sensitivity, (iii) specificity, (v) false acceptance rate. The experimental results show the (MOFPA-WT) can achieve the highest recognition rates up to 85% using neural network classifier based on visual counting task as well as the EEG_Std
feature obtained the highest accuracy compared with others EEG features based on visual counting task.
Vasilakos, 2017). The main difference between these techniques is that the invasive approach involves the use of electrode arrays implanted inside the brain, such as ECoG BCI for arm movement control (Rao, 2013) . Meanwhile, there are several techniques to record the brain activity can also be captured using different types of signal capturing devices, including EEG for electrical activity from the scalp, MEG for magnetic field fluctuations caused by electrical activity in the brain, and fMRI and fNIR for changes in blood oxygenation level resulting from neural activity (Abdulkader et. al, 2015; Ramadan & Vasilakos, 2017).
In (Berger, 1929), Hans Berger proposed for the first time the use of EEG signals as a non-invasive technique for capturing brain activities. Over the past several decades, researchers have developed Hans's technique to suit multiple applications. For instance, EEG signals have been used in medical applications for prevention, detection diagnosis, rehabilitation and restoration of patient. This technique has also been used for non-medical applications, such as education and self-regulation, neuromarketing and advertisement, neuroergonomics and smart environment, games and entertainment, and learning and education as summarized in (Ramadan & Vasilakos, 2017). Recently, EEG signals have been successfully used as a new biometric technique in security and authentication applications (Kumari & Vaish, 2015; Kumari & Vaish, 2016; Ramadan & Vasilakos, 2017).
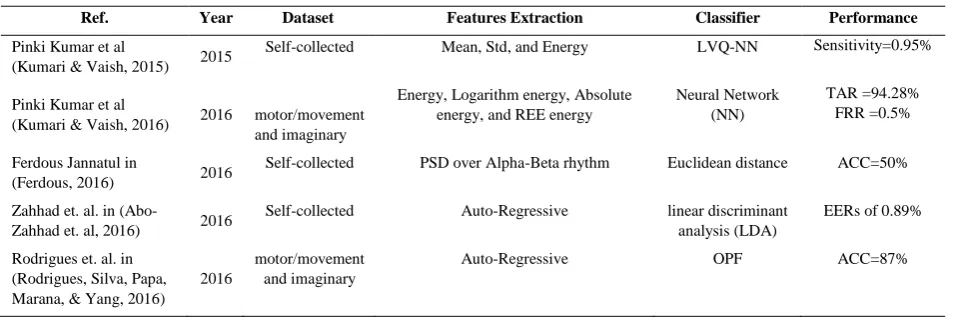
Pinki Kumar et. al. in (Kumari & Vaish, 2015) proposed a user identification system based on EEG signal collected from six users using EMOTIVE EPOC headset which has 14 channels. In feature extraction phase, wavelet transform (WT) technique is proposed to extract the unique features of EEG signal. In addition, three basic statistical measurements extracted from EEG signal includes Mean, Standard deviation, and Energy for each sub-band rhythm. Later, same authors investigated some cognitive tasks for individual identification system (Kumari & Vaish, 2016). They used standard EEG datasets which are motor/movement and imaginary (Schalk et. al, 2004) where they used one channel (i. e. Cz) to get the input EEG signal. In addition, they also used WT to decompose the EEG signal into 5 level to extract four different features from each sub-band which are namely: Energy, Logarithm energy, Absolute energy, and REE energy. Ferdous Jannatul in (Ferdous, 2016) proposed a biometric method using the power spectral density (PSD) estimates of EEG over the combined Alpha-Beta rhythm of the EEG signal. The authors tested the proposed method on using ANT Neuro device for capture the EEG signals from two persons. Finally, the author obtains classification accuracy equal 50%. Zahhad et. al. in (Abo-Zahhad et. al, 2016) introduced a new method to improve the performance of the EEG based biometric authentication using eye blinking EOG signals which are considered as source of artifacts for EEG. Rodrigues et. al. in (Rodrigues et. Al, 2016) used binary flower pollination algorithm (Yang, 2013;Yang et. al, 2014) to obtain the best channel which can provide the highest recognition rate for person identification based on EEG signal. Their work was tested using a standard EEG datatsets which are motor / movement and imaginary. Finally, their work able to obtain the highest recognition rate equal (87%) with reducing the number of EEG channels to half. Table 1 shows the comparative analysis of EEG-based authentication system.
Table 1 – Comparative analysis of EEG-based authentication system.
Ref. Year Dataset Features Extraction Classifier Performance
Pinki Kumar et al
(Kumari & Vaish, 2015) 2015
Self-collected Mean, Std, and Energy LVQ-NN Sensitivity=0.95%
Pinki Kumar et al
(Kumari & Vaish, 2016) 2016 motor/movement and imaginary
Energy, Logarithm energy, Absolute energy, and REE energy
Neural Network (NN)
TAR =94.28% FRR =0.5%
Ferdous Jannatul in
(Ferdous, 2016) 2016
Self-collected PSD over Alpha-Beta rhythm Euclidean distance ACC=50%
Zahhad et. al. in
(Abo-Zahhad et. al, 2016) 2016
Self-collected Auto-Regressive linear discriminant analysis (LDA)
EERs of 0.89%
Rodrigues et. al. in (Rodrigues, Silva, Papa, Marana, & Yang, 2016)
2016
motor/movement and imaginary
Auto-Regressive OPF ACC=87%
false acceptance rate (FAR). It is worth mentioning that the proposed method achieves the highest accuracy result which can be obtained using mental tasks based on visual counting compared with mental tasks.
This paper is organized as follows. Section 2 describes a wavelet transform and the principal of WT for EEG signal denoising. Section 3 provides a background about the flower pollination algorithm and its multi-objective technique. Section 4 describes the proposed system. The results and discussion describe in section 5. Finally, the conclusion and future works describe in section 6.
2.
EEG Signal Denoising using Wavelet Transform
Wavelet Transform (WT) is a powerful and common tool for time-frequency domain signal representation. WT has successfully applied for signal compression, feature extraction and selection, and others (Alyasseri et. al, 2017a; Alyasseri et. al, 2017b; Alyasseri et. al, 2017c; Alyasseri et. al, 2018). In general, the WT can be classified into two types: discrete wavelet transform (DWT) and continuous wavelet transform (CWT). In the recent few years, the WT has been extensively used with non-stationary signals, such as ECG and EEG because the WT has shown powerful outcomes in removing several EEG artifact noises and extracting the EEG features (Alyasseri et. al, 2017). In this paper, the DWT has been used to decompose the input EEG signal to extract unique features from each EEG sub-bands (i.e., high gamma, gamma, alpha, beta, theta, and delta). One of the popular methods for DWT is proposed in (Donoho & Johnstone, 1994) and so-called Donoho’s approach which extracted as follows:
𝐶(𝑎, 𝑏) = ∑ 𝑥(𝑛)𝑔
𝑗,
𝑘(𝑛) (1)
𝑛∈𝑍where C(a,b) denotes the wavelet dynamic coefficients, a =2-j , b = k2-j , j ∈ Z, k ∈ Z; a is the size of the time scale, b is
the translation, x(n) is the input EEG signal, and gj,k(n) = 2 j/2 g(2jn-k) is the DWT.
The task of DWT is to decompose the input signal using different coefficients levels to correct the high frequency of the input signal. The denoising process involves three phases:
1- EEG signal decomposition, the original EEG signal will be divided into five levels, at each level the EEG signal will
be decomposed into two parts namely Approximation coefficients (cA), and Detail coefficients (cD). The cD will process using high-pass filter and cA will be continuously decomposed for next level.
2- Thresholding where for each level a threshold value defined according to the coefficients noise level.
3- Reconstruction, the EEG denoised signal is reconstructed using inverse discrete wavelet transform iDWT.
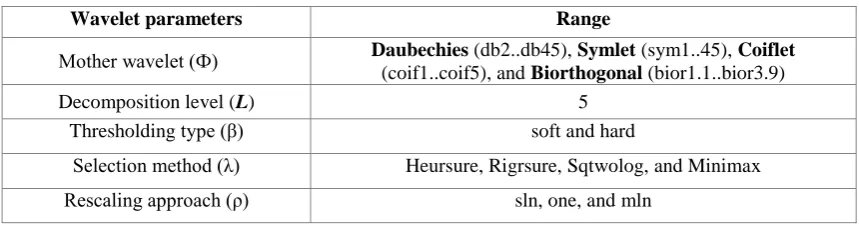
The WT has five parameters where each parameter has different types (See Table 2). The efficiency of noise reduction and unique features extraction relies on the selection of wavelet parameters. The wavelet denoising process has three phases: The first phase is the decomposition of the EEG signal using DWT. This phase involves selecting the appropriate mother wavelet function (Ф) for use in the EEG signal decomposition task. The second wavelet parameter, that is, the decomposition level (L), is also selected in this phasenormally based on the EEG signal and experience. It should be noted that the selection of appreciating parameters of WT (which is one of the main goal of this paper) is recently accomplished using optimization techniques such FPA, β-hill climbing (β-hc), and genetic algorithm (GA) (Alyasseri et. al, 2017; Alyasseri et. al, 2017).
In the second phase, thresholding is applied. The wavelet provides two standard types of thresholding functions (β), namely, hard and soft thresholding (Donoho & Johnstone, 1994). The thresholding type (soft or hard), selection rules (λ), and rescaling methods (ρ) must all be selected. These threshold mechanisms must be applied because the selection will affect the global denoising performance. The thresholding value is generally defined based on the standard deviation (σ) of the noise amplitude. The wavelet parameters (β, λ, and ρ) must be separately applied for each wavelet coefficient (cA and cD) level. In the last phase, the denoised EEG signal is reconstructed by iDWT.
Table 2. Wavelet Parameters Range
Wavelet parameters Range
Mother wavelet (Ф) Daubechies (db2..db45), Symlet (sym1..45), Coiflet (coif1..coif5), and Biorthogonal (bior1.1..bior3.9) Decomposition level (L) 5
Thresholding type (β) soft and hard
3.Background
This section provides a background about the flower pollination algorithm and its multi-objective version. Section 3.1 introduces the flower pollination algorithm. Section 3.2 explains the concepts of the multi-objective optimization.
3.1 Flower Pollination Algorithm
In the recent optimization review, the meta-heuristic algorithms can be classified into evolutionary algorithm (Al-Betar et. al, 2016 ; Alyasseri et. al, 2012), swarm intelligence (Alyasseri et. al, 2018), and trajectory algorithms (Abualigah et. al, 2017;Al-Betar & Azmi, 2017).
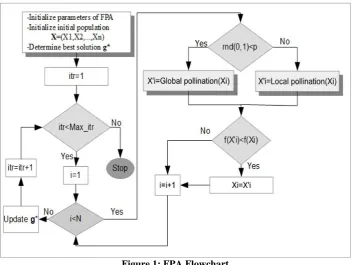
Flower pollination algorithm (FPA) is one of successful swarm-based intelligence which is inspired from the pollination behavior of the flowering plants. FPA is introduced by Yang in 2012 (Yang, 2013;Yang et. al, 2014) and successfully applied for many optimization problems (Abdi et al., 2018; Rodrigues et. al, 2016).
The rules (operators) of FPA are summarized as follows:
Rule (1): Global pollination involves the biotic and cross-pollination where the pollinators are carrying the pollen-based
on Levy flights.
Rule (2): Local pollination involves abiotic and self-pollination.
Rule (3): The reproduction probability can be considered as the flower constancy is proportional to the similarity between
any two flowers.
Rule (4): The switch probability p∈ [0; 1] can be controlled between local pollination and global pollination Due to some external factors such as wind, local pollination will be a significant fraction p in the overall pollination activities. Figure 1 shows the flowchart of flower pollination algorithm.
Figure 1: FPA Flowchart
3.2 Multi-objective optimization
This section describes a briefly introduction about multi-objective optimization technique. In general, the multi-objective optimization refers to solve any optimization problem using more than one objective function (Yang et. al, 2014). The multi-objective optimization problem for n objectives functions can be formulated as follows:
𝑀𝑖𝑚𝑖𝑚𝑧𝑒 𝐹(𝑥) = 𝑓1(𝑥), 𝑓2(𝑥), … , 𝑓𝑛(𝑥) (2)
where n refers to number of objective functions.
The FPA has been extended to multi-objective optimization technique by Yang et al. (Yang et al, 2014), while the author adapted multi-objective flower pollination algorithm (MOFPA) for solving engineering optimization problems. MOFPA is implemented according to the weighted sum approach to combine two objectives into a composite one objective function.
4.
Proposed Work
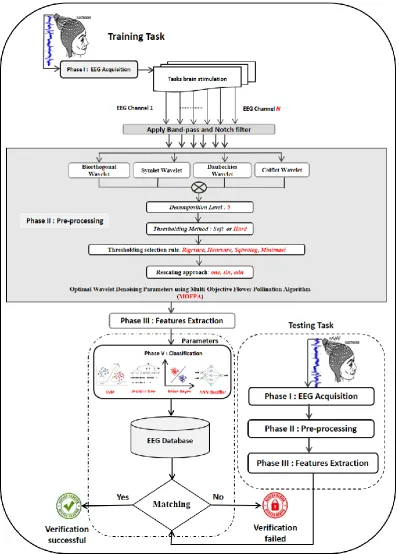
acquisition describes in Section 4.1. Section 4.2 describes Phase 2 Tuning WT parameters by using MOFPA using hybridizing between multi-objective flower pollination algorithm with wavelet transform (MOFPA-WT). Phase 3 Feature extraction from denoised EEG signals presents in Section 4.3. Phase 4 EEG signal classification using neural network classifier presents in Section 4.4. The four phases are flowcharted in Figure 2 and thoroughly are described as follows:
4.1 EEG signal acquisition
In this study, Keirn EEG dataset has been used. More details about this dataset given in Section 5. Where the original EEG signal processed using a Butterworth 5th order filter with range 6-30Hz to achieve the highest signal-to-noise ratio (SNR) and obtained the efficient features extraction.
4.2 EEG signal denoising using MOFPA-WT
In this paper, we propose to estimate the optimum/near-optimum set of parameters concerning the Wavelet Transform for EEG signal denoising as a multi-objective optimization task. In our approach, the set of WT parameters is represented as a vector x=(x1, x2,…,xd) where d is the number of parameters used for the Wavelet Transform (In this paper, d=5). In this context, x1 represents the value of the mother wavelet function parameter, x2 stands for the value of the decomposition level parameter, x3 refers to the thresholding method, x4 represents the value of the thresholding selection rule parameter, and x5 represents the re-scaling approach.
The proposed MOFPA-WT evaluates each solution using the multi-objective framework applying two objective functions: min(MSE) and max(SNR), as formulated below:
𝑭
𝑴𝑶𝑭𝑷𝑨𝑾𝑻= 𝑊
1𝑓
1+ 𝑊
2𝑓
2,
𝑭
𝑴𝑶𝑭𝑷𝑨𝑾𝑻= W
1∗ 𝑚𝑖𝑛(MSE) + W
2∗ 𝑚𝑎𝑥 (SNR)
(3)
where the weight vector is initialized as follows: W1 is rand between (0,1) and W2=1-W1.
The two objective functions which are mean squared error (MSE) and signal-to-noise ratio (SNR) are formulated as below:
𝑀𝑆𝐸 =
1𝑁
∑
(𝑥(𝑖) − 𝑥̂(𝑖))
2 𝑁
𝑖=1
, (4)
And
𝑆𝑁𝑅 = 10 log
10{
∑ [𝑥(𝑖)]2 𝑁 𝑖=1
∑𝑁 [𝑥(𝑖)−𝑥̂(𝑖)]2
𝑖=1
} (5)
where x(i) and 𝑥̂(𝑖)denote the original and denoised EEG signals, respectively. Notice that 𝑥̂(𝑖)is obtained using the Wavelet Transform tuned by the proposed MOFPA-WT.
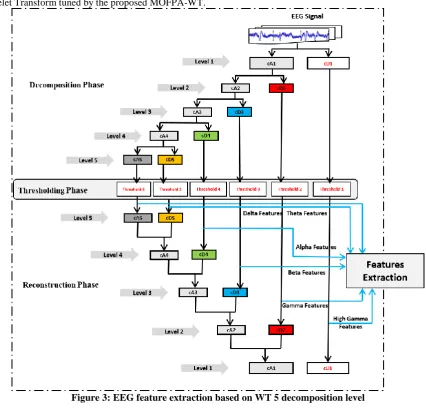
Figure 3: EEG feature extraction based on WT 5 decomposition level
1.EEG signal decomposition using DWT: in this step, the DWT is applied to decompose the noise of the input EEG signals. In such process, one uses the first two optimal parameters (i.e., the mother WT function and the decomposition level) only. Figure 4 shows the DWT procedure for 5 levels, where the EEG signal is partitioned at each level into cA and cD components. The latter is processed using a high-pass filter, while the former is processed using a low-pass filter and is decomposed for the next level.
2.Thresholding: it is applied based on the noise level of the coefficients. In this step, the last three wavelet parameters, namely, the thresholding type, the thresholding selection rules, and the re-scaling methods, must be selected from optimal parameters which are obtained based MOFPA-WT.
3.Reconstruction of the denoised EEG signal by iDWT: we estimate the value of the original EEG signals by
applying iDWT on their denoised version. The reconstruction convolves the EEG data using up sampling, which involves the addition of zeros at the even index elements of the signal.
4.3
Feature Extraction
Extracting efficient features considers a significant phase in any authentication system because it will increase the performance of the proposed system to get good results in the correct classification. Therefore, the main purpose of this phase is to find the unique characteristics features from each sub-band (i.e., high gamma, gamma, alpha, beta, theta, and delta). Figure 3 shows feature extraction-based WT decomposition with five levels. There are several features that can be extracted from the denoised EEG signal. In this paper, we applied we have used four popular measurements of the signal which are mean, standard deviation, entropy, and energy where these features are able to provide a unique pattern among the users. These four features are formulated as follows:
𝐸𝐸𝐺
𝑚𝑒𝑎𝑛=
1
𝑁
∗ ∑ 𝐷
𝑖𝑗, 𝑖 = 1,2,3, … , 𝐿 (6)
𝑁
𝑗=1
𝐸𝐸𝐺
𝑠𝑡𝑑= √
1
𝑁
∗ ∑(𝑥
𝑗− 𝑥̂)
2𝑁
𝑗=1
𝑖 = 1,2,3, … , 𝐿 (7)
𝐸𝐸𝐺
𝐸𝑛𝑒𝑟𝑔𝑦= ∑|𝐷
𝑖𝑗|
2, 𝑖 = 1,2,3, … , 𝐿 (8)
𝑀
𝑗=1
𝐸𝐸𝐺
𝐸𝑛𝑡𝑟𝑜𝑝𝑦= − ∑ 𝑝(𝑥)
log𝑝(𝑥), (9)
4.4 Classification
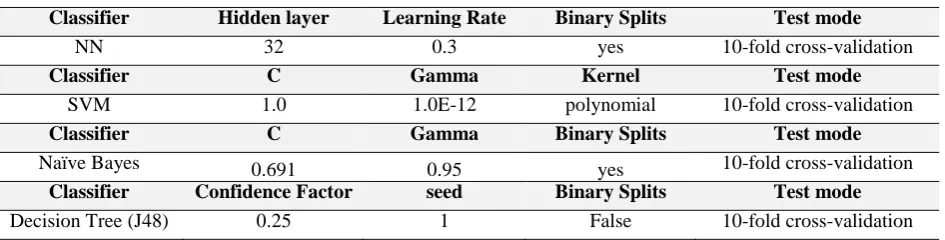
To classify the extracted features from the denoised EEG signal into correct person four popular classifiers have been applied which are: artificial neural network (NN), Naïve Bayes, Decision Tree (J48), and support victor machine (SVM). We used Weka tool for classification task and designed a network with 24-input features vector of each subject (i. e., 4 features * 6 sub-bands). Table shows the classifiers configuration which are used in this paper.
Table 3 –Classifiers configuration.
Classifier Hidden layer Learning Rate Binary Splits Test mode
NN 32 0.3 yes 10-fold cross-validation
Classifier C Gamma Kernel Test mode
SVM 1.0 1.0E-12 polynomial 10-fold cross-validation
Classifier C Gamma Binary Splits Test mode
Naïve Bayes 0.691 0.95 yes 10-fold cross-validation
Classifier Confidence Factor seed Binary Splits Test mode
Decision Tree (J48) 0.25 1 False 10-fold cross-validation
5.
Results and Discussion
samples. Furthermore, this dataset has only six channels which are namely: C3, C4, P3, P4, O3, and O4. The recording tasks of this dataset as follows:
Task 1 Baseline measurements. This task was taken as a baseline for comparison. In this case, subjects were only asked to relax.
Task 2 Complex problem-solving. Subjects were asked to mentally solve non-trivial multiplication problems.
Task 3 Geometric figure rotation. Subjects were presented with an image of a 3-dimensional complex object before being asked to mentally rotate it.
Task 4 Mental letter composition. Subjects had to mentally write a letter to a friend or a family member. Task 5 Visual counting. Subjects were asked to visualize numbers being written on a blackboard sequentially.
With the previous number being erased before a new number is written. Figure 4 shows the distribution of electrodes in Keirn's EEG dataset with six channels
Figure 4: Distribution of electrodes in Keirn's EEG dataset
The EEG dataset which used in this paper has been separated into five different mental tasks based on 10folds cross-validation technique for training and testing for each task. To evaluate the performance of the MOFPA-WT method four measures have been calculated namely, accuracy, sensitivity, specificity, false acceptance rate which can be formulated as follows:
𝐀𝐜𝐜𝐮𝐫𝐚𝐜𝐲 =
TA + TR
TA + FA + TR + FR
∗ 100 (10)
𝑺𝒆𝒏𝒔𝒊𝒕𝒊𝒗𝒊𝒕𝒚(𝑻𝑨𝑹)
=
TA + FR
TA
(11)
𝑺𝒑𝒆𝒄𝒊𝒇𝒊𝒕𝒚(𝑻𝑭𝑹)
=
TR + FR
TR
(12)
𝑭𝑨𝑹
= 1 − TFR (13)
where TA, TR, FA, and FR represent the true acceptance, true reject, false acceptance, and false reject, respectively. The results of the classification phase are represented as a confusion matrix that tabulates whether they fall into one of four categories: TA, TR, FA and FR.
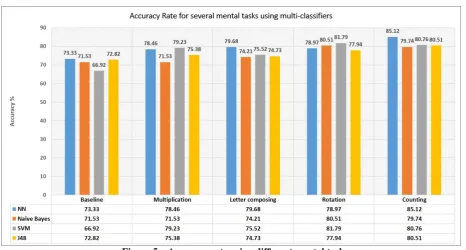
Figure 5 – Accuracy rate using different mental tasks.
where TA, TR, FA, and FR represent true acceptance, true reject, false acceptance, and false reject, respectively. The results of classification, phase is represented as a confusion matrix that tabulates whether they fall into one of four categories: true acceptance (TA), true reject (TR), false acceptance (FA) and false reject (FR).
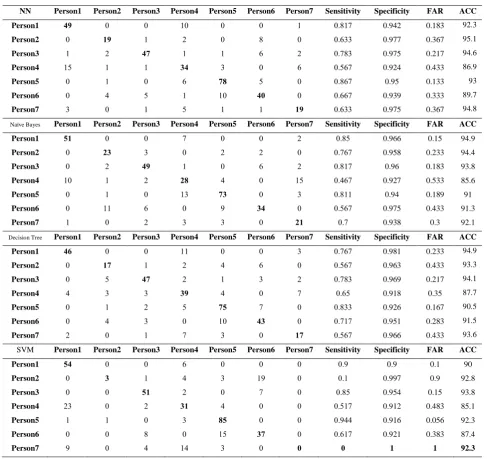
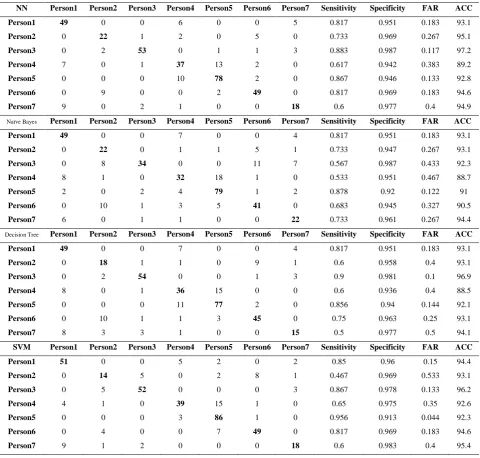
Tables (4-8) show the confusion matrixes according to baseline, multiplication, letter composition, rotation, and counting task, respectively. Overall, subject seven obtains the best results during the test for all tasks where it achieved the highest sensitivity value=1 with counting task using NN and SVM classifier. The highest accuracy is obtained with counting task, while the accuracy=85.12%, and FAR= 14.87% using NN classifier. Figure 5 shows the accuracy rate for the input EEG signals based on five decomposition level using MOFPA-WT for baseline, multiplication, rotation, letter composition, and counting task, respectively based on several classifiers methods which are artificial neural network (NN), Naïve Bayes, Decision Tree (J48), and support victor machine (SVM). Figure 6 shows the FAR using several classifiers method, while the best results has been achieved with NN classifiers. Table 9 show a comparison based on EEG features extraction using neural network (NN) classifier. The results show that the EEG_Std provided the highest
accuracy rate with 84% correction rate compared with others features, where these features achieved.
6.
Conclusions and future work
In this paper, a novel technique for EEG signal denoising based on multi-objective flower pollination algorithm with wavelet transform (MOFPA-WT) is proposed. The main task of MOFPA-WT method is to find the efficient decomposition of the input EEG signal which can provide unique features from each sub-band. MOFPA-WT is tested using a standard EEG signal dataset, namely, Keirn EEG dataset which have five mental tasks includes base line, multiplication, rotation, letter composition, and counting task, respectively. The performance of MOFPA-WT is evaluated using four criteria: accuracy, sensitivity, specificity, and false acceptance rate.
In conclusion, the proposed method achieves the highest accuracy result which can be obtained using mental tasks based on visual counting task compared with mental tasks. Also, the proposed method shows that the brainwave signal provided unique features which can be used as new biometric technique.
For future work, MOFPA-WT will be applied for more challenging signal problem instances, such as user authentication with large EEG dataset or early detection of epilepsy based on EEG signal. Furthermore, the real-world applications are required to show the efficiency of MOFPA-WT. Other possible improvements are applying one of features selection technique is recommended to increase the accuracy rate as well as to reduce the dimensions redundancy of the extracted Regarding future works, we intend to apply MOFPA-WT in more challenging signal problem instances, such as user authentication or early detection of epilepsy based on EEG signals, as well as to consider MOFPA-WT in larger datasets for EEG-based person identification.
Table 4 - Baseline task results.
NN Person1 Person2 Person3 Person4 Person5 Person6 Person7 Sensitivity Specificity FAR ACC
Person1 94 0 0 00 0 0 0 01800 0.942 0.183 92.3
Person2 0 94 0 2 0 8 0 01600 0.977 0.367 95.1
Person3 0 2 94 0 0 6 2 01080 0.975 0.217 94.6
Person4 01 0 0 49 0 0 6 01160 0.924 0.433 86.9
Person5 0 0 0 6 47 1 0 01860 0.95 0.133 93
Person6 0 4 1 0 00 94 0 01660 0.939 0.333 89.7
Person7 0 0 0 1 0 0 94 01600 0.975 0.367 94.8
Naïve Bayes Person1 Person2 Person3 Person4 Person5 Person6 Person7 Sensitivity Specificity FAR ACC
Person1 19 0 0 0 0 0 2 0181 0.966 0.15 94.9
Person2 0 34 0 0 2 2 0 01060 0.958 0.233 94.4
Person3 0 2 94 0 0 6 2 01800 0.96 0.183 93.8
Person4 00 0 2 37 4 0 01 01460 0.927 0.533 85.6
Person5 0 0 0 00 44 0 0 01800 0.94 0.189 91
Person6 0 00 6 0 9 49 0 01160 0.975 0.433 91.3
Person7 0 0 2 0 0 0 39 010 0.938 0.3 92.1
Decision Tree Person1 Person2 Person3 Person4 Person5 Person6 Person7 Sensitivity Specificity FAR ACC
Person1 94 0 0 00 0 0 0 01060 0.981 0.233 94.9
Person2 0 94 0 2 4 6 0 01160 0.963 0.433 93.3
Person3 0 1 94 2 0 0 2 01080 0.969 0.217 94.1
Person4 4 0 0 44 4 0 0 0161 0.918 0.35 87.7
Person5 0 0 2 1 41 0 0 01800 0.926 0.167 90.5
Person6 0 4 0 0 00 94 0 01000 0.951 0.283 91.5
Person7 2 0 0 0 0 0 94 01160 0.966 0.433 93.6
SVM Person1 Person2 Person3 Person4 Person5 Person6 Person7 Sensitivity Specificity FAR ACC
Person1 19 0 0 6 0 0 0 019 0.9 0.1 90
Person2 0 4 0 4 0 09 0 010 0.997 0.9 92.8
Person3 0 0 19 2 0 0 0 0181 0.954 0.15 93.8
Person4 20 0 2 49 4 0 0 01100 0.912 0.483 85.1
Person5 0 0 0 0 71 0 0 01944 0.916 0.056 92.3
Person6 0 0 8 0 01 44 0 01600 0.921 0.383 87.4
Table 5 – Multiplication task results.
NN Person1 Person2 Person3 Person4 Person5 Person6 Person7 Sensitivity Specificity FAR ACC
Person1 49 0 0 6 0 0 5 0.817 0.951 0.183 93.1
Person2 0 22 1 2 0 5 0 0.733 0.969 0.267 95.1
Person3 0 2 53 0 1 1 3 0.883 0.987 0.117 97.2
Person4 7 0 1 37 13 2 0 0.617 0.942 0.383 89.2
Person5 0 0 0 10 78 2 0 0.867 0.946 0.133 92.8
Person6 0 9 0 0 2 49 0 0.817 0.969 0.183 94.6
Person7 9 0 2 1 0 0 18 0.6 0.977 0.4 94.9
Naïve Bayes Person1 Person2 Person3 Person4 Person5 Person6 Person7 Sensitivity Specificity FAR ACC
Person1 49 0 0 7 0 0 4 0.817 0.951 0.183 93.1
Person2 0 22 0 1 1 5 1 0.733 0.947 0.267 93.1
Person3 0 8 34 0 0 11 7 0.567 0.987 0.433 92.3
Person4 8 1 0 32 18 1 0 0.533 0.951 0.467 88.7
Person5 2 0 2 4 79 1 2 0.878 0.92 0.122 91
Person6 0 10 1 3 5 41 0 0.683 0.945 0.327 90.5
Person7 6 0 1 1 0 0 22 0.733 0.961 0.267 94.4
Decision Tree Person1 Person2 Person3 Person4 Person5 Person6 Person7 Sensitivity Specificity FAR ACC
Person1 49 0 0 7 0 0 4 0.817 0.951 0.183 93.1
Person2 0 18 1 1 0 9 1 0.6 0.958 0.4 93.1
Person3 0 2 54 0 0 1 3 0.9 0.981 0.1 96.9
Person4 8 0 1 36 15 0 0 0.6 0.936 0.4 88.5
Person5 0 0 0 11 77 2 0 0.856 0.94 0.144 92.1
Person6 0 10 1 1 3 45 0 0.75 0.963 0.25 93.1
Person7 8 3 3 1 0 0 15 0.5 0.977 0.5 94.1
SVM Person1 Person2 Person3 Person4 Person5 Person6 Person7 Sensitivity Specificity FAR ACC
Person1 51 0 0 5 2 0 2 0.85 0.96 0.15 94.4
Person2 0 14 5 0 2 8 1 0.467 0.969 0.533 93.1
Person3 0 5 52 0 0 0 3 0.867 0.978 0.133 96.2
Person4 4 1 0 39 15 1 0 0.65 0.975 0.35 92.6
Person5 0 0 0 3 86 1 0 0.956 0.913 0.044 92.3
Person6 0 4 0 0 7 49 0 0.817 0.969 0.183 94.6
Table 6 – Letter Composing task.
NN Person1 Person2 Person3 Person4 Person5 Person6 Person7 Sensitivity Specificity FAR ACC
Person1 56 0 0 1 0 0 3 0.933 0.975 0.067 96.9
Person2 1 21 0 3 2 3 0 0.7 0.968 0.3 94.8
Person3 0 0 56 1 0 2 1 0.933 0.978 0.067 97.1
Person4 3 2 1 37 5 3 3 0.685 0.945 0.315 90.9
Person5 0 1 1 5 78 5 0 0.867 0.952 0.133 93.2
Person6 0 8 1 6 4 41 0 0.683 0.959 0.317 91.7
Person7 4 0 4 2 3 0 17 0.567 0.980 0.433 94.8
Naïve Bayes Person1 Person2 Person3 Person4 Person5 Person6 Person7 Sensitivity Specificity FAR ACC
Person1 53 0 0 0 3 0 4 0.883 0.984 0.117 96.9
Person2 0 20 0 4 0 3 3 0.667 0.991 0.433 96.6
Person3 0 0 49 0 0 8 3 0.817 0.984 0.183 95.8
Person4 5 1 0 21 12 0 15 0.389 0.936 0.611 85.9
Person5 0 0 0 10 75 2 3 0.833 0.918 0.167 89.8
Person6 0 2 2 5 6 45 0 0.75 0.959 0.25 92.7
Person7 0 0 3 2 3 0 22 0.733 0.92 0.267 90.6
Decision Tree Person1 Person2 Person3 Person4 Person5 Person6 Person7 Sensitivity Specificity FAR ACC
Person1 51 0 0 4 0 0 5 0.85 0.966 0.15 94.8
Person2 0 20 0 5 0 5 0 0.667 0.954 0.333 93.2
Person3 0 0 55 0 0 2 3 0.917 0.984 0.083 97.4
Person4 5 7 1 21 9 8 3 0.389 0.939 0.611 86.2
Person5 1 0 0 6 81 2 0 0.9 0.942 0.1 93.2
Person6 0 7 2 3 7 41 0 0.683 0.947 0.317 90.6
Person7 5 2 2 2 1 0 18 0.6 0.968 0.4 94
SVM Person1 Person2 Person3 Person4 Person5 Person6 Person7 Sensitivity Specificity FAR ACC
Person1 58 0 0 1 0 0 1 0.967 0.947 0.033 95.1
Person2 1 13 0 5 0 8 3 0.433 0.983 0.567 94
Person3 1 1 53 1 0 2 2 0.883 0.996 0.117 97.9
Person4 11 0 0 19 14 0 10 0.352 0.948 0.648 86.5
Person5 0 0 0 6 84 0 0 0.933 0.908 0.067 91.4
Person6 0 5 0 3 8 44 0 0.733 0.969 0.267 93.2
Table 7 –Rotation task results.
NN Person1 Person2 Person3 Person4 Person5 Person6 Person7 Sensitivity Specificity FAR ACC
Person1 52 0 1 6 1 0 0 0.867 0.981 0.133 96.4
Person2 0 19 5 1 1 4 0 0.633 0.963 0.367 93.8
Person3 0 5 49 0 3 0 3 0.817 0.96 0.183 93.8
Person4 3 0 2 38 14 2 1 0.633 0.957 0.367 90.8
Person5 2 0 1 5 78 4 0 0.867 0.926 0.133 91.3
Person6 0 8 1 2 3 46 0 0.767 0.969 0.233 93.8
Person7 1 0 3 0 0 0 26 0.867 0.988 0.133 97.9
Naïve Bayes Person1 Person2 Person3 Person4 Person5 Person6 Person7 Sensitivity Specificity FAR ACC
Person1 54 0 0 6 0 0 0 0.9 0.969 0.1 95.9
Person2 0 25 2 0 0 3 0 0.833 0.972 0.167 96.2
Person3 0 6 46 3 1 2 2 0.767 0.975 0.233 94.4
Person4 7 1 5 33 13 0 1 0.55 0.921 0.45 86.4
Person5 3 0 0 10 77 0 0 0.856 0.953 0.144 93.1
Person6 0 3 0 7 0 50 0 0.833 0.984 0.167 96.2
Person7 0 0 1 0 0 0 29 0.967 0.991 0.033 99
Decision Tree Person1 Person2 Person3 Person4 Person5 Person6 Person7 Sensitivity Specificity FAR ACC
Person1 51 0 0 8 1 0 0 0.85 0.975 0.15 95.6
Person2 0 16 2 1 2 9 0 0.533 0.952 0.467 92.1
Person3 0 3 50 3 1 0 3 0.833 0.966 0.167 94.6
Person4 8 2 5 33 11 1 0 0.55 0.936 0.45 87.7
Person5 0 4 0 9 77 0 0 0.856 0.946 0.144 92.6
Person6 0 8 0 0 0 52 0 0.867 0.969 0.133 95.4
Person7 0 0 4 0 1 0 25 0.833 0.991 0.167 97.9
SVM Person1 Person2 Person3 Person4 Person5 Person6 Person7 Sensitivity Specificity FAR ACC
Person1 53 0 0 3 4 0 0 0.883 0.981 0.117 96.7
Person2 0 15 4 2 0 8 1 0.5 0.98 0.5 94.4
Person3 0 2 56 0 0 1 1 0.933 0.972 0.067 96.7
Person4 1 2 0 38 15 0 4 0.633 0.96 0.367 91
Person5 3 0 0 4 83 0 0 0.922 0.93 0.078 92.8
Person6 0 3 1 4 2 50 0 0.833 0.972 0.167 95.1
Table 8 –Counting task results.
NN Person1 Person2 Person3 Person4 Person5 Person6 Person7 Sensitivity Specificity FAR ACC
Person1 50 0 0 9 1 0 0 0.833 0.942 0.167 92.6
Person2 0 25 3 0 1 1 0 0.833 0.98 0.167 96.9
Person3 0 5 52 0 0 1 2 0.867 0.99 0.133 97.2
Person4 19 0 0 33 6 0 2 0.55 0.957 0.45 89.5
Person5 0 0 0 5 85 0 0 0.944 0.97 0.056 96.4
Person6 0 2 0 0 1 57 0 0.95 0.993 0.05 98.7
Person7 0 0 0 0 0 0 30 1 0.988 0 99
Naïve Bayes Person1 Person2 Person3 Person4 Person5 Person6 Person7 Sensitivity Specificity FAR ACC
Person1 48 0 0 9 2 0 1 0.8 0.93 0.2 91
Person2 0 28 0 0 2 0 0 0.933 0.963 0.067 96.2
Person3 0 9 51 0 0 0 0 0.85 0.99 0.15 96.9
Person4 22 0 0 34 4 0 0 0.567 0.921 0.433 86.7
Person5 0 0 1 16 73 0 0 0.811 0.956 0.189 92.3
Person6 0 4 2 0 5 49 0 0.817 1 0.183 97.2
Person7 1 0 0 1 0 0 28 0.933 0.997 0.067 99.2
Decision Tree Person1 Person2 Person3 Person4 Person5 Person6 Person7 Sensitivity Specificity FAR ACC
Person1 42 0 0 14 2 0 2 0.7 0.954 0.3 91.5
Person2 0 18 4 1 2 5 0 0.6 0.972 0.4 94.4
Person3 0 3 52 0 3 2 0 0.867 0.978 0.133 96.2
Person4 14 0 0 41 5 0 0 0.683 0.933 0.317 89.5
Person5 0 1 1 7 81 0 0 0.9 0.956 0.1 94.4
Person6 0 5 1 0 1 53 0 0.883 0.978 0.117 96.4
Person7 1 1 1 0 0 0 27 0.9 0.994 0.1 98.7
SVM Person1 Person2 Person3 Person4 Person5 Person6 Person7 Sensitivity Specificity FAR ACC
Person1 43 0 0 14 2 0 1 0.717 0.942 0.283 90.8
Person2 0 23 0 0 2 5 0 0.767 0.969 0.233 95.4
Person3 0 8 51 0 0 0 1 0.85 0.987 0.15 96.7
Person4 19 0 0 33 6 0 2 0.55 0.948 0.45 88.7
Person5 0 0 0 3 87 0 0 0.967 0.95 0.037 95.4
Person6 0 3 4 0 5 48 0 0.8 0.984 0.2 95.6
Person7 0 0 0 0 0 0 30 1 0.988 0 99
Table 9 –Counting task results per features.
NN Sensitivity Specificity FAR ACC
EEG_Mean 0.329 0.889 0.67 35.38
EEG_Std 0.839 0.973 0.16 84.61
EEG_Entropy 0.691 0.95 0.308 70.76 EEG_Energy 0.329 0.889 0.67 35.38
Acknowledgement
References
[1] Abdi, Z., Alyasseri, A., Khader, A. T., Al-betar, M. A., Awadallah, M. A., & Yang, X. (2018). Variants of the Flower Pollination Algorithm : A Review. https://doi.org/10.1007/978-3-319-67669-2_5
[2] Abdulkader, S. N., Atia, A., & Mostafa, M. S. M. (2015). Brain computer interfacing: Applications and challenges. Egyptian Informatics Journal, 16(2), 213–230. https://doi.org/10.1016/j.eij.2015.06.002
[3] Abo-Zahhad, M., Ahmed, S. M., & Abbas, S. N. (2016). A new multi-level approach to EEG based human authentication using eye blinking. Pattern Recognition Letters, 82, 216–225. https://doi.org/10.1016/j.patrec.2015.07.034
[4] Abualigah, L. M., Khader, A. T., Al-Betar, M. A., Alyasseri, Z. A. A., Alomari, O. A., & Hanandeh, E. S. (2017). Feature Selection with β-Hill Climbing Search for Text Clustering Application. In Proceedings - 2017 Palestinian International Conference on Information and Communication Technology, PICICT 2017. https://doi.org/10.1109/PICICT.2017.30
[5] Al-betar, M. A. (2017). -Hill climbing: an exploratory local search. Neural Computing and Applications. https://doi.org/10.1007/s00521-016-2328-2
[6] Al-Betar, M. A., Alyasseri, Z. A. A., Khader, A. T., La ’aro Bolaji, A., & Awadallah, M. A. (2016). Gray image enhancement using harmony search. International Journal of Computational Intelligence Systems, 9(5), 932–944. [7] Alyasseri, Z. A. A., Khader, A. T., & Al-Betar, M. A. (2017). Electroencephalogram Signals Denoising using
Various Mother Wavelet Functions: A Comparative Analysis. Proceedings of the International Conference on Imaging, Signal Processing and Communication, 100–105. https://doi.org/10.1145/3132300.3132313
[8] Alyasseri, Z. A. A., Khader, A. T., & Al-Betar, M. A. (2017). Optimal electroencephalogram signals denoising using hybrid β-hill climbing algorithm and wavelet transform. In ACM International Conference Proceeding Series (Vol. Part F1313). https://doi.org/10.1145/3132300.3132314
[9] Alyasseri, Z. A. A., Khader, A. T., Al-Betar, M. A., & Abualigah, L. M. (2017). ECG signal denoising using β-hill climbing algorithmand wavelet transform. ICIT 2017 The 8th International Conference on Information Technology. [10] Alyasseri, Z. A. A., Khader, A. T., Al-Betar, M. A., & Awadallah, M. A. (2018). Hybridizing β-hill climbing with wavelet transform for denoising ECG signals. Information Sciences, 429. https://doi.org/10.1016/j.ins.2017.11.026 [11] Alyasseri, Z. A. A., Venkat, I., Al-Betar, M. A., & Khader, A. T. (2012). Edge preserving image enhancement via harmony search algorithm. In Conference on Data Mining and Optimization. https://doi.org/10.1109/DMO.2012.6329797
[12] Alyasseri, Z. A. A., Khader, A. T., Al-Betar, M. A., Papa, J. P., & ahmad Alomari, O. (2018, July). EEG-based Person Authentication Using Multi-objective Flower Pollination Algorithm. In 2018 IEEE Congress on Evolutionary Computation (CEC) (pp. 1-8). IEEE.
[13] Berger, H. (1929). Uber das Elektrenkephalogramm des Menschen (On the human elec- troencephalogram). Archiv f. Psychiatrie u. Nervenkrankheiten, 87(1875), 527–570. https://doi.org/10.1007/BF01797193
[14] Donoho, D. L., & Johnstone, I. M. (1994). Ideal spatial adpatation by wavelet shrinkage. Biometrika, 81, 425–455. [15] Keirn, Z. A., & Aunon, J. I. (1990). A New Mode of Communication Between Man and his Surroundings. IEEE
Transactions on Biomedical Engineering, 37(12), 1209–1214. https://doi.org/10.1109/10.64464
[16] Kumari, P., & Vaish, A. (2015). Brainwave based user identification system: A pilot study in robotics environment. Robotics and Autonomous Systems, 65, 15–23. https://doi.org/10.1016/j.robot.2014.11.015
[17] Kumari, P., & Vaish, A. (2016). Feature-level fusion of mental task’s brain signal for an efficient identification system. Neural Computing and Applications, 27(3), 659–669. https://doi.org/10.1007/s00521-015-1885-0
[18] Kumari Sharma, P., & Vaish, A. (2016). Individual identification based on neuro-signal using motor movement and imaginary cognitive process. Optik, 127(4), 2143–2148. https://doi.org/10.1016/j.ijleo.2015.09.020
[19] Ramadan, R. A., & Vasilakos, A. V. (2017). Brain computer interface: control signals review. Neurocomputing, 223(August), 26–44. https://doi.org/10.1016/j.neucom.2016.10.024
[20] Rao, R. P. N. (2013). Brain-computer interfacing: An introduction. Brain-Computer Interfacing: An Introduction. https://doi.org/10.1017/CBO9781139032803
[21] Rodrigues, D., Silva, G. F. A., Papa, J. P., Marana, A. N., & Yang, X. S. (2016). EEG-based person identification through Binary Flower Pollination Algorithm. Expert Systems with Applications, 62, 81–90. https://doi.org/10.1016/j.eswa.2016.06.006
[22] Sarier, N. D. (2010). Improving the accuracy and storage cost in biometric remote authentication schemes. Journal of Network and Computer Applications, 33(3), 268–274. https://doi.org/10.1016/j.jnca.2009.12.017
[23] Schalk, G., McFarland, D. J., Hinterberger, T., Birbaumer, N., & Wolpaw, J. R. (2004). BCI2000: A General-Purpose Brain-Computer Interface (BCI) System. IEEE Transactions on Biomedical Engineering, 51(6), 1034– 1043. https://doi.org/10.1109/TBME.2004.827072
[24] Yang, X.-S. (2013). Flower Pollination Algorithm for Global Optimization. https://doi.org/10.1007/978-3-642-32894-7_27