Dynamic Performance on Multi Storey Structure Due to
Ground Borne Vibrations Input from Passing Vehicles
Tuan Norhayati Tuan Chik
1,*, Rachel Alexius Asiew
2, Mohd Haziman Wan
Ibrahim
3and Nor Azizi Yusoff
.41, 2,3
Department of Structures and Materials Engineering, Faculty of Civil and Environmental Engineering, Universiti Tun Hussein Onn Malaysia, 86400 Johor, MALAYSIA.
4
Department of Infrastructure and Geomatic Engineering, Faculty of Civil and Environmental Engineering, Universiti Tun Hussein Onn Malaysia, 86400 Johor, MALAYSIA.
1.
Introduction
Road is one of the most important channel for people to move from one place to another. The road can be used by various kind of transportation such as bicycle, motorcycle, car, bus, lorry, trucks and many more. These vehicles might cause a volume of vibration when it passed by in a great load and high speed. The greater the load transferred from the vehicle, the more vibration occurred on the ground and this kind of vibrations is known as ground borne vibration.
Normally, most of the construction activities related to road infrastructure provides a high volume of ground borne vibrations which is can cause damage to the structures nearby such as any adjacent buildings. This vibration need to be avoided or reduced as far as possible. It is practicable to the disturbance to communities from groundborne vibrations generated during construction, maintenance and any operation such as for linguistic activities by road. The effects of ground borne vibration include movement of the building floors, shaking of items, rattling of windows or even a rumbling floor. In extreme cases, the vibrations might cause damage to buildings [1].
The vibration from the passing heavy vehicles such
hence it will then create a vibration waves that propagated through the various soil and rock strata to the foundations of any adjacent buildings. The vibration propagates from the foundation throughout the remainder of the building structure. The maximum vibration amplitudes of the floors and walls of a building often will be at the resonance frequencies of various components of the building [1].
According to Griffin [2], although vibrations induced in buildings by ground borne excitation are often noticeable, there is little evidence that the vibrations produce even cosmetic damage (i.e. small cracks in plaster). Passing vehicles with heavy load is one of the external sources of the vibrations. This kind of vibration happens as a ground borne vibration and thus will affect the adjacent building from the resonance produced. This phenomenon can be detected obviously especially on the vulnerable or old structures, any building containing sensitive or heavy items such as machines and etc.
The vibrations from the heavy vehicles such as lorry, trucks or busses might affect the structure of the building as well as the equipment inside the building. Hence, the sensitivity of the equipment will also be affected due to transmission of vibrations. Computers and scanners are normally located in the office building such as the
Abstract:Ground borne vibration from passing vehicles could excite the adjacent ground, hence produces a vibration waves that will propagate through layers of soil towards the foundations of any adjacent building. This vibration could affects the structure of the building at some levels and even the low sensitivity equipment are also could be affected as well. The objectives of this study are to perform the structural response on multi storey building subjected to ground vibrations input and to determine the level of vibration at each floor from road traffic on the observed building. The scopes of the study are focused on the groundborne vibrations induced by the passing vehicles and analyse the data by using dynamic software such as ANSYSv14 and MATLAB. The selected building for this study is the Registrar Office building which is located in Universiti Tun Hussein Onn Malaysia (UTHM). The inputs of the vibration were measured by using Laser Doppler Vibrometer (LDV) equipment. By conducting the field measurement, a real input of ground borne vibration from the loads of vehicle towards any adjacent building can be obtained. Finally, the vibration level from road traffic on office building can be determined using overseas generic criteria guidelines. The vibration level achieved for this building is at above the ISO level, which is suitable for office building and within acceptable limit.
location which is located by two main busy roads. Thus, the effects of ground borne vibrations from passing vehicles nearby on this building will be further investigated in this study.
The first objective is in this study is to perform the structure response on Registrar Office under ground borne vibration input. Secondly, it is to determine the level of vibration from road traffic on Registrar Office.
2.
Ground Borne Vibration
Ground borne vibration is not a common environmental problem unlikely to airborne noise. It is an unusual for vibration from sources such as buses and trucks to be perceptible, even in location near to major roads. Some of the common sources of ground borne vibration are trains, buses on rough roads and construction activities. The vibrations on the road will be generated on the ground and transmitted the vibration waves which propagate through the various soil and rock strata to the foundation of any adjacent buildings, then throughout the remainder of the building structures. The maximum vibration amplitude of the floors and walls of the building normally will be at the resonance frequencies of various components of the building. Apart from that, Hunaidi [3] implied that a ground borne vibration is highly dependent on the direction, position and frequency. Although vibration is possibly not really significant, it should not be overlooked as a minor problem in contributing to the structural damage and also the effect on sensitive equipment, such as those accommodate in hospital operating theatres, scientific research laboratories, etc.
2.1 Sources of ground borne vibration
There are various numbers of the sources of vibration where there is impossible to achieve a complete vibration-free environment neither inside nor outside the building. Instead of having a completely free vibration environment, there are need to reduce the vibration up to an acceptable level. Based on Hunaidi [3], there are three major sources of vibration that can affect structures and the sensitive equipment which housing in the building. The three major sources are:
i. External sources that include ambient vibrations at the site (micro-tremors), road and rail traffic, constructions activities and machinery operating from outside or nearby building.
ii. Internal activities such as footfalls, service activities (repair works) and maintenance works. iii. Service machinery that include all mechanical
and electrical equipment such as air-conditioner.
Only external vibration source from road traffic will be investigated in this study.
2.2 External vibration induced by road
traffic
Hunaidi [3] mentioned that the external vibrations induced by road traffic are common concern worldwide. A traffic vibration is characterized by a source-path-receiver scenario as shown in Fig. 1. The approaching or passing vehicles have a direct contact with the road surface and then will produce a dynamic load on the road pavement. Hence, the load will spread through the soil until it reach the foundation of any adjacent buildings. As a results, this situation will cause the building to vibrate and the equipment and people inside the building will experience the effect as well.
Fig. 1 Traffic vibrations source-path-receiver scenario [3].
Road traffic vibration nuisance in buildings because of heavy vehicles that passing at relatively high speed on the road with an uneven surface profile as shown in Fig. 2. Cars and light trucks rarely induced vibrations that are perceptible in buildings.
Fig. 2 Passage of a bus on a transition between an asphalt surface and paved surface [4].
transferred the horizontal components will be amplified over the height of the building.
When any heavy vehicles strike on an irregularity in the road surface, it will generate an impact load as well as an oscillating load due to the “axle hop” of the vehicle. This impact load will excite the ground borne vibrations which is predominant at the natural vibration frequencies of the soil whereas the axle hop generated vibrations at the hop frequency. The hop frequency is a characteristic of the vehicle’s suspension system which will not be discussed in this study. Hunaidi [3] concluded that if the natural frequencies of the soil coincide with any of the natural frequencies of the building structures or any of its components, resonance will occur and vibrations will be amplified. Therefore, the resonance effects should be avoided due to the safety reason to the any structures.
2.3 Vibration criteria (VC) curve
In this study, specific vibration criteria guideline was used in order to investigate the performance of the structures. The criteria curves were developed in the 1980’s in response for a need of design standards to accommodate a wide range of tools and instruments used by the microelectronics, medical and biopharmaceutical industries. Some manufacturers provide incomplete tool specific requirements of all equipment. Therefore, the curves and descriptions were necessarily “generic” in the sense that the criteria were intended to meet the needs of all tools within each category as best the previous researchers could judge based on experience mingled with tool-specific specifications [5].
Vibration criteria curves are commonly used in the design of facilities such as buildings and instruments that are sensitive to vibrations. It was published by the International Society for Optics and Photonics (SPIE) in 1991 and later by the Institute of Environmental Sciences and Technology (IEST) in 1993. Each curve of the criteria are associated with line width or size detail which is a representation of the device capabilities [6], as shown in Fig. 3. The form of the criteria is taken through aset of one-third octave band velocity spectra and labelled vibration criterion curves VC-A to VC-E, including with the International Standards Organization (ISO) guidelines for the effects of vibration on people in buildings. The criteria apply to vibration are measured in the vertical and two horizontal directions [7].
It is now widely accepted throughout the world as a basis for designing and evaluating the performance of microelectronics fabrication facilities where continuity of vibration-free tool performance is essential. The curves and the descriptions, as shown in Table 1(a) and (b), are reviewed in the light of continued and projected future tool developments taking into account through experience on past and present projects [6].
Fig. 3 Generic vibration criterion (VC) [6].
Table 1(a) Application and interpretation of the generic vibration criterion (VC) curves for amplitude 800 μm/s to 25μm/s [6].
Vibration Curve
Ampli- tude (μm/s)
Detail size, (μm)
Application and experience
Workshop
(ISO) 800 N/A*
Distinctly perceptible vibration. Appropriate to workshops and no sensitive areas.
Office (ISO) 400 N/A*
Perceptible vibration. Appropriate to offices and no sensitive areas.
Residential day (ISO)
200 75
Barely perceptible vibration. Appropriate to sleep areas in most instances. Usually adequate for computer equipment, hospital recovery rooms, semiconductor probe test equipment, and microscopes less than 40X.
Operating theatre
(ISO)
100 25
Vibration not perceptible. Suitable in most instances for surgical suites, microscopes to 100X and other equipment of low sensitivity.
VC-A 50 8
Adequate in most instances for optical microscope to 400X, microbalances, optical balances, proximity and projection aligners, etc.
VC-B 25 3
Appropriate for inspection and lithography equipment (including steppers) to 3μm line widths.
Table 1 (b) Application and interpretation of the generic vibration criterion (VC) curves for amplitude below than 12.5 μm/s [6].
Vibration Curve
Ampli- tude (μm/s)
Detail size, (μm)
Application and experience
VC-C 12.5 1 - 3
Appropriate standard for optical microscopes to 1000X, lithography and inspection equipment (including moderately sensitive electron microscopes) to 1μm line widths. TFT-LCD stepper/scanner processes.
VC-D 6.25 0.1 –
0.3
Suitable in most instances for demanding equipment, including electron microscopes (TEMs and SEMs) and E-Beam systems.
VC-E 3.12 < 0.1
A difficult criterion to achieve in most instances. Assumed to be adequate for the most demanding of sensitive systems including long path, laser-based, small target systems, E-Beam lithography systems working at nanometre scales and other systems requiring
extraordinary dynamic stability.
*N/A: Not available
3.
Field Measurement at Site
Field measurement was conducted in order to get the signal data for this study by using the aid of Vibrometer equipment. The amplitude of the ground borne vibration produced by the passing vehicles is measured during peak hour on working days. Fig. 4(a) shows Vibrometer equipment namely Laser Doppler Vibrometer (LDV 100), while Fig. 4(b) shows the location of the measurement in the office building. Meanwhile, Fig. 5 shows the front view of Registrar office building and the layout of the office between two main roads. The main road in the front and behind the building will influence the vibration level on building.
(a) (b)
Fig. 4 (a) Laser Doppler Vibrometer (LDV 100), and (b) Measurement at site.
(a) Registrar office building(front view)
(b) Layout of office building with two main road
Fig. 5(a) Registrar office building(front view), and (b) Layout of office building with two main road.
The measurement conducted in and outside the building produced the vibration waves as shown in Fig. 6. Then, this raw data need to be processed and analysed using specific algorithm in MATLAB (Mathematics Laboratory) in order to obtain a signal input which can be further analysed in finite element modelling using ANSYS software to perform natural frequency, mode shapes and time history of the building.
4.
Finite Element Method (FEM)
The Finite Element Method (FEM) can be defined as a numerical technique which is based on approximation of differential equation that model problems arising in physics and engineering. This method involves subdividing a geometrical space also called domain into a finite number of smaller region called mesh [8].
FEM is the dominant discretization technique in structural mechanics. The basic concept in the physical interpretation of the FEM is the subdivision of the mathematical model into disjoint (non-overlapping) components of simple geometry called finite elements or elements for short [8]. The response of each element is expressed in terms of a finite number of degrees of freedom characterized as the value of an unknown function, or functions, at a set of nodal points.
The process of FEM as shown in Fig. 7 is applied with the aid of the ANSYS and MATLAB software. It is a default normal method for determining the dynamic performance of structures by saving valuable design time and money in construction. In this study, the numerical simulation of vibration response of the office building was carried out by using ANSYS, finite element package and VSATs (Vibration Serviceability Assessment Tools) software, which was developed in MATLAB interface and algorithm [9].
Fig. 7 Finite element method process [10].
ANSYS is finite element analysis software which enables the researcher to develop models of structures, products, components or systems. It can apply operating loads or other design performance conditions and also can optimise a design in the development process to reduce production costs, while MATLAB is a high-level programming language and interactive environment that enables the researcher to perform computationally intensive tasks. All the relevant outputs from ANSYS were processed in MATLAB programmes, which then determine the absolute response of the structure, and to compare the structural performance with generic vibration criteria. The flow of the whole finite element analysis in this study is shown in Fig. 8.
Fig. 8 The structural vibration analysis process [11].
Then after being processed in the ANSYS, the data obtained will transfer into the MATLAB application. MATLAB application will analyse the data from ANSYS and the output produced will be used to determine the level of vibration incurred by the building. The data is then compared to the vibration criteria curves which used as a guideline and also the signal inputs that have been used. If passed, the study will be completed, but if it is over the acceptable vibration level limit, the mitigation methods to control the vibration level on buildings will take place in order to reduce the vibration response on building. The previous steps need to be repeated until the satisfied value obtained which fulfilled the guideline curves.
5.
Results and Discussions
5.1 Deform shape pattern analysis
Mode 1: 1.02Hz Mode 2: 1.01 Hz
Mode 3: 1.31Hz Mode 4: 3.27Hz
Mode 5: 3.21Hz Mode 6: 3.43Hz
Mode 7: 3.43Hz Mode 8:3.64Hz
Mode 9: 4.82 Hz Mode 10: 5.47 Hz
Fig.9 The first tenth mode shape of Registrar office.
Detail description for each mode as shown in Fig. 9 is described in Table 2 for both directions, horizontally and vertically. The displacement value for both directions shows the deformation of the structure including beams and columns. The model was analysed under 100 modes due to obtain the peak response of natural frequency and vertical behaviour of the floor structure on building.
Highest peak displacement (both directions) is represented by the red area while the minimum displacement is represented by the blue area. Green areas
were experiencing a little displacement and not so obvious. This deformation may have an impact on the equipment and occupants. For areas with the maximum deflection, that area is suggested not suitable for sensitive equipment and people in that area also may be affected.
Table 2 Mode description for first ten modes.
Mode/ frequency
Mode description and displacement value (m)
Mode 1/ 1.02 Hz
Horizontal: No changing, 0.000043 Vertical: Slightly changing, 0.001543 Mode 2/
1.01 Hz
Horizontal: Medium changing, 0.001067 Vertical: Medium changing, 0.000269 Mode 3/
1.31 Hz
Horizontal: No changing, 0.000631 Vertical: Medium changing, 0.002056 Mode 4/
3.27 Hz
Horizontal: Major changing, 0.000856 Vertical: Medium changing, 0.000802 Mode 5/
3.21 Hz
Horizontal: Major changing, 0.000661 Vertical: Medium changing, 0.000931 Mode 6/
3.43 Hz
Horizontal: No changing, 0.003747 Vertical: Medium changing, 0.000016 Mode 7/
3.43 Hz
Horizontal: No changing, 0.000018 Vertical: Slightly changing, 0.003753 Mode 8/
3.64 Hz
Horizontal: Slightly changing, 0.000550 Vertical: Slightly changing, 0.001719 Mode 9/
4.82 Hz
Horizontal: No changing, 0.004064 Vertical: Slightly changing, 0.008089 Mode 10/
5.47 Hz
Horizontal: No changing, 0.000579 Vertical: Slightly changing, 0.000584
5.2 Vibration serviceability assessment tools
(VSATs)
VSATs are developed due to aid not only assessment of vibration serviceability of floors but also evaluation of new floor design and to investigate the vibration behaviour. The software could enable an effective comparison of results from different models to be compares and can be used for assessing vibration serviceability of structures where the modal properties and serviceability are known [9].
Mode/ frequen
cy
First Floor Second
Floor Third Floor
Mode 1/ 1.02 Hz
Mode 2/ 1.01 Hz
Mode 3/ 1.31 Hz
Mode 4/ 3.27 Hz
Mode 5/ 3.21 Hz
Mode 6/ 3.43 Hz
Mode 7/ 3.43 Hz
Mode 8/ 3.64 Hz
Mode 9/ 4.82 Hz
Mode 10/ 5.47 Hz
Fig. 10 Deform shape for mode 40 (11.4 Hz) in VSATs, (a) First floor, (b) Second floor, and (c) Third floor.
5.3 Vibration criteria (VC) analysis
Further analysis was carried out on vibration criteria response for each floor using VSATs to obtain the vibration serviceability. Fig. 11 shows the structure layout of a floor in the VSATs. It shows the location of the beams and the columns. All of the three floors have similar layout of beams and columns.
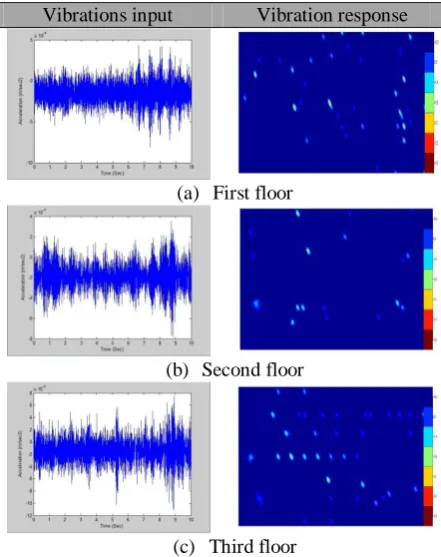
Fig. 12 shows vibrations input on each floor and also the vibration response after applying the inputs from field measurement. All floors show the same results of vibration criteria response. The floors are located at above ISO standards when referring to generic criteria guideline by Gordon [6].
Dark blue areas represent the areas with the highest VC level which is above ISO standards, perceptible to vibrations and appropriate to office and residential areas and also have no sensitive areas. Therefore it is suggested
that the dark blue areas unsuitable for sensitive equipment. Dark chocolate is the most suitable area to accommodate sensitive equipment for the analysis.
Fig. 11 Structure layout of a floor in VSATs.
Vibrations input Vibration response
(a) First floor
(b) Second floor
(c) Third floor
Fig. 12 The vibration criteria analysis on each floor for Registrar office building.
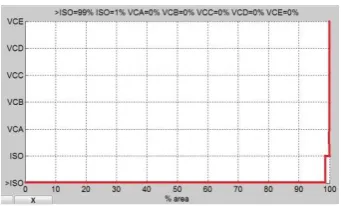
from passing vehicle’s vibration is acceptable. The vibration induced by passing vehicles would not affect the building structure and also the occupants. The vibration level is also acceptable and will not damage nor affect any office equipment in this building such as computers, cameras, photocopy machine and more.
Fig. 13 The percentage of vibration response on floor.
6
Conclusions
Based on the results obtained, UTHM's Registrar office building is complying with the ground borne vibration sensitivity standards, when referring to the generic vibration criteria guidelines. This is because, according to the study, the vibration level for this building is above ISO standard. This means that the vibration incurred by the building have no impact to the structure, peoples, and equipment which located in the building. This office building is built within the acceptable limit of ISO guidelines.
Vibrations could be easily felt if there is any source of vibration being induced to the ground such as from the heavy passing vehicle such as busses. Nevertheless, vibration occurred in the building is often being ignored especially in our country as it happens in a very small frequency as this country is not the earthquake-possibility area. Apart from being neglected, the vibration induced to the building still need to be studied in order to ensure that the level of vibration induced is acceptable and safe for the occupants of the building. It is very important to ensure that the vibration level does not exceed the recommended standard in tolerance of the office equipments such as computers, machines and more, the occupants and the structure of the building itself. Therefore, the objectives had been achieved where as the structural response on the UTHM's Registrar office building subjected to the ground vibrations input is acceptable and does not exceed the vibration level based on the vibration criteria standard.
Acknowledgment
The authors would like to thank to the staff at Development and Property Management Office (PPH), UTHM for supplying the structural drawing of Registrar office.
References
[1] Carl, E.H., David A.T., and Lance D.M. Transit noise and vibration impact assessment. Federal Transit Administration, Washington, United States, (2006).
[2] Griffin, M.J. Handbook of human vibration. Elsevier Academic Press, London, United Kingdom, (1990). [3] Hunaidi, O. Traffic vibrations in building.
Construction Technology Update, Ottawa, Canada (2000). C o
[4] Geert, L., and Geert, D. Study of determining factors for traffic induced vibrations in buildings.
Research Report BWM-2001-06, Leuven, Belgium, (2001).
[5] Amick, H. On generic vibration criteria for advanced technology facilities: with a tutorial on vibration data representation. Journal the Institute of Environmental Sciences, Volume XL, (1997), pp. 35-44.
[6] Gordon, C.G. Generic criteria for vibration sensitive equipment. Proc. of the International Society for Optical Engineering, San Jose, United States, (1991). [7] Gordon, CG. Generic criteria for vibration sensitive
equipment. Optomechanical Engineering and Vibration Control, Volume 3786, (1999), pp. 71-85. [8] Segerlind, L.J. Analisis unsur terhingga gunaan. 2nd Edition, University Teknologi Malaysia, Skudai, Johor, Malaysia (1997).
[9] Pavic, A., Brownjohn, J.M.W., and Zivanovic, S. VSATs software for assessing and visualising floor vibration serviceability based on first principles.
Proc. of Structures Congress, Orlando, United States, (2010).
[10] Felippa, C.A. Introduction to finite element methods. University of Colorado, Boulder, United States, (2004).
![Fig. 2 Passage of a bus on a transition between an asphalt surface and paved surface [4]](https://thumb-us.123doks.com/thumbv2/123dok_us/8440565.1701247/2.595.326.531.258.399/fig-passage-bus-transition-asphalt-surface-paved-surface.webp)
![Fig. 3 Generic vibration criterion (VC) [6].](https://thumb-us.123doks.com/thumbv2/123dok_us/8440565.1701247/3.595.306.538.428.726/fig-generic-vibration-criterion-vc.webp)
![Table 1 (b) Application and interpretation of the generic vibration criterion (VC) curves for amplitude below than 12.5 μm/s [6]](https://thumb-us.123doks.com/thumbv2/123dok_us/8440565.1701247/4.595.58.291.123.401/table-application-interpretation-generic-vibration-criterion-curves-amplitude.webp)
![Fig. 8 The structural vibration analysis process [11].](https://thumb-us.123doks.com/thumbv2/123dok_us/8440565.1701247/5.595.317.530.83.216/fig-structural-vibration-analysis-process.webp)